Ethylene Production in the Petrochemical Industry: Competitive Risks and Impacts of the EU Emission Trading Scheme
The European petrochemical industry is facing significant challenges that threaten its global competitiveness. Key challenges are the rising energy costs and a global increase in overcapacity for critical petrochemical building blocks, including ethylene, propylene, butadiene, benzene, mixed xylol, and toluene (Berry C., 2024). The European Union Emissions Trading Scheme (EU ETS), established with the aim to facilitate the reduction of greenhouse gas emissions in the face of climate change, also imposes further economic burdens on the industry. European emitters must purchase CO2 allowances (EUAs), while the Carbon Boarder Adjustment Mechanism (CBAM) does not provide full compensation for imports of chemicals from non-EU countries, exacerbating competitive disadvantages. This study conducts a comparative analysis of the competitiveness between the EU and the US in 2023, focusing on naphtha- and ethane-based steam cracking. The calculation of variable production costs for 2023 shows a competitive disadvantage for EU producers, with variable production costs in Europe being $200–$380 higher per ton compared to the US. The situation is further exacerbated by the cost of EUAs, which could increase production costs by up to 11.5% by 2030. The introduction of the EUAs for European CO2 emitters without cost compensation by considering imports via the CBAM leads to a further deterioration of the competitive situation. EUAs costs could represent up to 11.5% of variable production costs by 2030, depending on the technology and forecast. This study highlights the compounded impact of rising production costs and environmental regulations on the competitiveness of European ethylene production.
Keywords: Production costs, Cost breakdown, Steam cracking, Ethylene, Competitive analysis, EU ETS
Introduction
The decision by Versalis, the petrochemical subsidiary of the Italian oil company Eni, to close the steam cracker in Porto Marghera (Italy) in 2021 highlights both an immediate impact on the supply of petrochemicals (e.g., ethylene) and potential long-term structural shifts in the European petrochemical industry (Scafetta P., 2021). This closure, which reduces Italy’s ethylene production capacity, signals a broader trend: Italy, once a net exporter of ethylene, is now becoming a net importer (Scafetta P., 2021). The steam cracker, responsible for producing light olefins through the energy-intensive process of thermal cracking, is a critical part of the petrochemical value chain (Ren T., 2006). Steam cracking (thermal cracking) is the most commonly used process for the production of short-chain hydrocarbon compounds, including ethylene, propylene and aromatics (Ren T., 2009; Haszeldine R., 1960). Naphtha, derived from crude oil, is the primary feedstock used in steam cracking, with naphtha accounting for 70% of the feedstock used in European steam crackers in 2021, followed by propane, butane, and liquified petroleum gas (LPG) (cefic, 2024; Seifzadeh Haghighi S., 2013; Sedighi M., 2013). In contrast, regions like the USA and the Middle East utilize gaseous hydrocarbons, particularly ethane, as feedstock (Zimmermann H., 2012; Worrell E., 2000).
The European Union (EU), with its limited domestic supply of raw materials, relies heavily on imports for the petrochemical industry. The ongoing decline in crude oil production from European countries like Norway and the UK exacerbates this dependency (Eurostat, 2023). This dependency has historically been a competitive disadvantage for European petrochemicals, from refineries to polymer production. The geopolitical instability caused by the war in Ukraine, coupled with reduced exports of Russian crude oil and natural gas, has further strained the EU’s raw material and energy supply chains (McWilliams B., 2023). These disruptions have led to a significant increase in energy costs, which remain elevated more than a year after the conflict began (Alexandros N., 2024). This burden has intensified the challenges faced by energy-intensive industries, including petrochemicals, as high energy costs now directly undermine their global competitiveness (Abhinandan N., 2023).
Another significant challenge is global overcapacity in ethylene production, which reached 218 million tons in 2023 (Richardson J., 2023), and the increasing use of alternative feedstocks, such as gas-based crackers, which offer more competitive cost structures. At the same time, investment in post-consumer plastic recycling and alternative raw materials, such as pyrolysis oil, signals a potential structural shift towards a more circular petrochemical industry (Kusenberg M., 2022; Eni, 2022). While substituting fossil-based feedstock with post-consumer plastic is not yet feasible on a large scale due to technical and capacity constraints (Kusenberg M., 2022; Chang S., 2023; Kabeyi M., 2023), it presents a promising long-term opportunity to enhance European competitiveness. Further reducing CO2 emissions in the production of ethylene, particularly through the use of electricity for steam generation, is another potential strategy to improve the sustainability and competitiveness of the European petrochemical sector (Mynko O., 2023; Layritz L., 2021). An initial pilot plant for this was commissioned in 2024 at BASF‘s Verbund site in cooperation with Sabic, a Saudi Arabian petrochemical company, and Linde, an industrial company based in Dublin, Ireland with a focus on industrial gases and process plant development (Nonnast T., 2024).
This move towards innovation is not only driven by technological advancements but also by policy pressures, particularly the EU Emission Trading Scheme (EU ETS). The EU ETS, as the central instrument of the EU‘s climate policy, has been designed to reduce greenhouse gas (GHG) emissions by setting a cap on the total emissions allowed from key sectors, including petrochemicals. The scheme allocates a limited number of European Union Allowances (EUAs), which are tradable permits that allow companies to emit a certain amount of CO2. Over time, the cap is reduced, encouraging companies to adopt greener technologies or face increasing costs for non-compliance (EU-Commission, 2024). The EU ETS was introduced under the EU Emissions Trading Directive to ensure that the EU meets its climate targets in a cost-effective manner, and it has been progressively aligned with the objectives of the EU Green Deal and the Paris Agreement. By implementing a carbon pricing system, the EU aims to incentivize companies across industries to reduce their emissions. However, for energy-intensive sectors like petrochemicals, the gradual reduction of EUAs poses a significant challenge. As the projected long-term trend of the carbon price increases, companies within the EU are confronted with rising production costs, which could undermine their global competitiveness, particularly in relation to regions such as the US and Saudi Arabia, where energy costs and regulatory frameworks are more favorable.
The impact of the EU ETS on production costs varies across industries, with the chemical sector facing unique challenges due to its high emissions intensity (Tomás R., 2010). Options for managing these increased costs include passing them on to customers, distributing them along the value chain, or absorbing them through reduced margins (Cooper S., 2024). In this context, the introduction of the Carbon Border Adjustment Mechanism (CBAM) is a critical step in addressing the competitive disadvantages posed by EU carbon pricing. The CBAM aims to prevent carbon leakage by applying a carbon-based tariff to imports from non-EU countries, ensuring that foreign producers face similar emissions-related costs to their European counterparts (European Commission, 2024). Currently, CBAM covers high-emission industries such as cement, steel, aluminum, and fertilizers, but its potential expansion to basic chemicals could provide essential protection for Europe’s petrochemical sector against foreign competition (European Commission, 2024).
To sum up, previous studies indicate that the European petrochemical industry faces a competitive disadvantage in feedstock supply compared to regions like the US and Saudi Arabia (Boulamanti A., 2017). Energy disruptions from the war in Ukraine have worsened this situation (Creutzig F., 2022). Additionally, the gradual reduction in available EUAs without sufficient compensation through CBAM for rising costs from foreign competition (European Customs Portal, 2023) may threaten the long-term supply of domestically produced chemicals to Europe. Domestic production of key raw materials like ethylene, propylene and aromatics is important for the production of consumer goods such as tires and packaging, as well as specialized products such as pharmaceuticals and high-performance plastics for the automotive industry (Young, 2022; Zhou, 2021). Guaranteeing the supply of key raw materials through domestic production is important for European industry, as it reduces the effect of geopolitical and logistical disturbances such as tariffs and blocked supply routes. This paper aims to quantify the competitive disadvantage faced by the European petrochemical industry in comparison to major producers like the US, and to assess the impact of the linear reduction of EU allowances (EUAs) on variable production costs. To the best of our knowledge, this is the first study to address this gap by answering the following research questions: How far was this competitive disadvantage aggravated by interruption and resulting increase in energy costs, and what further impact can EU ETS have on this competitive disadvantage without compensation from CBAM. The paper argues that policymakers must urgently consider including basic chemicals in the Carbon Border Adjustment Mechanism (CBAM) as a means of mitigating this competitive disadvantage.
This paper begins by providing an overview of the EU Emission Trading Scheme (ETS), its legal framework within the context of the EU Green Deal, and its economic implications for the petrochemical industry (Section 2). Section 3, titled ‚Methodology,‘ outlines the research design and approach employed in this study. Section 4, ‚Results,‘ presents a competitive analysis of the European petrochemical sector, benchmarking it against other key global players such as the US, Saudi Arabia, and China, offering an initial understanding of the industry’s position. Following this, the paper compares variable production costs for different types of steam crackers in Europe and the US, investigates the impact of EU allowances (EUAs) on production costs, and provides a cost estimation through 2030. This analysis aims to guide policymakers in considering the inclusion of basic chemicals in the Carbon Border Adjustment Mechanism (CBAM). In Section 5, the paper discusses the key findings, acknowledges the limitations of the analysis, and proposes avenues for future research. Finally, Section 6 provides a summary of the main conclusions drawn from the study.
The EU ETS: Challenges and Opportunities
The EU Emissions Trading System (EU ETS) is a cornerstone of the European Union‘s climate policy, introduced in 2003 and launched in 2005 with the aim of reducing GHG emissions in a cost-effective way (EU Commission, 2003). It forms an essential part of the EU‘s broader strategy to meet its climate targets under the European Green Deal, with the overarching goal of achieving net-zero emissions by 2050 (EU Commission, 2019). By putting a price on carbon, the EU ETS incentivizes industries to reduce emissions by either investing in cleaner technologies or purchasing emissions allowances (EUAs) to cover their carbon output. Indeed, The EU ETS Directive operates on a ‚cap-and-trade‘ mechanism, which (a) sets a limit on GHG emissions from major emitters by distributing emission allowances and (b) enables the trading of these allowances to facilitate cost-effective emission reductions (Woerdman, 2015). The cap is progressively lowered each year to align with the EU‘s climate goals, ensuring a steady decline in overall EU emissions. By 2023, the EU ETS contributed to a reduction of approximately 47% in emissions from European power and industrial plants compared to 2005 levels (EU-Commission, 2024).
The EU ETS is not without its challenges, particularly for energy-intensive sectors such as petrochemicals. While the scheme provides incentives for decarbonization, it also places a financial burden on industries that rely heavily on carbon-intensive processes. The gradual reduction of the available EUAs over time, without immediate compensation for rising production costs, has led to concerns over the competitiveness of European industries. European companies are at a distinct disadvantage when compared to their counterparts in regions with more favorable regulatory environments, such as the US and the Middle East. The US, for instance, has adopted a more flexible regulatory approach, and its relatively lower energy prices give American petrochemical companies a price advantage. Similarly, in the Middle East, energy costs are often subsidized, and environmental regulations are less stringent, which allows companies to produce petrochemical products at a lower cost.
While European industries are bound by some of the world’s most stringent carbon pricing mechanisms, their competitors in regions like the US and the Middle East operate under less restrictive conditions. This disparity has led to concerns about carbon leakage. Where compensation measures are not put in place, companies may decide to relocate their operations to countries with less stringent emissions regulations, thus negating the environmental benefits achieved by the EU (Chen Y., 2024; Martin R., 2022; Cozma I., 2022). In sectors like petrochemicals, which are heavily integrated into global supply chains, the risk of carbon leakage is especially pertinent, as EU companies face rising costs that are not shared by foreign competitors.
Recognizing these challenges, the EU has introduced the Carbon Border Adjustment Mechanism (CBAM), designed to level the playing field by imposing a carbon price on imports from countries that do not have comparable carbon pricing systems (EU Commission, 2023). Starting in 2026, CBAM will gradually replace the current free allowance system for sectors such as cement, iron and steel, aluminum, fertilizers, electricity, and hydrogen, with the transition taking place over a ten-year period (Ambec, 2024). While this shift marks a step forward in addressing carbon leakage, its effectiveness in mitigating competitive disadvantages faced by European petrochemical companies remains uncertain. Currently, the CBAM focuses on imported goods and does not fully address the internal cost disparities between European producers and those operating under less stringent environmental regulations. Moreover, the eventual success of the mechanism will depend on the scope and design of its implementation, as well as the rigor of its enforcement. As CBAM phases in, careful calibration will be critical to ensure it effectively supports EU climate goals while safeguarding industrial competitiveness.
In conclusion, while the EU ETS and the introduction of the CBAM represent significant advancements in addressing emissions and preventing carbon leakage, they may not suffice to ensure a truly level playing field for European industries. A broader and more integrated strategy is essential to balance the EU’s ambitious climate goals with the economic viability of critical sectors, which are vital to the European economy. This is not just a matter of economic competitiveness. If production shifts abroad to regions with weaker environmental regulations, the emissions avoided within the EU may simply occur elsewhere, undermining global climate efforts. By carefully implementing and enforcing the CBAM, the EU can not only support its industry but also incentivize cleaner production methods internationally, contributing to global environmental sustainability.
Methodology
In order to reassess the competitiveness of the European petrochemical industry regarding the changes occurred in 2022 following the Russian Invasion of the Ukraine, the development of ethylene production capacities in the USA, Saudi Arabia and China was first compared with the European one. In addition to the comparison of capacity developments to produce light olefins and the calculation of production costs (Boulamanti A., 2017), the import trend into the EU and the effect of the EU ETS on the production costs were both considered in this study.
The change of the capacities of one of the main building blocks, namely ethylene, in the petrochemical industry was analyzed here in order to examine the development of the total capacity of the countries considered over the last 10 years. Among the nations considered are these with the highest capacity of ethylene production including the USA, Saudi Arabia, and China as well as the community of nations of the EU (Bielicki J., 2014). Information on capacity developments was provided by Chemical Market Analytics, a Dow Jones company (OPIS, Dow Jones, 2023).
Import trends into the EU was determined using the Eurostat database (Eurostat, 2024) and analyzed for ethylene and the main thermoplastic polymers of ethylene. The focus on the polymers was on polyethylene (PE) in the three forms of high-density PE (HDPE), low-density PE (LDPE) and linear low-density PE (LLDPE). Imports from Saudi Arabia and the USA were analyzed as major net exporters of thermoplastics, as well as China, which has built up large capacities over the last 10 years. The following HS codes (Harmonized Commodity Description and Coding System for International Trade) for polymers were used for HDPE “390120” and for LDPE and LLDPE “390110” (European Customs Portal, 2023). The HS code “390120” represents polyethylene with a specific density of >= 0.94, in primary form (HDPE). The HS code “390110” indicates all imports of polyethylene with a specific density of < 0.94 (LDPE & LLDPE).
The single largest source of price information was the Chemical Market Analytics price database (OPIS, Chemical Market Analytics, 2023), other sources were Our World in Data, Intratec, Eurostat and the US Department of Energy. The consumption factors of the publication of Aikaterini Boulamanti were used to calculate the variable production costs (Boulamanti A., 2017).
3.1 Variable production cost calculation
An assessment of the competitive situation of steam crackers in Europe was made on the basis of an overview of capacity expansions in the USA, Saudi Arabia, and China with developments in the EU. In addition to the capacity developments, the imports from these countries into the EU were also considered, both of the monomer ethylene and of the polymers (here HDPE, LDPE and LLDPE). By calculating the variable production costs in the USA and the EU for 2023, the competitive disadvantage, which has been significantly exacerbated by the energy crisis, was determined. Additionally, the impact of the EU ETS with the linear decrease of EUAs on European production costs has also been calculated and a forecast till 2030 with stable variable production costs has also been considered.
The paper of Boulamanti et al. already compared the production costs between the EU and the USA for basic chemicals (including ethylene) in order to determine the competitive situation between the countries in the year 2016. The variable production costs in the USA and Europe were calculated using the consumption factors and the average annual prices of the individual cost items for 2023. The production of ethylene based on a steam cracker with ethane feed and a steam cracker with naphtha feed were compared. The variable production costs were calculated by multiplying the consumption factor with the respective price (OPIS, Chemical Market Analytics, 2023).

As labor costs in the production of ethylene are not a large cost position and do not differ significantly between the two regions (USA and the EU), this cost item was not included in the calculation of variable production costs.
To calculate the impact of EUAs in the production costs for European Steam Cracking including the development in the CO2 emissions, the production forecast for ethylene and the reduction of EUAs till 2030 the compound annual growth rate (CAGR%) was used. The CAGR% is calculated by dividing the end value after the period (V(tn)) by the start value (V(t0)) and then square-rooting this fraction by the factor 1 divided by the period (1/tn-t0). The result is then subtracted by 1 to obtain the decimal number for the growth. The following formula was used for this:
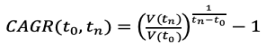
The additional costs of EUAs in the EU ETS are calculated assuming constant variable production costs over the period up to 2030. For the calculation of the share of EUA costs, both the increase in ethylene production based on the forecast of OPIS/Dow Jones (OPIS, Dow Jones, 2023) (CAGRC2) and the development of CO2 emissions based on the OECD database for the manufacturing industry in the EU are considered (CAGRCO2). The development of CO2 emissions in the manufacturing industry in the EU fell by 1.79% per year from 2005 to 2021, while in the USA they rose by 0.35% per year over the same period. These trends of CO2 emissions in the EU have been used as a forecast for the calculation of the emissions with the same decline over the years till 2030. The development of the costs without a further reduction in CO2 emissions was also calculated. The amount of EUAs (LETS) will be reduced linearly by 2.2% from 2021 to 2030 according to the new EU directive of 2021 (EU-Commission, 2024). The reduction in certificates was included in the total costs, considering the CO2 emissions for the production of one ton of ethylene (C0 CO2) in the respective production process.

Results
4.1 Ethylene capacities
The trend over the last decade shows a sharp rise in the number of installations in China, while the number of installations in other countries/regions has changed at a much slower rate (see Figure 1).
In China, the number of installations was three times higher than in 2012, once again a reflection of the country‘s investment activity. An increase at a higher pace can be seen in the USA since 2017, while there has been a decline in the number of installations in Europe. The number of installations in Saudi Arabia has remained almost constant.
The development of ethylene capacity is characterized by solid growth in China and the USA. In China, ethylene production capacity has increased three times in the last 11 years. Capacity in the USA has also increased by 70%. Capacity in Saudi Arabia has increased by 14%. Only the capacity to produce ethylene in Europe has fallen by 7% over the last 11 years. Extraordinary capacity increases in China have already overtaken European capacity in 2015 and the US in 2021. The US now has the second highest capacity among the countries and regions compared.
 Figure 1: Capacity for the production of ethylene in the US, China, Saudi Arabia, and the EU (OPIS, Dow Jones, 2023)
4.2 Import development
In addition to the developments in ethylene production capacities, the trend in imports of derivatives into the EU from the previously compared countries was also examined (see Figure 2). The years from 2012 to 2023 were presented here as the time horizon. Firstly, the olefins were analyzed in order to examine the development of monomers for the EU. Secondly, the derivatives (polymers) of ethylene were considered, as the transport of polymers has a cost advantage over monomers – ethylene is a gas, while the polymers are solid under normal conditions. The following HS code was used for the development of imports of ethylene “2901210”. The increased capacities, particularly in ethylene production, are also reflected in the increased imports of ethylene into the EU. Imports of ethylene from the USA have risen sharply in the last two years, putting additional pressure on the European value chain. The volume of imports from the USA has multiplied in the last two years, while the share from the other two countries analyzed (Saudi Arabia and China) has remained constant or fallen slightly. The import volumes of ethylene from the USA fell again modestly in 2023, though they remain above pre-energy crisis levels.

Figure 2: Ethylene imports into the EU based on eurostat data for the last decade (Eurostat, 2024)
A decrease in imports from Saudi Arabia can be seen in HDPE since 2018 and in LDPE and LLDPE since 2017 (see Figure 3). Imports from the USA have increased significantly over the same period (see Figure 3). As with LDPE and LLDPE, the volume of HDPE imported from the USA has doubled. The quantities of HDPE from Saudi Arabia have fallen by a third since 2018 and by two-thirds for LDPE and LLDPE.
In the cumulative analysis of PE imports, the decrease in imports with the simultaneous increase in imports from the USA is even more striking (see Figure 3). Imports from China have also increased but on a much lower level. The largest exporters to the EU in this analysis are the USA and Saudi Arabia. The increase in the USA, now the largest exporter of PE to the EU, is directly related to the capacity increases in the USA since 2017.

Figure 3: PE imports into the EU from the US, Saudi Arabia, and China by type (Eurostat, 2024)
4.3 Steam cracking
The USA has expanded ethylene capacities in the last 10 years by 70%, and import trends show an increase in ethylene and ethylene derivatives from the USA to the EU. The shale gas boom in the USA has also ensured that American steam cracker operators have another source of feedstock (ethane) at their disposal (Stangland E., 2018; Chang H., 2014). The share of gas-based steam crackers in the USA is around 57%, while in Europe, it is only 21%. Naphtha-based steam crackers are by far the most common in Europe (70%) and can be explained by the historical development of the European petrochemical industry and the limited supply of gaseous hydrocarbons in the European petrochemical value chain (Boulamanti A., 2017). In the USA, naphtha-based steam crackers account for 43% of total capacity. For this reason, both technologies were used to calculate the variable production costs in the USA and Europe. The comparison and choice of technology serve to illustrate the actual competitive situation between the USA and the European petrochemical industry in 2023. The Calculation of the European ethane costs has been done by using the American prices and adding the transportation costs for ethane towards Europe (Nguyen D., 2021). Looking at the calculation of variable production costs, it can be seen that variable production costs are lower for ethane-based steam cracking than for naphthabased steam cracking. Ethane-based steam crackers are significantly more cost-effective in terms of variable production costs in the USA than in Europe. Ethane as a feedstock for the production of ethylene in steam crackers has a cost advantage over naphtha-based steam crackers in Europe, but utility costs are still uncompetitive compared to the US. Feedstock costs comprise the largest share of variable production costs (see Figure 4). By-product credits are high in both regions but are $100-300/tons higher in Europe (see Figure 4). The utility costs are smaller, especially in the US. The utility costs in Europe are conspicuous, as they are significantly higher than in the USA at around $240-250/tons (see Figure 4). In the USA, utilities costs are around $60-70/ton.

Figure 4: Overview of the cost positions for the production of ethylene by type and region (USA and EU) in 2023 (Boulamanti A., 2017), (OPIS, Chemical Market Analytics, 2023)
Considering by-product credits, a comparison of the total variable production costs between the US and Europe shows that the US ethane-based ethylene production is significantly lower than the naphtha-based ethylene production in the US and Europe (see Figure 4). Naphthabased ethylene production costs are $599/ton in the USA and as much as $792/ton (without CO2 credit: $730/ton) in Europe. In contrast, ethane-based ethylene production costs are $123/ton in the USA and $506/ton (without CO2 credit: $460/ton) in Europe. Accordingly, the European naphtha-based steam cracking process will have variable production costs in 2023 that are almost six times as high as the American ethane-based steam cracking process. The production costs of ethylene via ethane-based steam cracking in Saudi Arabia has an even higher cost advantage than production in the USA (Boulamanti A., 2017). The steam crackers in China, like the steam crackers in Europe, are primarily naphtha-based and have cost disadvantages in the production of ethylene compared to ethane-based steam crackers. However, the steam crackers in China are younger and therefore less susceptible to maintenance and breakdowns than the older European steam crackers (Beacham W., 2024).
4.4 CO2 emissions and effect of missing CBAM consideration of HVC
The introduction of the EU ETS leads to a further cost factor in the production of ethylene and its derivatives (HDPE, LDPE, and LLDPE) compared to the global competition, which does not implement this trading system. The production of both the precursor (naphtha) from the crude oil refineries and the production of ethylene (energy-intensive industry) falls under the trading system and thus leads to an increase in the variable production costs of ethylene from the steam cracker (European Commission, 2024). The introduction of the fourth phase of the EU ETS with a faster decline in the supply of EUAs, combined with a change in energy supply towards emission-intensive coal-fired power generation due to the limitation of fossil energy sources (natural gas and crude oil), led to a tripling of EU ETS spots prices for one ton of CO2 in 2023 (Goldthau A., 2023).
In the publication by Ghanta et al., the GHG emissions were calculated in kg CO2-eq on the basis of the three feedstocks naphtha, ethane, and ethanol for the production of ethylene. For standardization, the production of 400 kilotons was considered in each case (Ghanta M., 2013). The energy source in all cases was natural gas (Ghanta M., 2013). The GaBi® database was used for the calculation in the publication (Ghanta M., 2013). As ethylene production based on steam cracking was compared in this publication, only the GHG emissions of these two processes are relevant here. The production of one metric ton of ethylene on the basis of naphtha leads to a cumulative GHG emission of 1.135 kg (CO2-eq), while the conversion of ethane produces 840 kg (CO2-eq) of GHG emissions (Ghanta M., 2013). The average spot price for a EUA in 2023 was $49.81 (€47.3) per ton of CO2 (Tiseo I., 2024). According to the calculation of the costs for the production of one ton of ethylene in the two processes under review, the EU ETS results in additional costs of $56.53 in naphtha-based and $41.84 in ethanebased steam cracking for the European petrochemical industry (see Figure 4).
Imports of ethylene and downstream derivatives are not yet included in the CBAM (European Commission, 2023). The EU ETS benchmark values for basic organic chemicals, including ethylene and its derivatives, cannot currently be used to determine GHG emissions due to technical problems (European Commission, 2023). Considering the additional pressure for steam cracker operators and polymer producers due to the introduction and gradual reduction of the total number of EUAs in the EU ETS with the increased variable production costs and the resulting increase in imports of ethylene and derivatives from nonEU countries, the result is a business environment with significant competitive disadvantages for the European petrochemical industry. Steam cracking for ethylene production even had considerably higher production costs compared to the USA in 2017, even before the upheavals in energy costs in Europe due to the Ukraine-Russia war and the associated sanctions against Russian raw material supplies (Boulamanti A., 2017). Competitive disadvantages in production costs will be intensified by the prolonged exclusion of petrochemicals in the CBAM.
Additional costs of EUAs on production costs in Europe are 8,7% in ethane-based Steam Cracking and 7,5% in naphthabased Steam Cracking for 2023 (see Figure 5). The linear decrease in EUAs and the development of ethylene production forecast by OPIS/Dow Jones were considered here.

Figure 5: Development of the additional costs of EUAs on the production costs with actual energy costs depending on the consideration with and without CO2 reduction for ethane and naphtha-based Steam Cracking
The advantage of American steam crackers stems from the high proportion of ethane-based crackers, which, in addition to the lower production costs for ethylene, also have lower CO2 emissions than naphtha-based steam crackers (Ren T., 2008).
An ethane-based steam cracker in Europe would have some competitive advantages in ethylene production compared to the naphtha-based steam crackers. The decision of INEOS to build an ethane-based steam cracker in Belgium (INEOS, 2023) thus proves to be a further risk for the established steam cracker landscape in Europe.
Discussion
The findings on import trends and capacity expansions in ethylene production through steam cracking highlight the significant competitive pressures faced by European producers. A cost comparison reveals that European steam crackers incur substantially higher variable production costs than their U.S. counterparts, primarily due to differences in feedstock availability and pricing. Additionally, the older infrastructure of European steam crackers increases susceptibility to production losses and repair costs, further exacerbating their competitive disadvantage.
Capacity expansions have been concentrated in regions with favorable economic and regulatory conditions for ethylene production. The Middle East and the U.S., benefiting from abundant, low-cost feedstocks like ethane, and China, with its rapidly growing market demand and strategic investments, have attracted the bulk of global investments. Even for ethylene production via ethane steam cracking—recognized as a cost-effective alternative— European costs exceed U.S. costs by approximately $300 per ton. Notably, ethylene production costs via ethane in Europe align with those of naphtha-based production in the U.S., underscoring Europe’s unfavorable cost position.
The introduction of the EU ETS compounds this disparity by increasing production costs for European ethylene producers, as steam cracking is a significant source of CO₂ emissions. The linear reduction of allowances under the EU ETS will likely intensify these cost pressures. Without adequate compensation mechanisms under the CBAM, European producers risk carbon leakage, where production shifts to regions with less stringent environmental regulations, undermining the EU’s climate goals and industrial competitiveness. Notably, the CBAM’s gradual implementation from 2026 and its eventual replacement of free allowances for certain sectors highlight the urgency of its careful calibration to prevent unintended market distortions.
From a geopolitical perspective, maintaining a certain level of domestic feedstock production is critical to ensuring resilience against, for instance, potential supply chain disruptions and trade embargoes. The reliance on imports for key raw materials would leave the European petrochemical sector vulnerable to external shocks, weakening its long-term stability and sustainability. Policies supporting domestic feedstock diversification and investments in advanced production technologies could mitigate such vulnerabilities. Europe‘s competitive disadvantages, rooted in higher raw material and energy costs for fossil fuels, have been amplified by global market dynamics. Increased production capacities in regions like Saudi Arabia and the U.S. have enabled these producers to export surpluses to higher-cost regions like Europe, further straining local markets. Concurrently, countries such as China, previously net importers, are becoming increasingly self-sufficient, altering the global supply-demand balance. The pressure on Europe’s petrochemical sector underscores the importance of aligning industrial strategy with environmental objectives. Investments in carbon capture, utilization, and storage (CCUS) technologies, as well as advancements in green hydrogen for steam cracking, could reduce the carbon intensity of production while enhancing competitiveness (Layritz L., 2021). However, such transitions require robust policy support, including funding mechanisms under the EU Green Deal and collaboration between public and private stakeholders.
To safeguard the resilience and sustainability of Europe’s ethylene production, it is imperative to include basic chemicals like ethylene under the CBAM. This inclusion would help prevent carbon leakage, support domestic industries, and ensure alignment with the EU’s broader climate objectives. Without such measures, Europe risks not only losing industrial competitiveness but also failing to achieve its environmental and strategic goals. Furthermore, the integration of circular economy principles—such as chemical recycling of plastics—into ethylene production chains could offer a dual benefit: reducing reliance on virgin fossil feedstocks and lowering overall emissions.
Conclusion
As the heart of the petrochemical industry, the steam cracker is an energy-intensive process essential for producing downstream products used in various markets such as automotive, pharmaceuticals, packaging, and construction, due to the polymers derived from its monomers (Young B., 2022; Zhou X., 2021). However, the energy-intensive nature of steam cracking significantly contributes to variable production costs, while the process remains a major source of CO₂ emissions (Amghizar I., 2020). Efforts to reduce these emissions are underway, with the EU Emission Trading System (EU ETS) serving as a key driver, although it also increases production costs for European producers.
The last decade has seen significant increases in polyethylene (PE) imports to the EU, a trend likely to persist due to rising raw material and energy costs, exacerbated by post-COVID-19 market dynamics (Chen Y., 2023). Meanwhile, capacity expansions in major producing countries such as China, Saudi Arabia, and the USA have intensified competition, with the USA notably increasing its exports of both monomers and polymers. This expansion highlights structural risks for Europe’s petrochemical sector, which faces cost disadvantages even under normalized conditions for raw material and energy prices.
The EU ETS‘s linear reduction of free allowances further compounds these challenges. By 2030, emissions trading costs are projected to reach over 10% of production costs for naphtha-based and 11.5% for ethane-based steam cracking. Unless imports are subjected to equivalent costs through the Carbon Border Adjustment Mechanism (CBAM), European producers will remain at a disadvantage, further widening the competitive gap. Petrochemicals, such as ethylene, and their polymers are currently excluded from the CBAM, intensifying economic pressures on domestic producers. Including the six building blocks of the petrochemical industry and key downstream products in the CBAM would provide a level playing field for European producers. While production costs in Europe have historically exceeded those in regions with abundant, low-cost feedstocks (e.g., the USA and the Middle East), excluding these products from CBAM could also allow naphtha-based production in Asia to gain a competitive edge. Incorporating petrochemicals into the CBAM could mitigate the risk of further plant closures, ensuring the resilience of Europe’s petrochemical value chains. The downstream products of basic chemicals must also be considered in CBAM, otherwise the competitive disadvantage of European producers would be shifted backwards along the value chain.
Resilient petrochemical production is vital for safeguarding the EU’s broader supply chain and meeting industrial policy objectives. Petrochemicals are indispensable feedstocks for various end-use applications, including critical sectors such as healthcare and infrastructure. From a geopolitical perspective, maintaining a certain level of domestic feedstock production is critical to ensuring resilience against, for instance, potential supply chain disruptions and trade embargoes. The reliance on imports for key raw materials would leave the European petrochemical sector vulnerable to external shocks, weakening its long-term stability and sustainability. Policies supporting domestic feedstock diversification and investments in advanced production technologies could mitigate such vulnerabilities. However, as CO₂ emissions from petrochemical production are currently challenging to calculate (European Commission, 2023) standardized methodologies are urgently required to ensure these products can be effectively integrated into the CBAM. Failure to do so risks imposing a persistent cost burden exclusively on EU producers, undermining both industrial competitiveness and climate objectives.
The alignment of industrial policy with climate goals will require not only adjustments to the CBAM but also investments in sustainable technologies, such as lowcarbon feedstocks and advanced recycling methods. These measures, coupled with robust policy support, can help secure the long-term viability and sustainability of Europe’s petrochemical industry.
Further research could consider the impact of regulatory or geopolitical events on the variable production costs of the European petrochemical industry beyond the scope of the EUAs and CBAM. Technological developments towards more sustainable production processes, such as the use of pyrolysis oil or electricity as a furnace heating source, could also be reviewed. As previously mentioned, the production of basic chemicals in the petrochemical industry is crucial for securing the value chain in many industries (Young B., 2022; Zhou X., 2021) thereby increasing the resilience of the European industry.

References
Abhinandan N., et al. (2023). Energy crisis in Europe enhances the sustainability of green chemicals. Green Chemistry(17), https://doi.org/10.1039/D3GC01053H.
Alexandros N., et al. (2024). Three different directions in which the European Union could replace Russian natural gas. Energy(290), https://doi.org/10.1016/j. energy.2024.130254.
Ambec. (2024). Kleinman Center for Energy Policy. Retrieved 11 20, 2024, from https://kleinmanenergy.upenn. edu/research/publications/plugging-carbon-leaks-withthe-european-unions-new-policy/
Amghizar I., et al. (2020). Sustainable innovations in steam cracking: CO2 neutral olefin production. Journal of Reaction Chemistry & Engineering(2), https://doi.org/10.1039/ C9RE00398C.
Beacham W., de Berry C. (2024). ICIS. Retrieved 06 16, 2024, from https://www.icis.com/explore/resources/crackerclosures-europe/
Berry C. (2024). Independent Commodity Intelligence Services. (ICIS) Retrieved 05 30, 2024, from Chemical market overcapacity and weakening demand: a perfect storm: https://www.icis.com/explore/resources/chemicalmarket-overcapacity/
Bielicki J., et al. (2014). An Alternative Pathway for Stimulating Regional Deployment of Carbon Dioxide Capture and Storage. Energy Procedia(63), https://doi. org/10.1016/j.egypro.2014.11.757.
Boulamanti A., Moya J. (2017). Production costs of the chemical industry in the EU and other countries: Ammonia, methanol and light olefins. Renewable and Sustainable Energy Reviews(68), 1205-1212, https://doi.org/10.1016/j. rser.2016.02.021.
cefic. (2024, 02 15). Petrochemicals Europe. (cefic data) Retrieved from Petrochemicals Europe: https://www. petrochemistry.eu/about-petrochemistry/petrochemicalsfacts-and-figures/european-market-overview/
Chang H., Fengqi Y. (2014). Shale gas processing integrating with ethylene production: Novel process designs, exergy analysis, and techno-economic analysis. Industrial & Engineering Chemistry Research, p. https://doi. org/10.1021/ie5012245.
Chang S. (2023). Plastic waste as pyrolysis feedstock for plastic oil production: A review. Journal of Science of the Total Environment(877), 1-24, https://doi.org/10.1016/j. scitotenv.2023.162719.
Chen Y., et al. (2023). Impact assessment of energy sanctions in geo-conflict: Russian-Ukrainian war. Energy Reports(9), 3082-3095, https://doi.org/10.1016/j. egyr.2023.01.124.
Chen Y., et al. (2024). Emission trading schemes and crossborder mergers and acquisitions. Journal of Environmental Economics and Management, 124, 1-28, https://doi. org/10.1016/j.jeem.2024.102949.
Cooper S., et al. (2024). Meeting the costs of decarbonising industry – The potential effects on prices and competitveness (a case study of the UK). Journal of Energy Policy(184), https://doi.org/10.1016/j.enpol.2023.113904.
Cozma I. (2022). Investment Leakage and Relocation Under the EU ETS: Myth or Reality? https://aaltodoc.aalto. fi/items/83865b67-524e-419a-9679-06a4e3ade69d.
Creutzig F. (2022, June 13th). Fuel crisis: slash demand in three sectors to protect economies and climate. Retrieved February 1st, 2024, from nature: https://www.nature.com/ articles/d41586-022-01616-z
Eni. (2022, 07 04). eni.com. Retrieved from eni.com: https:// www.eni.com/en-IT/media/press-release/2022/07/ versalis-aign-agreement-forever-plast-plastics-recyclingplant-porto-marghera.html
EU Commission. (2003). eur-lex.europa.eu. Retrieved 11 10, 2024, from https://eur-lex.eurpüa.eu/legal-content/EN/ TXT/?uri=CELEX3A02003L0087-20240301
EU Commission. (2019). The European Green Deal. Retrieved 11 12, 2024, from https://eur-lex.europa.eu/legalcontent/EN/TXT/?uri=COM%3A640%3AFIN
EU Commission. (2023). Regulation (EU) 2023/956 of the European Parliament and of the Council of 10 May 2023 establishing a carbon border adjustment mechanism. Retrieved 11 19, 2024, from https://eur-lex.europa.eu/legalcontent/EN/TXT/?uri=CELEX%3A32023R0956.
EU-Commission. (2024). Climate.EC.Europa. Retrieved 11 20, 2024, from https://climate.ec.europa.eu/news-yourvoice/news/record-reduction-2023-ets-emissions-duelargely-boost-renewable-energy-2024-04-03_en
EU-Commission. (2024, 02 15). Taxation and Customs Union. Retrieved from Carbon Border Adjustment Mechanism: https://taxation-customs.ec.europa.eu/ carbon-border-adjustment-mechanism_en
European Commission. (2023). REGULATION (EU) 2023/956 OF THE EUROPEAN PARLIAMENT AND OF THE COUNCIL of May 10, 2023 establishing a carbon border adjustment mechanism. Bruxelles: European Union.
European Commission. (2024, 02 15). European Comission, Climate Action. Retrieved from Scope of the EU Emissions Trading System: https://climate.ec.europa.eu/eu-action/ eu-emissions-trading-system-eu-ets/scope-eu-emissionstrading-system_en?prefLang=de
European Customs Portal. (2023, 10 17). European Customs Portal. (European Union) Retrieved 10 17, 2023, from European Customs Portal: https://www.tariffnumber. com
Eurostat. (2023). Oil and petroleum products trends in 2022. https://ec.europa.eu/eurostat/web/productseurostat-news/w/ddn-20230504-1. Retrieved from https:// ec.europa.eu/eurostat/web/products-eurostat-news/w/ ddn-20230504-1
Eurostat. (2024). DS-059322 – EU trade since 2002 by HS2- 4-6 and CN8 (new content). Online.
Ghanta M., et al. (2013). Environmental impacts of ethylene production from diverse feedstocks and energy sources. Applied Petrochemical Research (Springer)(4), 167-179, https://doi.org/10.1007/s13203-013-0029-7.
Goldthau A., Youngs R. (2023). The EU Energy Crisis and a New Geopolitics of Climate Transition. Journal of Common Market Studies, 1-10, https://doi.org/10.1111/jcms.13539.
Haszeldine R. (1960). Industrial Chemistry of the Lower Olefines. Journal of Nature(186), 285-286, https://doi. org/10.1038/186285a0.
INEOS. (2023, 10). INEOS GETS CRACKING. (INEOS) Retrieved from ineos.com: https://www.ineos.com/inchmagazine/articles/issue-23/ineos-gets-cracking/
Kabeyi M., Olanrewaju O. (2023). Review and Design Overview of Plastic Waste-to-Pyrolysis Oil Conversion with Implications on the Energy Transition. Journal of Energy, https://doi.org/10.1155/2023/1821129.
Kusenberg M., et al. (2022). Maximizing olefin production via steam cracking of distilled pyrolysis oils from difficultto-recycle municipal plastic waste and marine litter. Science of the Total Environment(838), https://doi.org/10.1016/j. scitotenv.2022.156092.
Kusenberg M., et al. (2022). Opportunities and challenges for the application of post-consumer plastic waste pyrolysis oils as steam cracker feedstocks: To decontaminate or not to decontaminate? Waste Management(138), 83-115, https://doi.org/10.1016/j.wasman.2021.11.009.
Layritz L., et al. (2021). The potential of direct steam cracker electrification and carbon capture & utilization via oxidative coupling of methane as decarbonization strategies for ethylene production. Journal of Applied Energy(296), https://doi.org/10.1016/j.apenergy.2021.117049.
Martin R., et al. (2022). Industry Compensation under Relocation Risk: A Firm-level Analysis of the EU Emissions Trading Scheme. American Economic Review(104), 2482- 2508, https://doi.org/10.1257/aer.104.8.2482.
McWilliams B., et al. (2023). How would the European Union fare without Russian energy? Energy Policy(174), https:// doi.org/10.1016/j.enpol.2022.113413.
Mynko O., et al. (2023). Electrification of steam cracking as a pathway to reduce the impact of the petrochemical industry on climate change. Jorunal of Cleaner Production(427), https://doi.org/10.1016/j.jclepro.2023.139208.
Nguyen D., et al. (2021). Technical, economic and thermodynamic analysis for loading, storing, unloading and transporting of Ethane fluid. Journal of the Taiwan Institute of Chemical Engineers(120), 218-228, https://doi. org/10.1016/j.jtice.2021.03.035.
Nonnast T. (2024). BASF, SABIC, and Linde celebrate the start-up of the world‘s first large-scale electrically heated steam cracking furnace. Retrieved 05 31, 2024, from https://www.basf.com/global/en/media/newsreleases/2024/04/p-24-177.html
OPIS, D. J. (2023). Chemical Market Analytics. Chemical Price & Economics(October). Online.
OPIS, Dow Jones. (2023). Chemical Market Analytics. Chemical Capacity by Facility(October). Online: OPIS/Dow Jones.
Ren T., et al. (2006). Olefins from conventional and heavy feedstocks: Energy use in steam cracking and alternative processes. Energy(31), 425-451, https://doi.org/10.1016/j. energy.2005.04.001.
Ren T., et al. (2008). Steam cracking and methane to olefins: Energy use, CO2 emissions and production costs. Energy(33), 817-833, https://doi.org/10.1016/j. energy.2008.01.002.
Ren T., et al. (2009). Petrochemicals from oil, natural gas, coal and biomass: Production costs in 2030-2050. Resources, Conservation and Recycling(53), 653-663, https://doi.org/10.1016/j.resconrec.2009.04.016.
Richardson J., (2023, 03 08). icis.com. (ICIS) Retrieved 12 28, 2023, from ICIS: https://www.icis.com/explore/ resources/news/2023/03/08/10862161/blog-globaloversupply-of-petrochemicals-to-hit-218m-tonnes-in-2023- the-highest-in-any-year-since-1990/
Scafetta, P. (2021, 03 24). ICIS. Retrieved from ICIS: (https://www.icis.com/explore/resources/ news/2021/03/24/10621155/italy-s-petchems-units-faceuncertain-future-as-porto-marghera-set-to-close/).
Sedighi M., et al. (2013). Kinetic study of steam catalytic cracking of naphtha on a Fe/ZSM-5 catalyst. Fuel(109), 432-438, https://doi.org/10.1016/j.fuel.2013.02.020.
Seifzadeh Haghighi S., et al. (2013). Investigation of ethylene production in naphtha thermal cracking plant in presence steam and carbon dioxide. Chemical Engineering Journal(228), 1158-1167, https://doi.org/10.1016/j. cej.2013.05.048.
Stangland E. (2018). Shale Gas Implications for C2-C3 Olefin Production: Incumbent and Future Technology. Annual Review of Chemical and Biomolecular Engineering(9), 341-364, https://doi.org/10.1146/annurevchembioeng-060817-084345.
Tiseo I. (2024, 02 15). statista. Retrieved from Energy & Environment› Emissions: https://www.statista.com/ statistics/1329581/spot-prices-european-union-emissiontrading-system-allowances/#:~:text=The%20average%20 closing%20spot%20price,per%20metric%20ton%20of%20 CO₂.
Tomás R., et al. (2010). Assessment of the impact of the European CO2 emissions trading scheme on the Portuguese chemical industry. Energy Policy(38), 626-632, https://doi.org/10.1016/j.enpol.2009.06.066.
Woerdman, E. (2015). The EU Greenhouse Gas Emissions Trading Scheme. Essential EU Climate Law, 43-75.
Worrell E., et al. (2000). Energy use and energy intensity of the U.S. chemical industry. U.S. Department of Energy Office of Scientific and Technical Information(1), 1-34.
Young B., et al. (2022). Environmental life cycle assessment of olefins and by-product hydrogen from steam cracking of natural gas liquids, naphtha, and gas oil. Journal of Cleaner Production(359), https://doi.org/10.1016/j. jclepro.2022.131884.
Zhou X., et al. (2021). Produce petrochemicals directly from crude oil catalytic cracking, a techno-economic analysis and life cycle society-environment assessment. Journal of Cleander Production(308), https://doi.org/10.1016/j. jclepro.2021.127283.
Zimmermann H., Walzi R. (2012). Ullmann‘s Encyclopedia of Industrial Chemistry. Online: Wiley-VCH Verlag GmbH & Co. KGaA.
Appendix
Table 1: Number of facilities for the production of ethylene – data based on OPIS a Dow Jones Company

Table 2: Capacity overview for the production of ethylene – data based on OPIS a Dow Jones Company

Table 3: Consumption factors including the three cost blocks of feedstocks, by-product credits and utilities for the production of one metric ton of ethylene – overview from the following publication (Boulamanti A., 2017)

Figure 6: Simplified overview of the European and US petrochemical value chain – Fracking and the subsequent processing of the shale gas with the separation of high-purity ethane provides the US steam crackers with another source of raw materials

Figure 7: Number of ethylene facilities in the US, China, Saudi Arabia and the EUdata based on OPIS a Dow Jones Company
