Are you still comparing or already learning? Experience report of a Facility Management benchmarking for laboratory buildings
Abstract
The founding of the “IFMA Benchmarking® Research Group Chemistry, Pharma and Life Science” actually has its roots in the former professional association IFMA Deutschland e.V., which preceded the organization RealFM e.V.. The acronym was redesignated as „Industrial Facility Management Benchmarking“ and the right to this name was secured. With the founding of the research group in 2004, the goal was set to identify the most efficient concepts related to the special requirements of constructing and operating laboratory and office buildings in the chemical and pharmaceutical industry through benchmarking. The research group has grown to include 15 participating companies. The results of this long-standing and successful cooperation arebeing increasingly acknowledged outside of the research group and more and more inquiries from third party companies are being made. The present article entails key findings of our conducted benchmarking study.
1 The Concept
Upon beginning the work of the benchmarking research group all participants agreed that a thorough methodic preparation is the decisive factor for success. A particularly important part of this is the decision not to use benchmarking as a pure process of comparing figures, a practice which is unfortunately applied too often. The actual benchmarking, the analysis of the causes and the conditions for the expected deviations between the specific variables for each building should be in the focus point.
To reach these goals, a method developed by the „Bauakademie Gesellschaft für Forschung, Entwicklung und Bildung mbH“ for working in closed benchmarking pools (agito®-Method) was employed. The core of this method is a rare organization form of benchmarking in the industry by today’s standards: The so-called benchmarking wheel: all participants in the benchmarking are familiar with each other and have set the goals and frame conditions of the benchmarking cooperatively. As opposed to the organization form of the benchmarking star, where the benchmark coordinator sets the goals of the benchmarking and all participants are exclusively in contact with this coordinator, the participants of the benchmarking wheel have the opportunity to exchange information with each other. Only in this manner is the actual sense of the benchmarking evident: learning.
The benchmarking itself, which is continuously carried out in an anonymous manner in accordance with the competition law, is used by the participants to determine their own standing in a group of comparable companies. The main focus point of the work consists of Best Practice Workshops, where the participants discuss experiences and concepts in a structured environment. This moderated experience exchange continuously provides all participants with inspiration and potential for improvement. Solution methods that are widely accepted, the so called Good Operating Practices, are universally revised and are used by the participants as a guideline for developing company specific solutions
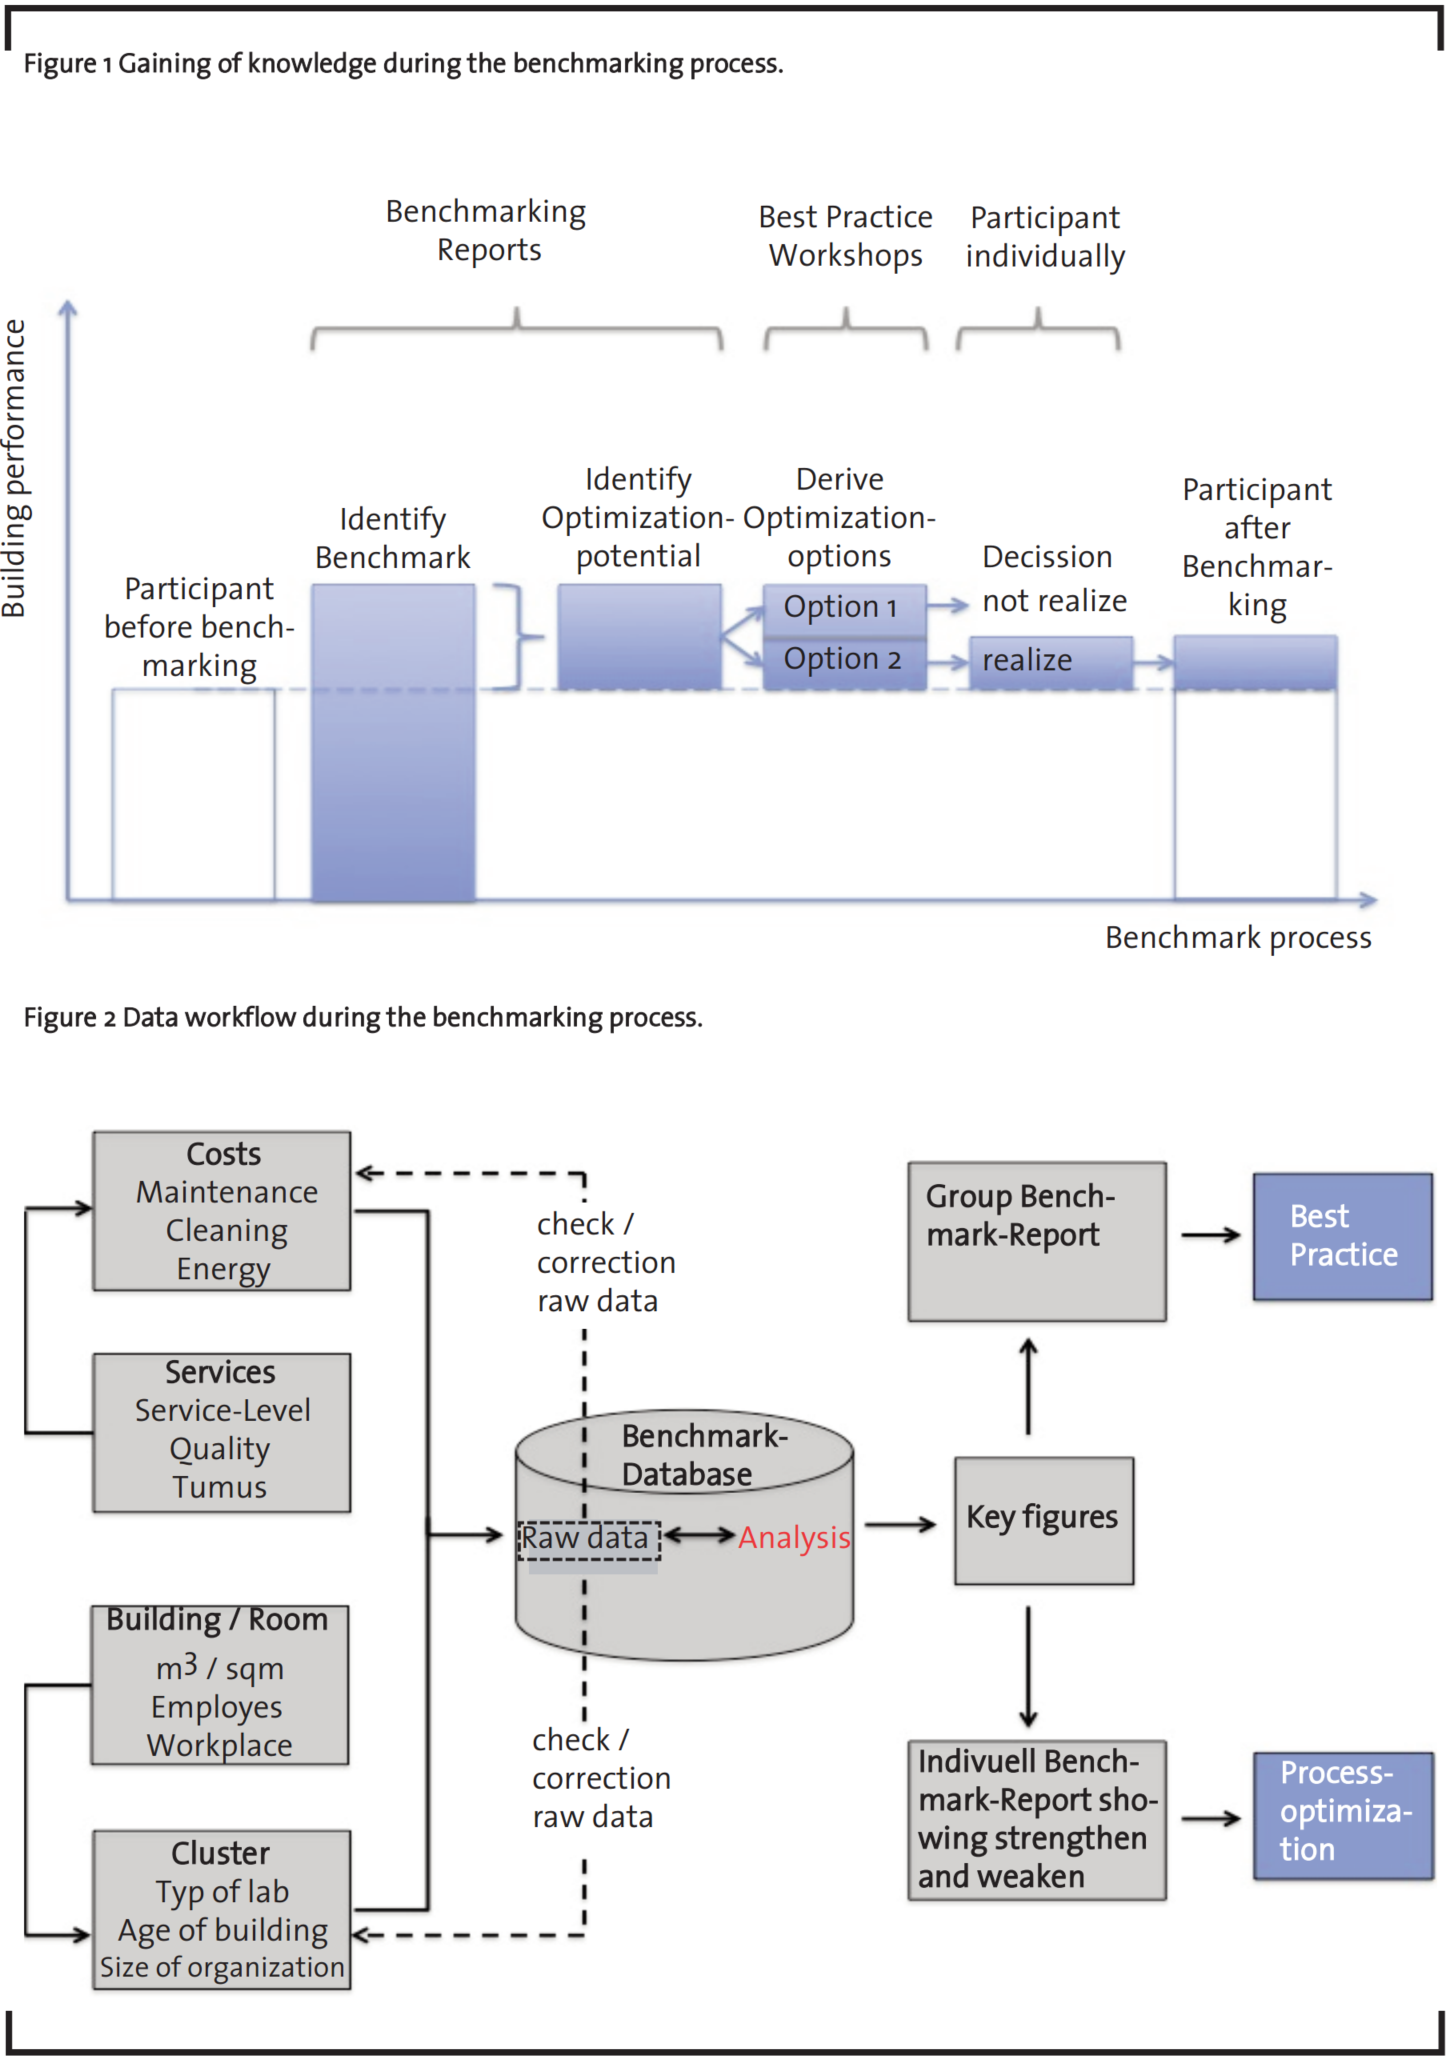
By starting from the basic situation of the participants before benchmarking, figure 1 illustrates the gaining of knowledge obtained during the benchmark process. Each participating company receives its individual results and can deduce the theoretical optimization potential from the benchmarking report. Practical approaches as well as experiences concerning the optimization potential are exchanged as part of the best practice workshops. The participants take this basis to evaluate the options and decide which actions will be the most suitable ones for their firm. If the chosen measures are successfully implemented, an increase in quality and cost savings will derive for the participants at the end of the benchmark process.
All companies participating in the benchmarking have specific experiences which can be interesting and useful for other participants. Each participant regularly shares his own experiences with the group in Best Practice Workshops. There is no “Best Performer”, who can no longer learn anything.
2 The Methodology
Important guidelines for carrying out the benchmarking were decided with the collectively refined methodic concept. Among these are:
- An efficient data entry using a special tool which eases the work of the employee responsible for the data acquisition. An entry tool which is intelligent, automatically indicates possible errors and gaps and enables a comparison with the data from the previous year.
- To ensure a high quality of data, all acquired primary data is subject not only to a plausibility check but also to additional special checks before being entered into the data pool.
- The Benchmark Coordinator provides each participant with the usual comparison overview and additionally an interactive evaluation tool with which the key data can be modeled and independent numerical and graphical evaluations can be carried out without compromising the anonymity of the data.
To meet these requirements and to comply with the competition law, the independent Benchmarking Coordinator, „Bauakademie Gesellschaft für Forschung, Entwicklung und Bildung mbH“, took over the tool development, the data management and the moderation of the Best Practice Workshops. The development of the tool includes the IT-technical creation and adjustments of the excel-based data collection and outcome reports according to the requirements, as well as the programming and maintenance of the benchmarking database.
Figure 2 entails the flow of information during the benchmarking process. The affected buildings and the associated performances of the respective facility management as well as the subsequently arising costs can be identified with the help of the data management tools. The relevant information on the buildings are static data, which represent important reference values for establishing key indicators as well as for clustering the buildings.
3 The Data
There are 284 laboratory and office buildings with a total of approximately 2.604 Mio. m²of gross floor space in the data pool of the IFMA Benchmarking Research Group Chemistry, Pharma and Life Science. The buildings have a structural value of 5.372 bn EUR and provide a working place for 50,837 employees. This forms a solid basis for informative benchmarks. Even more important than the scope of the data pool in a benchmarking is the quality of the data contained in it. The comparability of the results requires a high level of homogeneity in the primary data. This is particularly relevant for the services related to the cost and consumption figures. As expected, satisfactory data homogeneity could only be achieved in the course of time in spite of comprehensive coordination and supporting measures. This can be recognized in the range between the minimum and maximum values of the acquired key data. The size of this difference can be used as an indicator for the quality of the data acquisition and of the total benchmarking.
Since the different types of laboratories differ greatly in their technical equipment and the intensity of use, a total of nine different laboratory types are considered. The largest portion with approximately two thirds of the laboratory space is occupied by chemical, application engineering and analytical laboratories. The data, however, also showed tendencies that are independent of the type of use. These tendencies include for example connections between the technical costs, the age of the building and the cycle of complex maintenance. The results confirm in an impressive way the meaning of life cycle considerations in Facility Management.
4 Selection of key figures
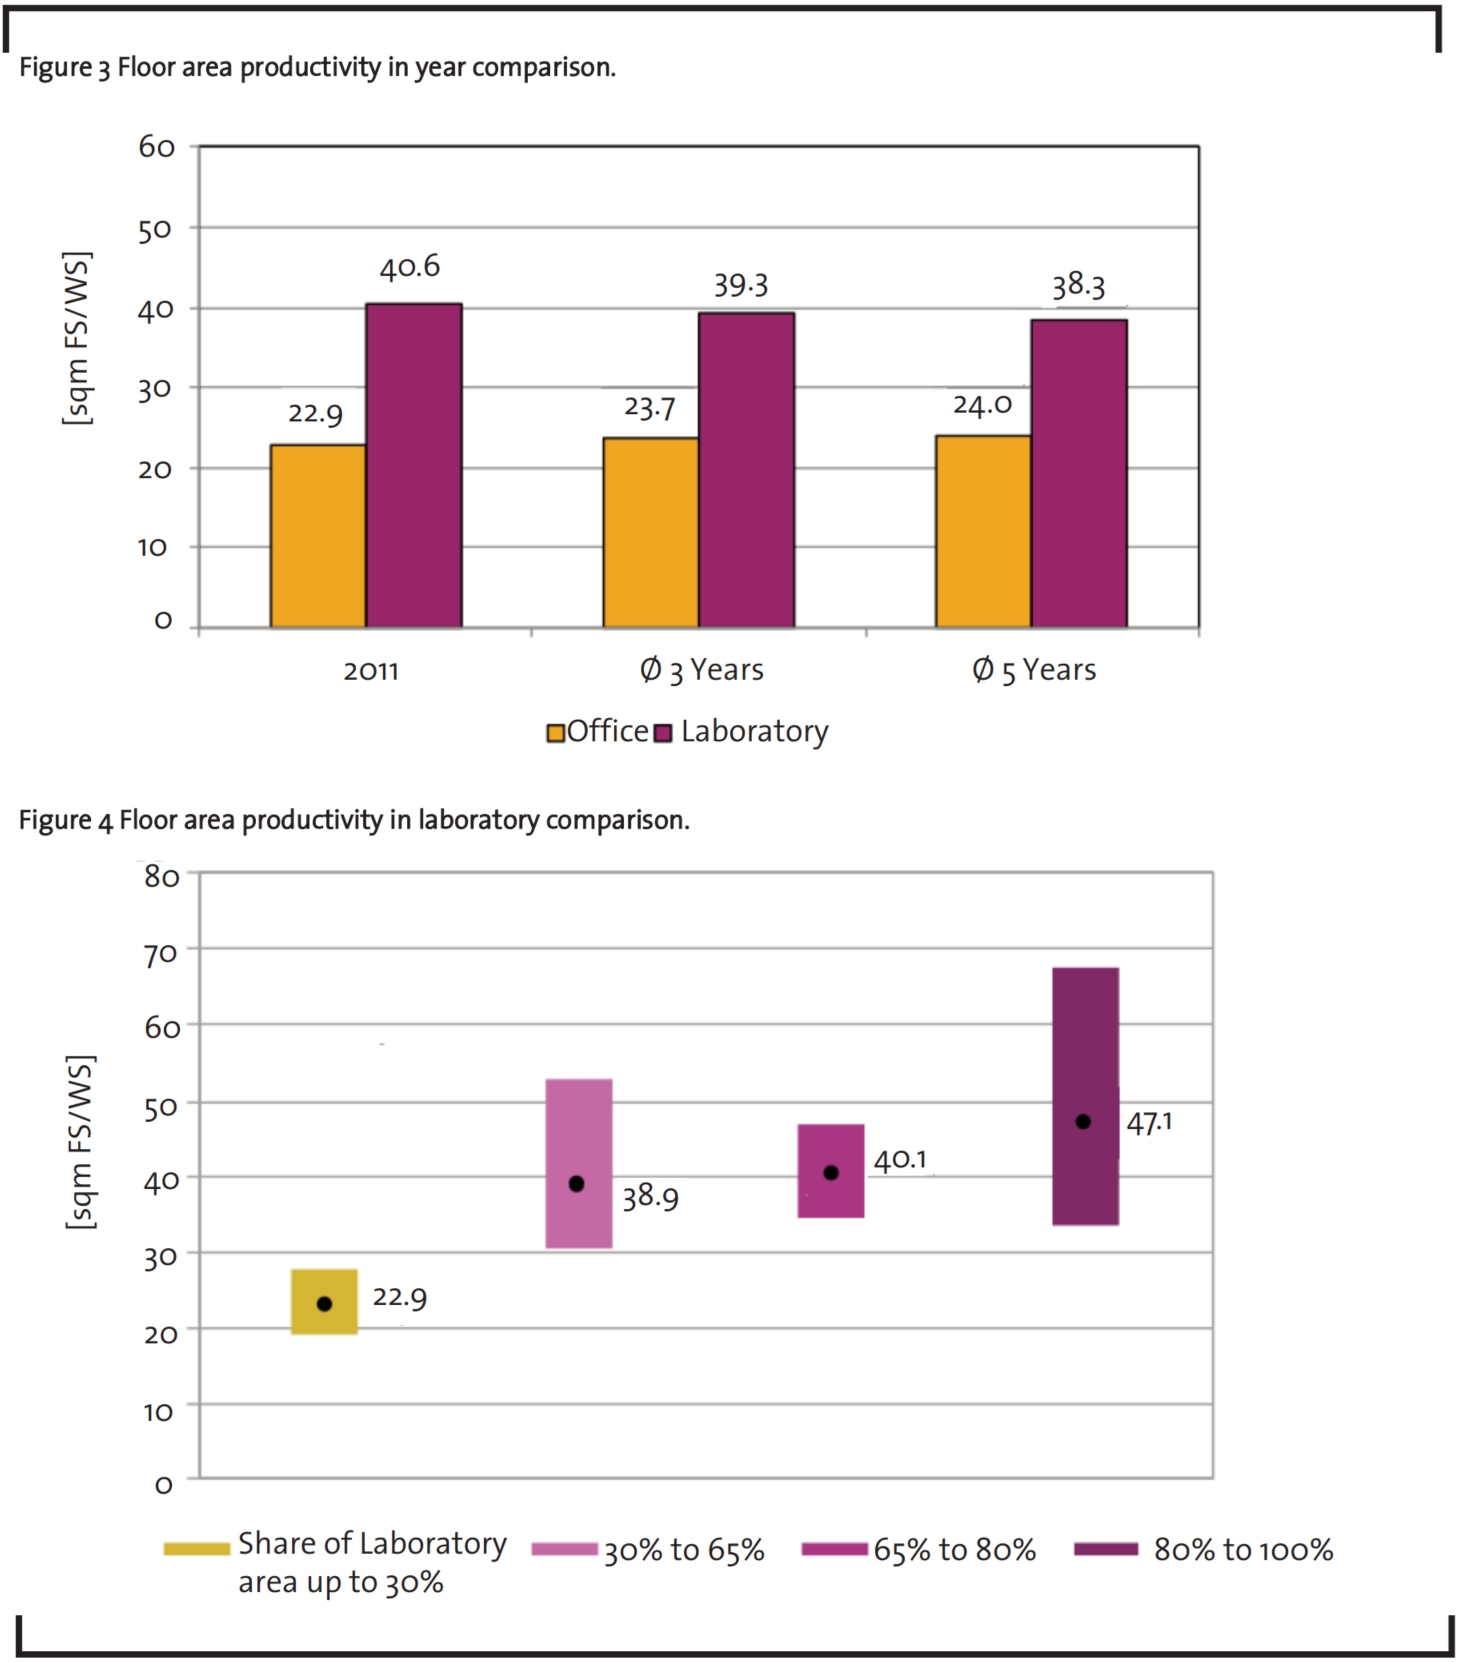
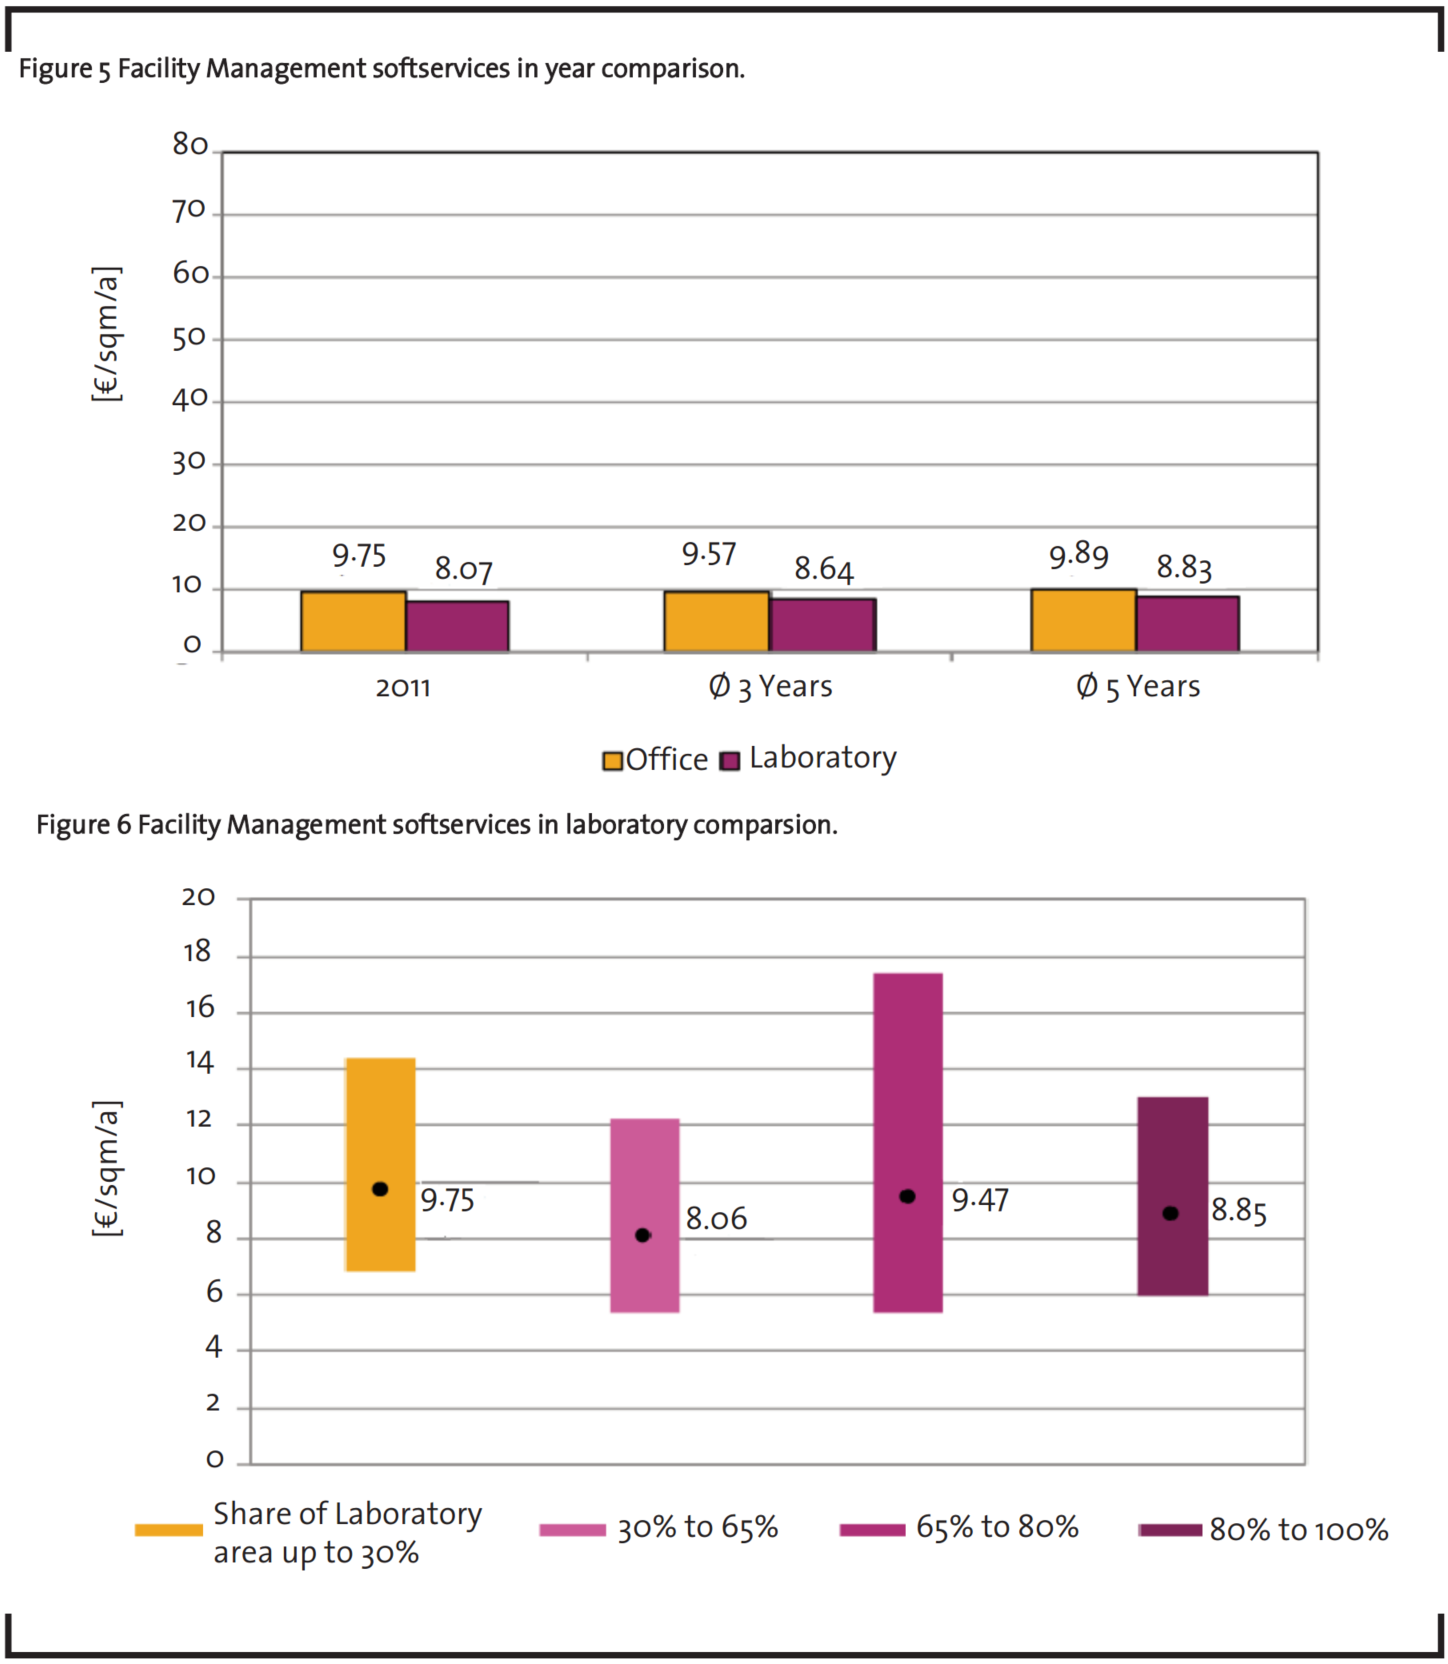
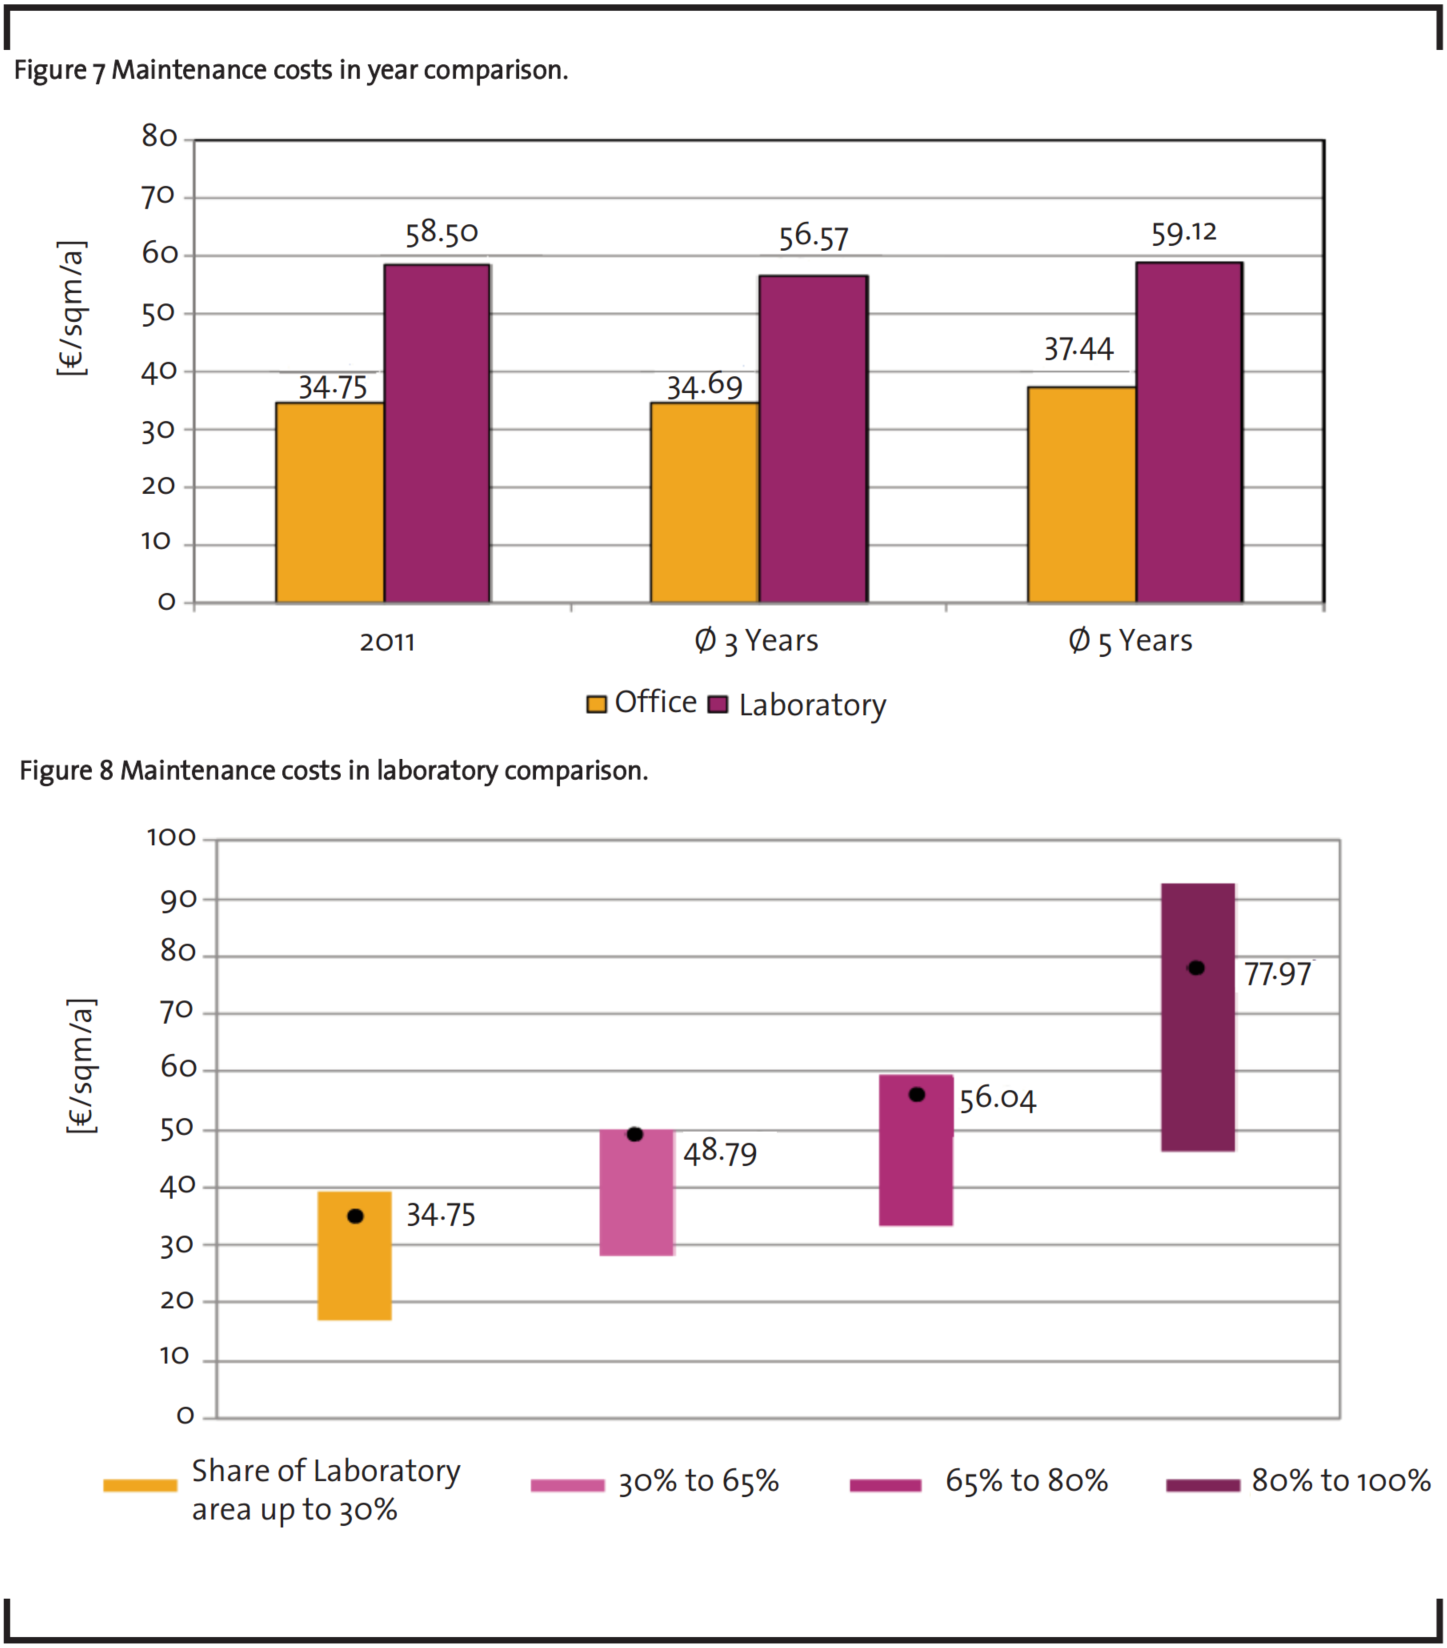
In the following, the key figures of the last bench marking in 2012 are compared to the mean values of the last three and five years (figure 3, 5, 7 and 9). Next to the comparison over several years, a detailed illustration of the respective key figures (figure 4, 6, 8 and 10), which differentiates the current value of 2012 according to the share of the laboratory area, is shown in the diagram below. Furthermore, the average variation to each mean of a laboratory part is illustrated (area between the 0.25-and 0.75-quantile). Unless otherwise stated, the net floor area (NFA) represents the reference value for all area-specific key figures.
4.1 Productivity per area unit
In accordance with the German standard DIN 277, the average floor space (FS) (“Nutzfläche”) required for each workstation (WS) accounts for about 23 sqm in office buildings and for about 41 sqm floor space in laboratories (see figure 3 and 4). Besides the office or the laboratory floor area, the useful area additionally includes sanitary spaces, meeting and recreation rooms.
4.2 Infrastructural facility management
The costs of the infrastructural facility management comprise of the costs for services like gardening, housekeeping, facility cleaning and winter services. These costs have to lowest portion of the overall operating expenses. In the case of cleaning laboratory buildings, the significant share of the costs that is borne by the labor user has to be considered, as it is generally not recorded and thus not included in the key figure.
4.3 Life cycle-oriented maintenance
The costs of the maintenance account for the second highest share of the overall expenditures and cover planned and corrective maintenance, only the expenses for user-specific laboratory equipment are excluded (see figure 7 and 8). The life cycleoriented maintenance is a regularly topic in Best Practice Workshops whereby the search is focused on the “optimal“ maintenance strategy. The group is currently working on a study including empirical values for maintenance and inspection intervals of ventilation systems in laboratory buildings.
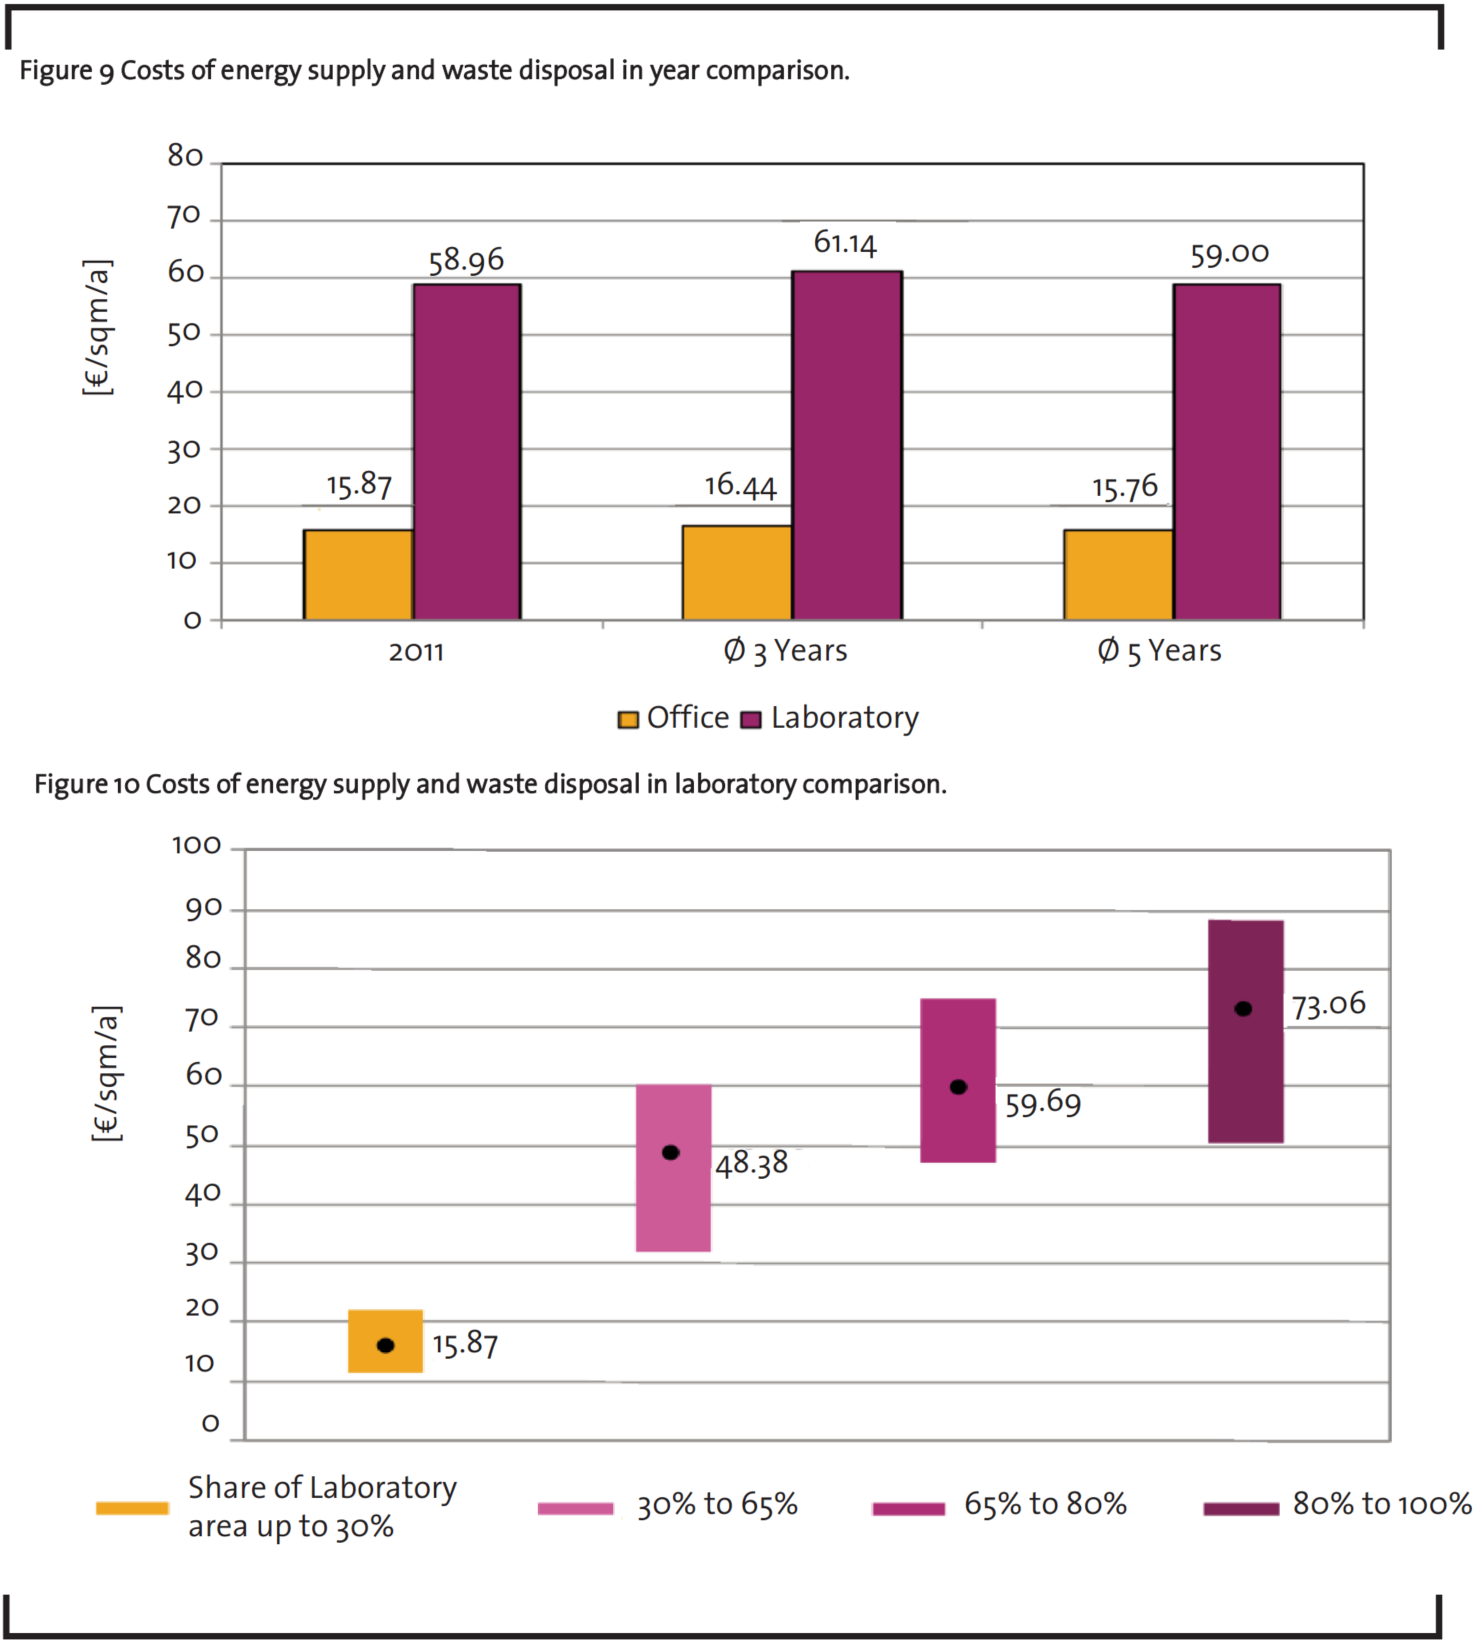
4.4 Energy supply and waste disposal
The costs of supply and disposal, depicted in figure 9 and 10, represent the largest share of the operating expenses. They include the costs of supply for power, heat, cooling, drinking water, desalinated water, process water, nitrogen and compressed air as well as municipal waste and waste water management.
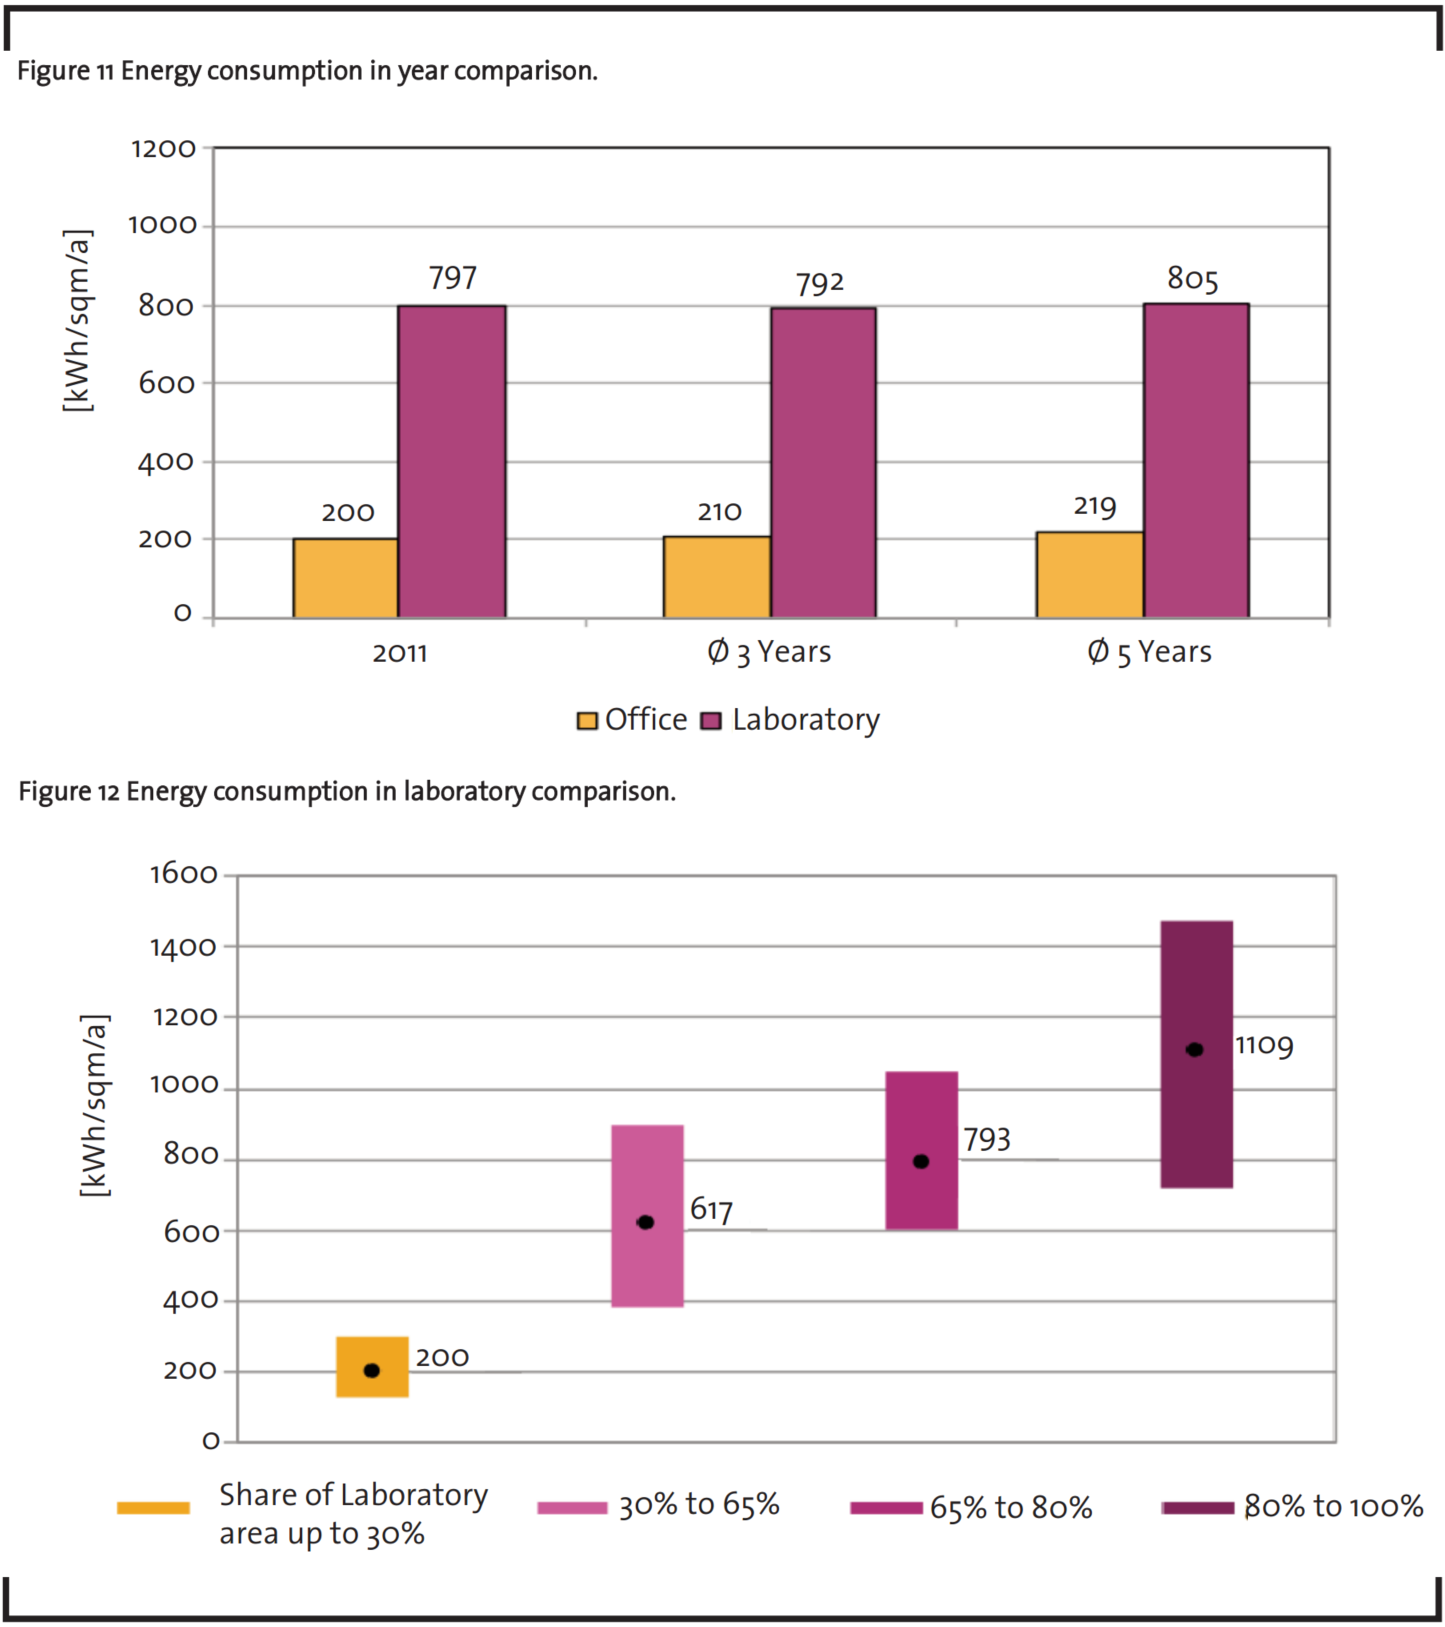
The energy costs which are caused by the energy consumption for electricity, heat and cooling are illustrated in the figure 11 and 12.
5 The Good Operating Practices (GoP)
The emphasis within IFMA Benchmarking refers to Best Practice Workshops. These are designed to enable the discussion between the participants on experiences and optimization concepts for facility management. The structured exchange of knowledge leads to continuous inspiration for potential improvements. The approaches enjoying a broad consensus, the so-called Good operating Practices (GOPs), are adapted to be universally applicable. These templates serve as guidelines for the development of company-specific solutions for the participants. A selection of GOPs is published.
5.1 GoP “Energy efficiency“
A special interest for the representatives of the participating companies is the monitoring and improvement of the energy efficiency of laboratory buildings. The group has been involved with the acquisition of reference key figures for the energy consumption in laboratory buildings since 2007. This work can be traced back to an enquiry of the german federal office for building and construction (“Bundesamt fü r Bauwesen und Raumordnung”) to collect data about energy consumption for the purpose of updating a german law to reduce the energy consumption of buildings in Germany (“Energieeinsparverordnung / EnEV”).
Since it is well known that laboratory buildings have a high energy consumption based on their usage, the creating of specific energy benchmarks is of great interest to the operators of these buildings. For this reason the research group investigated the factors which influence the energy consumption of laboratory buildings in a comprehensive empirical study.
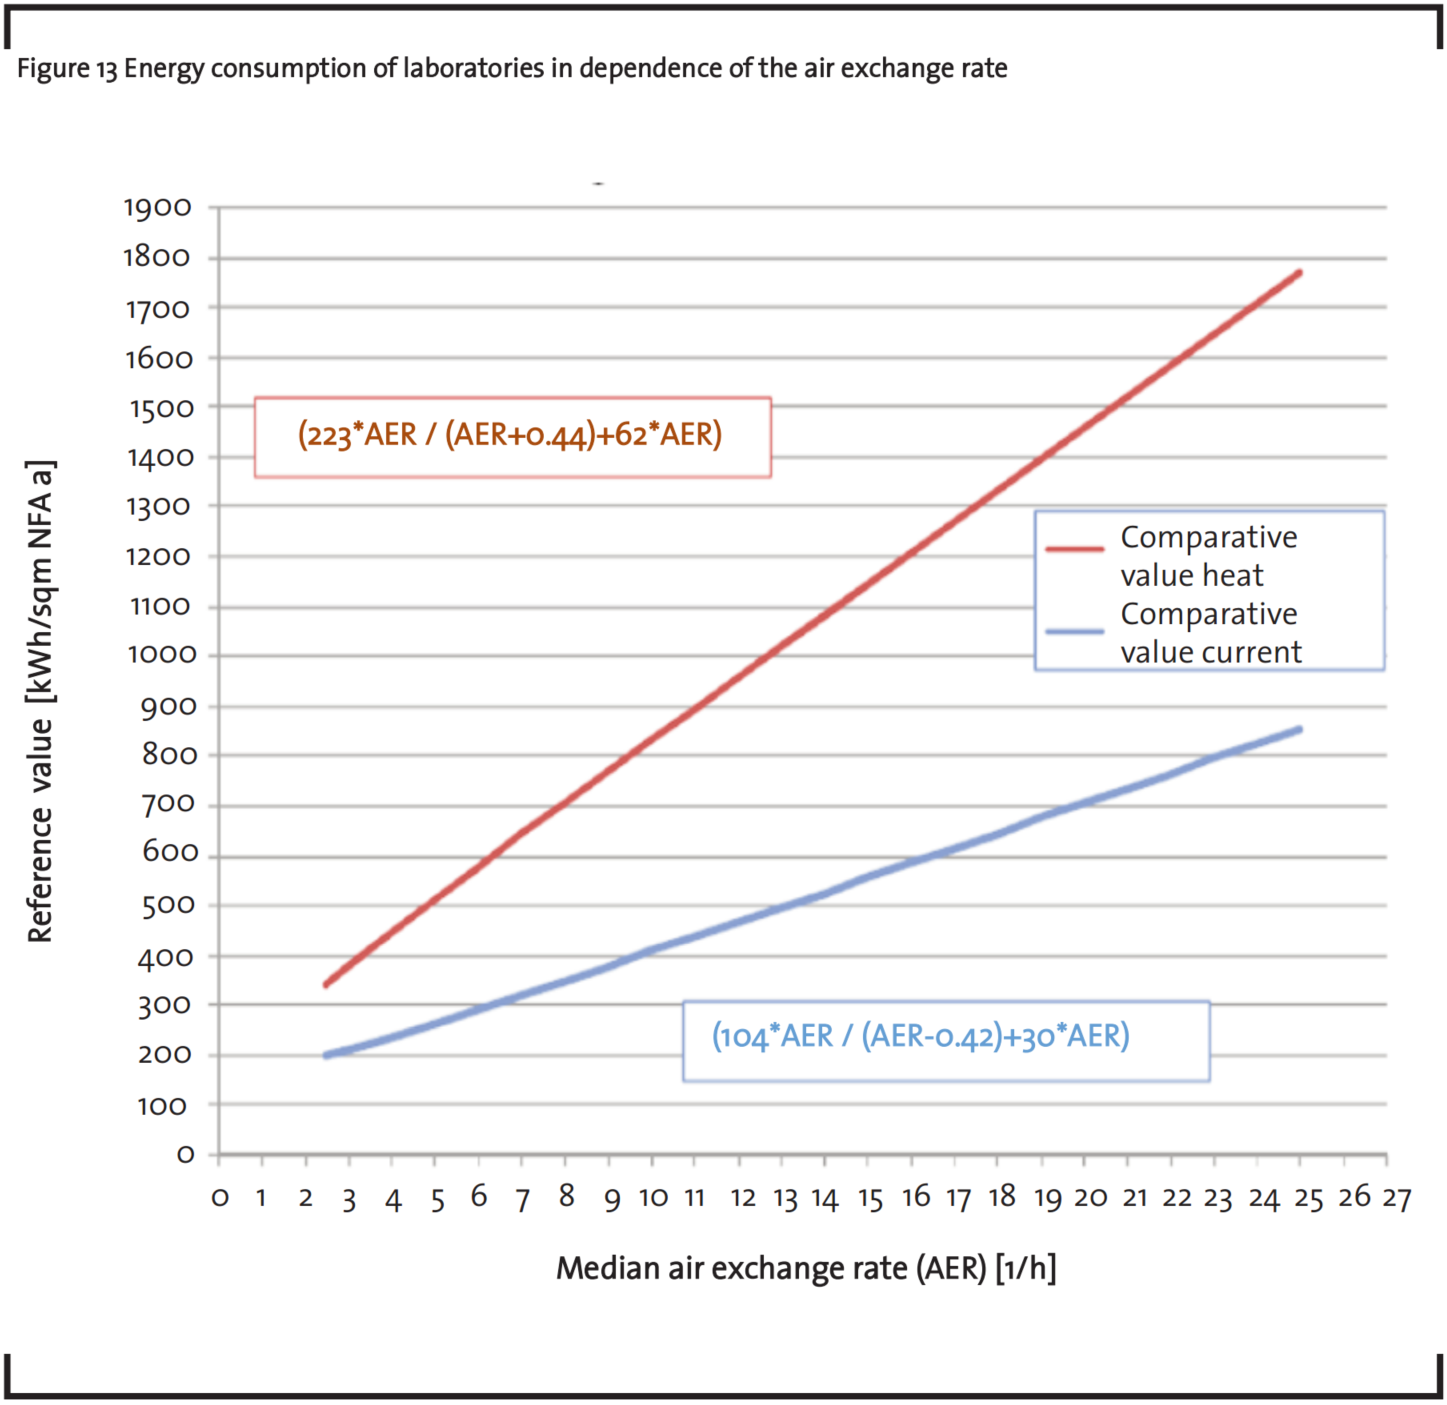
A significant result of the study is that the energetic consumption of the laboratory buildings does not depend on the categorizing into various laboratory types (chemical, microbiological, analytic, etc.). It could be empirically proven that the median air exchange rate (AER) (distributed over the entire building) is the most influential factor related to energy consumption. Figure 13 entails the ascertained connection between the air renewal rate and the energy consumption.
This finding was then implemented in the german law to reduce the energy consumption of buildings in Germany (“Energieeinsparverordnung / EnEV”) It is notable that the reference key figures of the energy consumption in the EnEV are indicated in the EnEV only as concrete numerical numbers in kWh/sqm. If, however, the air exchange rate of a laboratory building as a building specific parameter should be used in the determining of a reference key figure, then it must be separately calculated for each building. To make this possible, the study results were summarized in terms which allow the user to calculate the building specific reference key figure for heating and electricity under consideration of the building specific air exchange rate. These terms are a result of the empirical study of the IFMA Benchmarking Research Group and were taken over as reference key figures into a special category for laboratory buildings („Labore privater Einrichtungen“) in the german law to reduce the energy consumption of buildings in Germany (“Energieeinsparverordnung / EnEV”) from 30.07.2009. With this, a change of philosophy in the EnEV was executed, since for the first time no concrete numerical number is given as a reference value, but a term which provides a result based on the specific circumstances of the energy consumption of a building.
5.2 “Legal Responsibility for Operators“
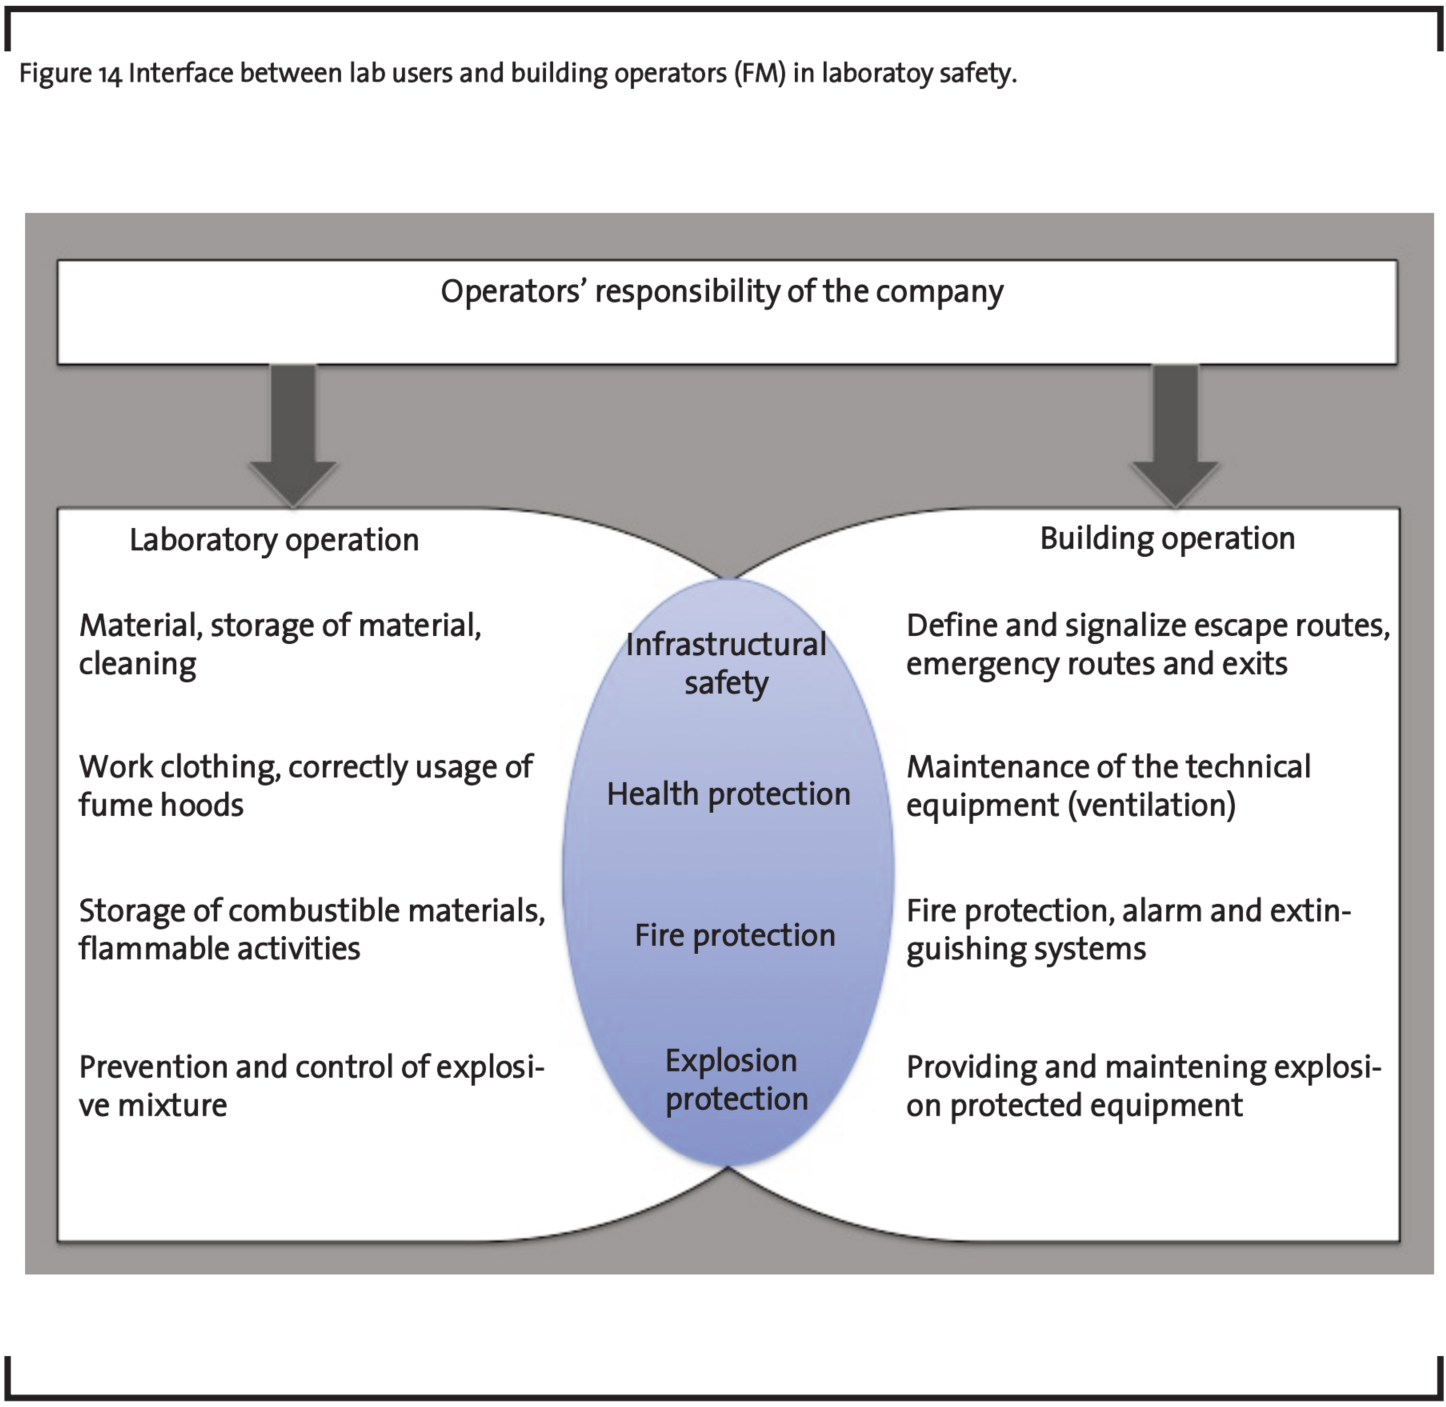
A further theme of great interest for the participants in the benchmarking is the management of legal obligations and duties. Legal Responsibility for Operators means the fulfilling of legally required protective measures, in particular those which are related to the safety of persons, the protection of third party rights and the protection of the environment. The operation of laboratory buildings involves special requirements related to laboratory safety due to the high danger potential (illustrated in figure 14).
Each company which participates in the benchmarking has special experience and solution approaches for individual obligations. In the Best Practice Workshops, these solution approaches were put together like a puzzle and optimized into a comprehensive concept developed by the Bauakademie. The results of this process worthy of generalizing were documented in the form of principles for the administering of operator responsibility. Hence the operating company is basically responsible for the operation of laboratory buildings. The area building operation usually encompasses the responsibility for the provision of a safe and danger free basic building structure including the general technical equipment of the building. Those in charge of the operation of the laboratory, on behalf of the laboratory manager, are responsible for the safety in their lab. The developed principles provide behavior guidelines and checklists for the management of the interfaces between the concerned company departments.
Figure 14 illustrates the interface between the laboratory attendants/user and the facility management department (FM) regarding infrastructural safety, health protection, fire protection and explosion protection.
The German versions of both GoP’s are available on request (mail to ifmabenchmarking@bauakademie.de). To gain further validation of the suggested concept, more studies are required. By acquiring additional participants from the chemical, pharmaceutical and life science industry, new insights and recommendations for facility management can be deduced.