Development of integrated production networks using extended material flow analysis
Abstract
Integrated production networks can be very efficient in using raw materials and energies resulting in optimized cost structures. In particular in the chemical industry integrated production networks gain competitive advantage. However, the complexity of large networks makes it difficult to predict and navigate through volatile markets and to define development strategies to meet future market demands. But, by using extended material flow analysis effects of changes in production networks can be predicted. Starting with material flow analysis and extending with cost and investment analyses while using scenario techniques, an optimized configuration of the network can be identified. Therefore, extended material flow analysis supports the strategic development of the integrated production network.
1 Introduction
A recent VCI-Prognos-study funded by the “Verband der Chemischen Industrie e.V.”, a German association of the chemical industry, describes the future of the chemical industry until the year 2030 (VCI-Prognos-Study, 2012). The forecast shows a growing chemical market in which industrial countries can only compete due to their highly integrated and efficient production networks, called “Verbund”. While the German chemical industry reduced energy consumption by one fifth compared to 1990, the production volume increased nearly 60% in the same period due to process optimization and effects of integrated production networks. According to the study, increasing costs of raw material and energy will force the German chemical industry to further increase their resource efficiency in order to continue to be competitive on the future global market. It is expected that the German chemical industry will increase its energy consumption by only 8 % while the production value will increase by 40%. This efficiency increase is also due to a change in the product mix: While the volume of high-end chemicals will increase, resource intense products will grow slower than the overall market. But, how to adapt the production network to meet future demands? This article gives a short overview of extended material flow analysis and demonstrates in a simplified case study its application to define proper mid to long-term development strategies for integrated production networks.
2 Integrated production networks
An integrated production network contains a web of production plants cross-linked by material and energy flows (Brudermueller, 2001, Brudermueller and Langguth, 2001, Viere, 2009). The usage of co-products of single plants as raw material for other plants or as a recycle flow to upstream production units can lead to high resource productivity and it reduces the amount of waste and emissions. Also, energy flows between the production units at different enthalpy levels reduce the overall energy consumption of the network leading to high energy efficiency. Organized in an optimized manner, integrated production networks are cost effective and, therefore, deliver competitive advantages. However, the complexity of large networks makes it difficult to predict and navigate through volatile markets and to define development strategies to meet future market demands.
There is a variety of literature (e.g., Grossmann, 2005, Proud, 2007, Duggan, 2012) about the operational planning of production units focusing on short and mid-term horizon to optimize man power and machine uptime, reducing change over time, maximizing productivity and minimizing logistic traffics. Typically tools and algorithms are used for production scheduling considering production on a high detail level but in a relatively small network subarea, e.g., one production line or one chemical plant.
Tactical and strategical planning have a wider projection horizon and, in contrast to operational planning, they have to deal with more options and uncertainties. The plans are based on estimated market demands on different planning horizon of 2, 5, 10, or even more years. They should ensure to follow the business strategy by developing the production network accordingly. In order to sustain future profitability and efficiency in the network the following questions come up frequently:
- Does the existing integrated production network serve future market demands and price structures? If not, what bottlenecks must be opened, how should the network be adapted?
- How can the productivity of the overall network be increased?
- Is the production network able to follow the strategy and vision of the company?
Extended material flow analysis contributes to answering these questions. Its professional deployment supports the development of an efficient, economic, and ecological production network. During the analysis phase it
- gives a task-oriented and transparent view of complex material and energy flows and cost structures,
- detects constraints and bottlenecks,
- reveals dependancies, correlations, and inherent product mixes,
- identifies profitable operating corridors of the existing network,
- evaluates the product portfolio, and
- defines meaningful key figures. In further investigations using scenario technique extended material flow analysis depicts improvements with clear targets and possible solutions
- to debottleneck and optimize production capabilities,
- to adapt the product portfolio corresponding
- to future demands,
- to increase productivity and resource efficiency, e.g., by cycle flows of intermediates, fully utilized coupled products, waste minimization, optimal energy utilization,
- to meet safety and environmental requirements, e.g., minimize inter-site transportation of hazardous materials, combined exhaust, sewage and waste treatment,
- to support business risk assessments, e.g., shutdown of plants, limited raw material availability, big drop in prices or demands (Alberti, 2001).
Overall, extended material flow analysis prepares and supports strategic decisions in order to develop further the production network of a company. In most cases the investigation results in clear project definitions with task, target, and potential benefit. In combination with estimated investment costs and expected sales numbers the payback, return on investment (ROI) and internal rate of return (IRR) can be calculated.
3 Extended material flow analysis
This approach is based on material flow analysis described in Moeller et al., 1995, and Brunner et al., 2003. A converged material and energy network model provides the basis for the cost calculation. The subsequent analysis of the model leads to adjustments in the model. It is an iterative approach to optimize the network according to the target.
Several software applications are available on the market for material flow analysis including cost analysis. Brunner and Rechberger (Brunner et al., 2003) compared several tools with the similar example including GaBi (http://www.gabi-software.com) and Umberto (http://www.umberto.de/en/). Both tools were further developed since their comparison. Umberto was recently recommended by Gartner Inc. in their “Cool Vendors for Green IT and Sustainability 2012” report (Gartner Inc., 2012). For the analysis discussed in this article Umberto was used for material flow analysis and Sankey diagrams and Microsoft Excel for additional analyses, tables, and diagrams.
3.1 Modeling of the network & boundary conditions, initial flows
Models in material flow simulation contain transitions, arrows, and places. In transitions the transformation of material and energy flows are calculated. Places represent nodes in the model which may be just connections, stocks for material and energy, or boundary conditions at system borders (input and output). The arrows define possible connections between places and transitions. The flow direction and amount will be calculated by the algorithm. Depending on the investigation, the model size and its boundary conditions may represent a subarea of a production site only or the full production network with all different sites.
The level of detail of the model is related to the target of the investigation (Bode et al., 2011). If, e.g., the task is to analyze and optimize heat exchanger networks the details of all relevant operation units and their material and energy flows have to be modeled (e.g., reactors, vaporizers, distillation columns, condensers, dryers). In contrast, for analysis of inter-site transportation, the modeling on plant level is usually sufficient, i.e., modeling of major operation units or on plant level with main flows between the units or plants, respectively. It is strongly recommended not to overload models since a very high level of detail increases the complexity of the model significantly, that leading to convergence issues and incomprehensible results.
Typically, material flow simulation uses the approach of a Petri net to calculate the network. That is a sequential algorithm in which every transition calculates separately all possible equations depending on new inward or outward directed flows. To start the simulation initial flows have to be defined. The initial flows may represent a market pull or a push from the raw material side at the boundary of the system or defined flows within the network. Also a combination of several flows can start the calculation. In complex networks, several initial flows have to be defined in order to get the full model calculated. The algorithm starts at the transitions where the initial flows are queued. If all transitions of the network are calculated or do not change in a following run the simulation ends.
After successful calculation of the material and energy network a post algorithm starts the cost calculation with additional cost information, e.g., fix and variable costs, energy costs, allocation rules. In production networks of the chemical industry there are usually several units with by-products, i.e., more than one product is produced simultaneously in these units. The allocation of the joint costs to all products of this unit may have huge impact on the economic efficiency of final products and, therefore, must be modeled correctly (Langguth and Brudermueller, 2001, Fandel et al., 2009). As a good example, Bode et al. describe the influence of allocation rules on the economic evaluation of different process options (Bode et al., 2011).
3.2 Analysis
Typically the analysis of the model will be carried out using several methods in combination depending on the type of investigation. Methods employed commonly include the following:
Balance sheetsto list flows across a defined system boundary. The system can be the overall network, subareas of the network, or single units (Moeller and Rolf, 1995). Multiple variants are possible, e.g., material or energy flows and their assigned values, grouped by material, listed by arrows, etc..
Pareto, ABC, or portfolio analysis(Daenzer et at., 1994, Lunau et al., 2008) to cluster raw material, intermediate, and product flows and to evaluate the portfolio.
Flow and cost analysis via Sankey diagramsto visualize product or product group flows and their cost structures and to detect constraints, dependancies, and bottlenecks (Schmidt, 2008a&b).
3.3 Optimization
After detailed analysis of the current model, the next step is to optimize or further investigate the network according to the task. Here, scenario technique is often used in material flow analysis to modify the network and benchmark the results or to identify cause-and-effect chains. The modifications in the network vary from adjusted initial flows to structural changes by new flows, new production units, or new technology with different selectivity modeled in transitions. For risk assessments, drastic changes should be modeled, e.g., shut down of internal power plants or important operation units, shortage of raw material. After the modifications, the new scenario has to be recalculated and analyzed.
By comparing different scenarios, sensitivity and regression analysis may help to detect root causes for constraints and dependancies. Benchmarks of the scenarios are used to evaluate the different modifications revealing favorable network configurations or most economic modes of operation. Once identified, the way from the existing network to the desired configuration can also be defined by using extended material flow analysis.
A very positive side effect of using extended material flow analysis for development of integrated production networks is the identification of clear tasks and targets for following projects which are defined by the results of the analysis. With these front-end loads the project teams have a clear picture of what has to be implemented.
4 Case study Mueller-Rochow Direct Synthesis of methylchlorosilanes
The following case study is a brief and simplified example to demonstrate how extended material flow analysis can support strategic decisions in the chemical industry with the aim to adapt the integrated production network to future market demands. According to data confidentiality, the case is based on process descriptions published in “Silicones & Industry: A compendium for practical use, instruction and reference” by Andreas Tomanek (Tomanek, 1992).
The Mueller-Rochow Direct Synthesis is a copper-catalyzed reaction of chloromethane with silicon in a fluidized bed reactor. Almost all methylchlorosilanes are produced by this direct synthesis. Methylchlorosilanes are the raw materials for silicone polymers and oils, resins and organofunctional silanes (Tomanek, 1992).
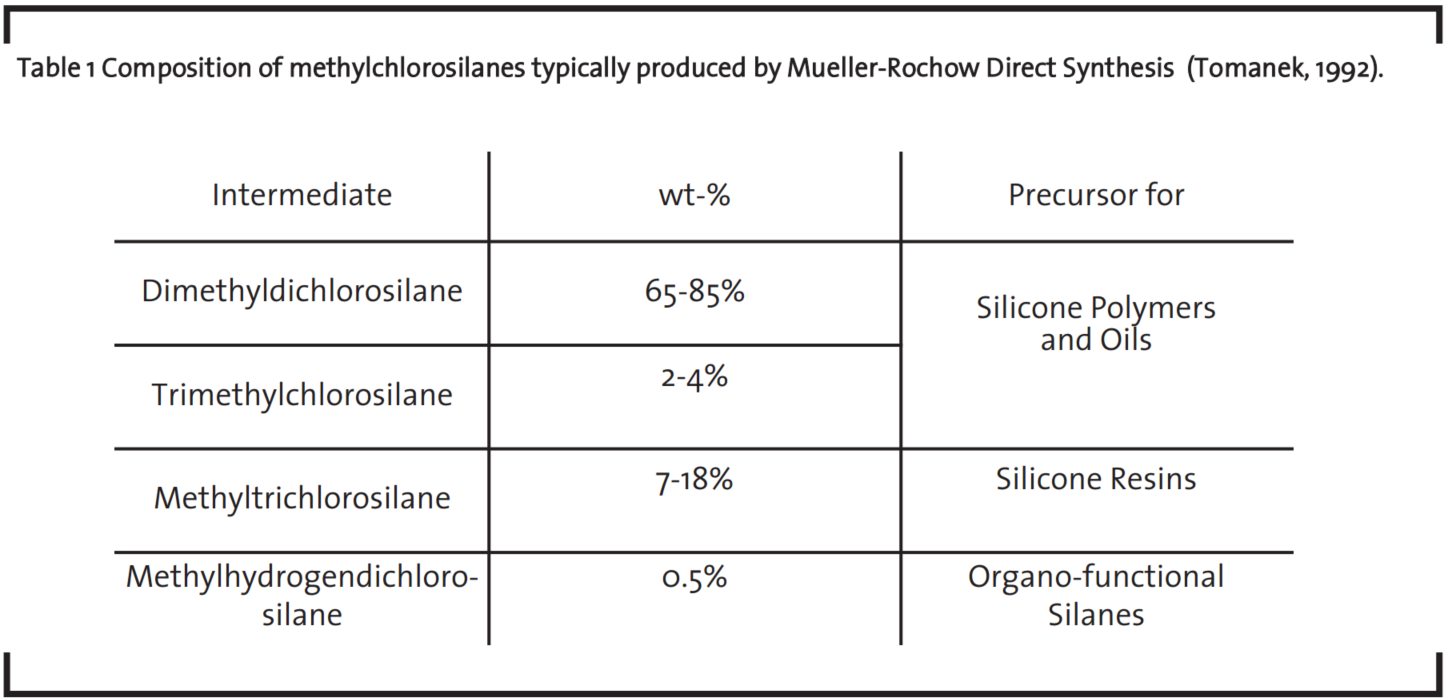
Modern fluidized bed reactors have approximately 40,000t annual capacity of raw silane, a mixture of different methylchlorosilanes. The usual composition according to Tomanek (Tomanek, 1992) is shown in Table 1.
4.1 Base scenario: 85% of reactor capacity
Usually these large scale fluidized bed reactors are implemented in highly integrated production networks with voluminous cycle streams of intermediates. In figure 1, a simplified production network is shown. The transitions are shown as rectangles with an identifier starting with the letter “T”, e.g., the transition T1 is the Mueller-Rochow Direct Synthesis. The places are shown as circles where green circles with a secant on the left side are input places while red circles with secants on the right are output places. Input places represent the system boundary upstream, where materials enter the system. Output places represent the outlet of the system. In this model, the output places P3, P8 and P9 represent further downstream production lines not discussed in this case. For all internal places in this simplified model, stocks are not allowed. The arrows are shown in different colors and line width. The color defines the material or material group and the width is proportional to the flow quantity. This type of flow diagram is known as Sankey diagram (Schmidt, 2008a&b). The numbers close to the arrows are the calculated mass flows in tons. All numbers discussed are rounded numbers.
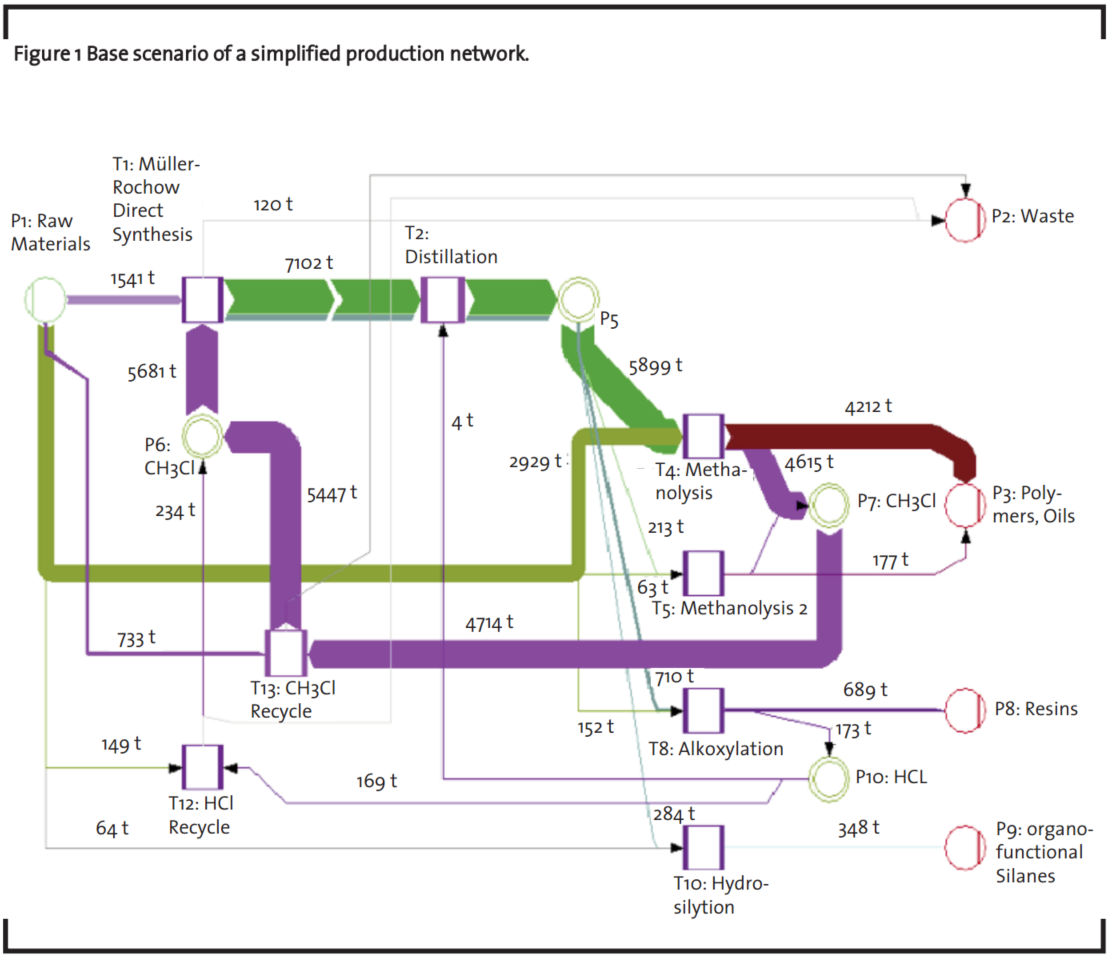
In this scenario, 1,541t of raw silicon are reacting in the Mueller-Rochow Direct Synthesis (transition T1) with 5,681t of chloromethane (blue cycle stream) to a mixture of raw silanes (green arrow, 7,102t). This should represent 85% of total reactor capacity of a certain period. 120t of waste out of the Mueller-Rochow Direct Synthesis leave the model through the output place P2. In the distillation T2, the raw silane mixture will be separated and highboiling methylchlorosilanes (approximately 2% of the mixture) will be mostly recycled with the aid of HCl and an amine catalyst to dimethyldichlorosilane. The separated products are listed in Table 2.
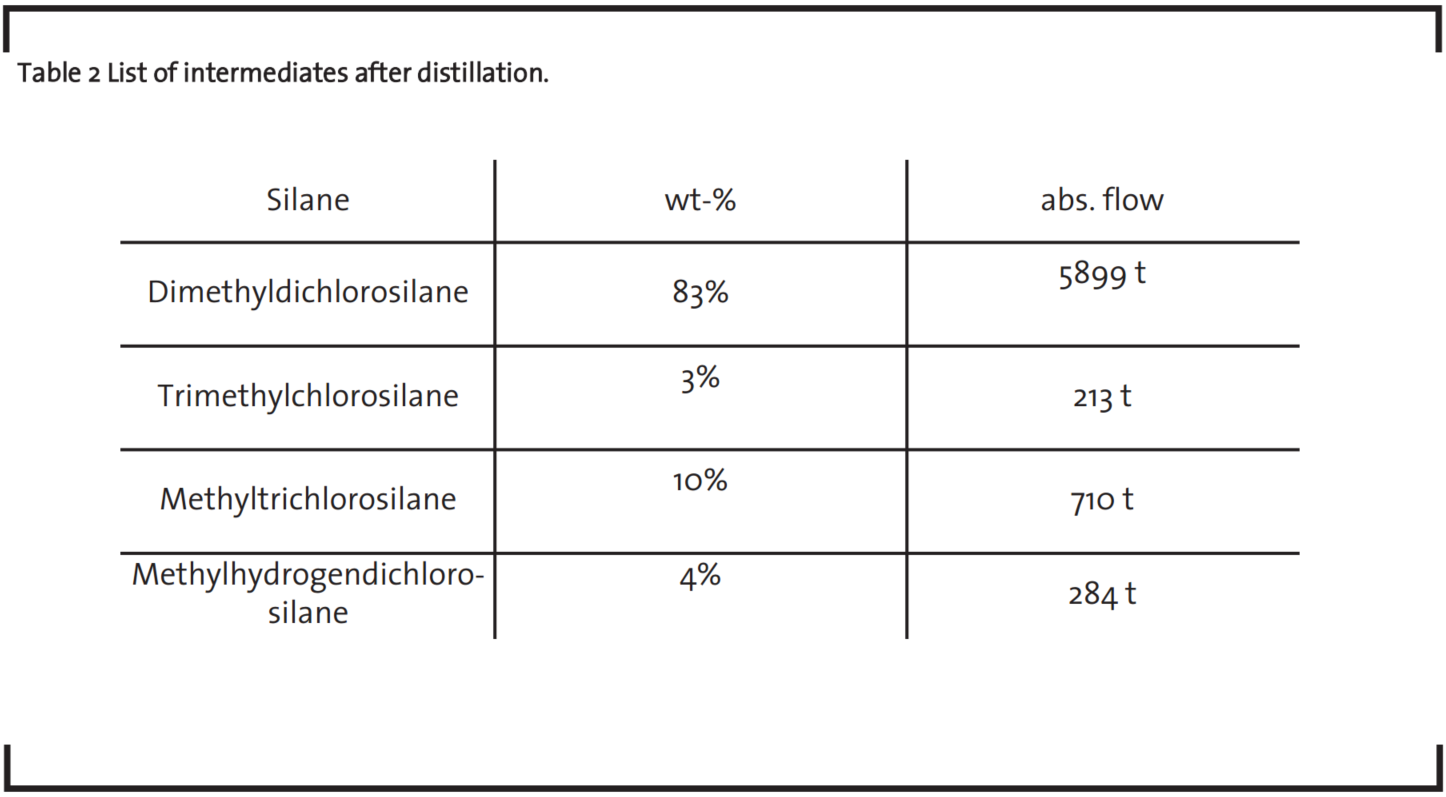
From the place P5, the outlet of the distillation, the different silanes are distributed to several downstream transitions:
In the Methanolysis 1 and 2 (transitions T4 and T5) dimethyldichlorosilane and trimethylchlorosilane react with methanol forming dimethylsilandiol and trimethylsilanol, respectively, precursors for polycondensation to silicone polymers and oils. The by-product chloromethane can be recycled as reactant for the Mueller-Rochow Direct Synthesis. This very important recycle stream is represented by the blue arrow from P7 over T13 to P6 and finally to T1.
Methyltrichlorosilane out of the distillation reacts with methanol to methyldichloromethoxysilane and HCl in the Alkoxylation (T8). Methyldichloromethoxysilane is a precursor for resins. HCl can be recycled in T12 with methanol to form chloromethane for the Mueller-Rochow Direct Synthesis and as reactant to convert high-boiling methylchlorosilanes to dimethyldichlorosilane in the distillation as described above.
In the Hydrosilylation (T10) methylhydrogendichlorosilane reacts with acetylene to form vinylmethyldichlorosilane as example of numerous possible hydrosilylations to generate precursors for different organo-functional silanes.
A balance sheet over the whole network of this scenario shows that 1,541t of silicon are needed to produce 4,212t of dimethylsilandiol, 177t of trimethylsilanol, 689t of methyldichloromethoxysilane and 348t of vinylmethyldichlorosilane. Only 733t of chloromethane are from external resources while 5,681t are used in the same period in the MuellerRochow Direct Synthesis. About 4,615t or 81% of the required chloromethane are a by-product of Methanolysis 1 in this scenario.
In the current scenario the network produces an inherent product mix in which the output of all intermediates is fixed to a certain ratio defined by the selectivity of the Mueller-Rochow Direct Synthesis and its throughput. The market prices of raw materials and energies and the costs allocations in the Mueller-Rochow Direct Synthesis and the distillation define the internal prices of the various intermediates and finally the price of the end products of all products downstream.
4.2 Target: Adapt production network to changed market demands
In this case study, a market survey reveals higher demand on organo-functional silanes while the rest of the market remains stable. This leads to a higher demand on methylhydrogendichlorosilane as a precursor for different organo-functional silanes.
In the following sections, several scenarios will be investigated using extended material flow analysis to find the best adaption of the integrated production network in order to meet the future market demands. In a first step, several assumptions are made to simplify the study:
- enough raw materials and utilities are available
- no bottlenecks in production units, cycle streams, and downstream processes
- sufficient separating efficiency of distillations and other separation units
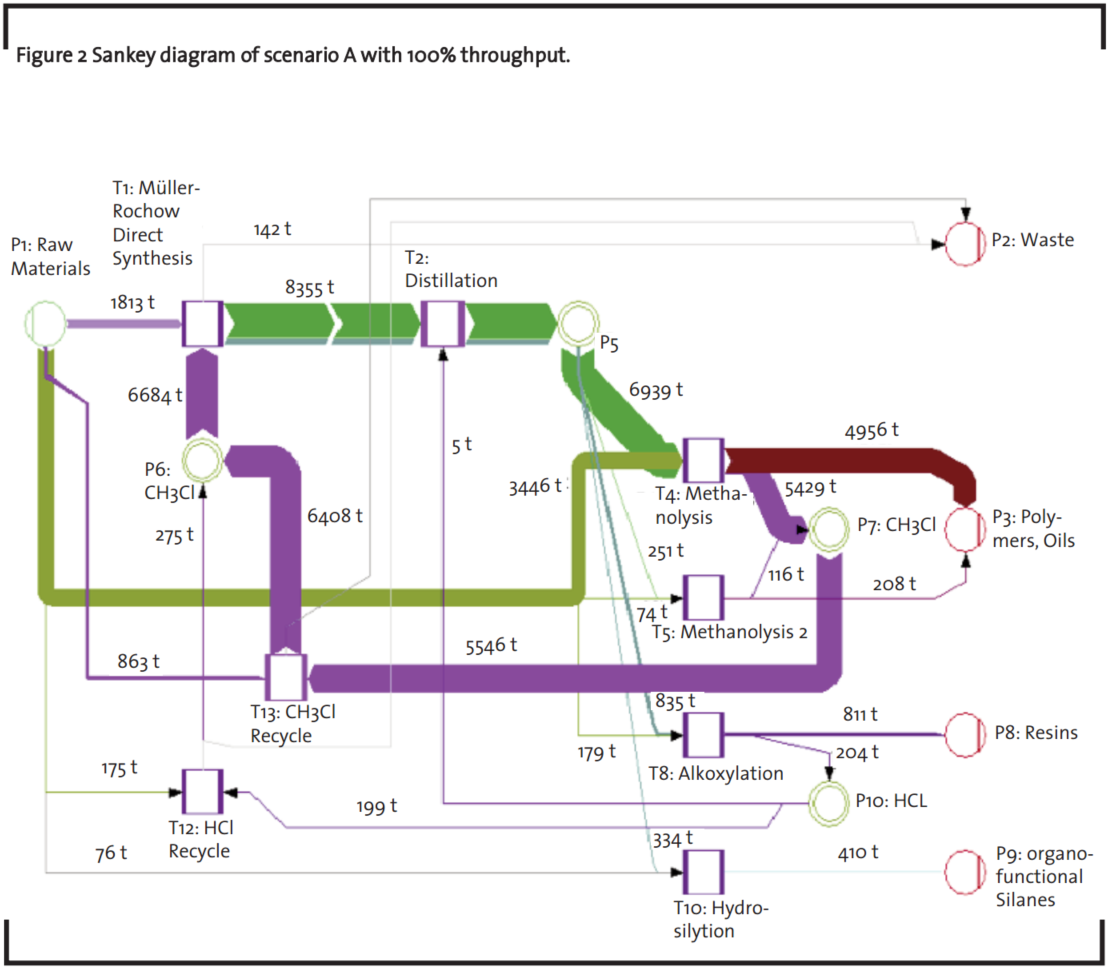
4.3 Scenario A: Full reactor capacity
The overall throughput of the Mueller-Rochow Direct Synthesis will be increased from 85% to 100% (1.2 times) in this scenario A. In figure 2, the Sankey diagram of this scenario is shown. As expected, all flows are increased by 1.2 times. A balance sheet of this scenario will show input flows of 1,813t of raw silicon, 3,874t of methanol and 863t of chloromethane to produce 4,956t of dimethylsilandiol, 208t of trimethylsilanol, 811t of methyldichloromethoxysilane and 410t of vinylmethyldichlorosilane.
A comparison with the base scenario discloses that an increase of only 62t precursors of organofunctional silanes is attended by a 744t increase of dimethylsilandiol, 31t increase of trimethylsilanol and 122t more methyldichloromethoxysilane. Since the market situation will not change for silicone polymers, oils, and resins these are undesired overcapacities possibly leading to price drops and lower contribution margin on these final products.
4.4 Scenario B: Full reactor capacity and adapted selectivity
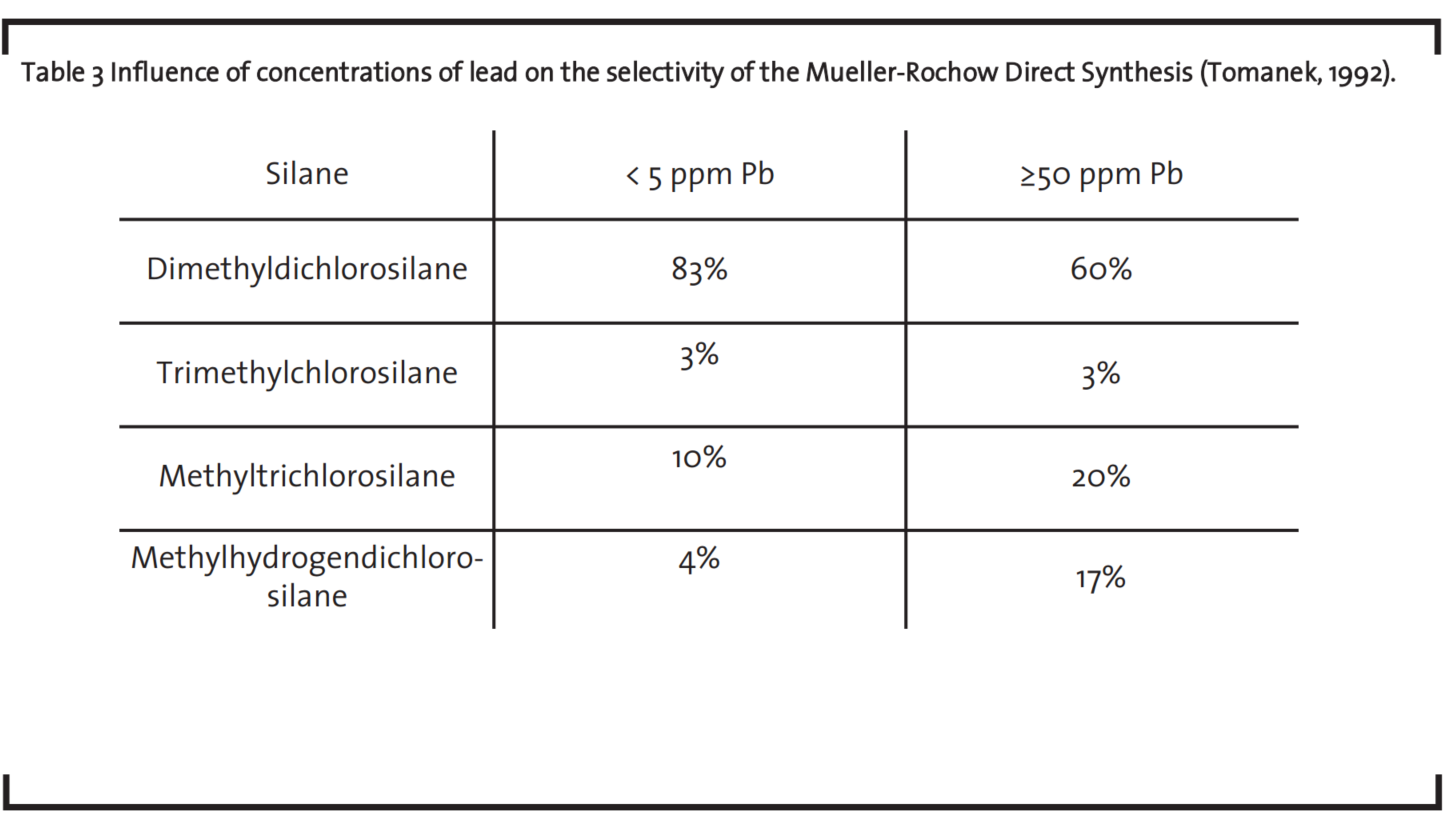
In order to increase the output of methylhydrogendichlorosilane without significant change of the output of all other methylchlorosilanes the raw silane mixture must be varied. In an example published by Tomanek (Tomanek, 1992) the influence of concentrations of lead on the selectivity of the Mueller-Rochow Direct Synthesis is described (see table 3). The selectivity of dimethyldichlorosilane drops significantly with more than 50ppm lead whereas the selectivity of methyltrichlorosilane increases slightly and that of methylhydrogendichlorosilane heavily with higher lead concentration. According to Tomanek (Tomanek, 1992), lead has no influence on the selectivity of trimethylchlorosilane but results in lower Si conversion which effects on a different operation of the unit which is not considered in this study.
In this scenario, at 100% throughput of the Mueller-Rochow Direct Synthesis with adapted selectivity 4,995t of dimethyldichlorosilane are produced, 15% less than in the base scenario with only 85% throughput. Still 1.2x of trimethylchlorosilane is produced according to the higher throughput since the lead concentration has no effect on its selectivity. Significantly more amounts of methyltrichlorosilane and methylhydrogendichlorosilane are produced compared with the base scenario, 1,663t (2.3x) and 1,414t (5.0x), respectively. Also, the waste flow increases by a factor of 3.7 related to the base scenario. The Sankey diagram of this scenario is shown in figure 3.
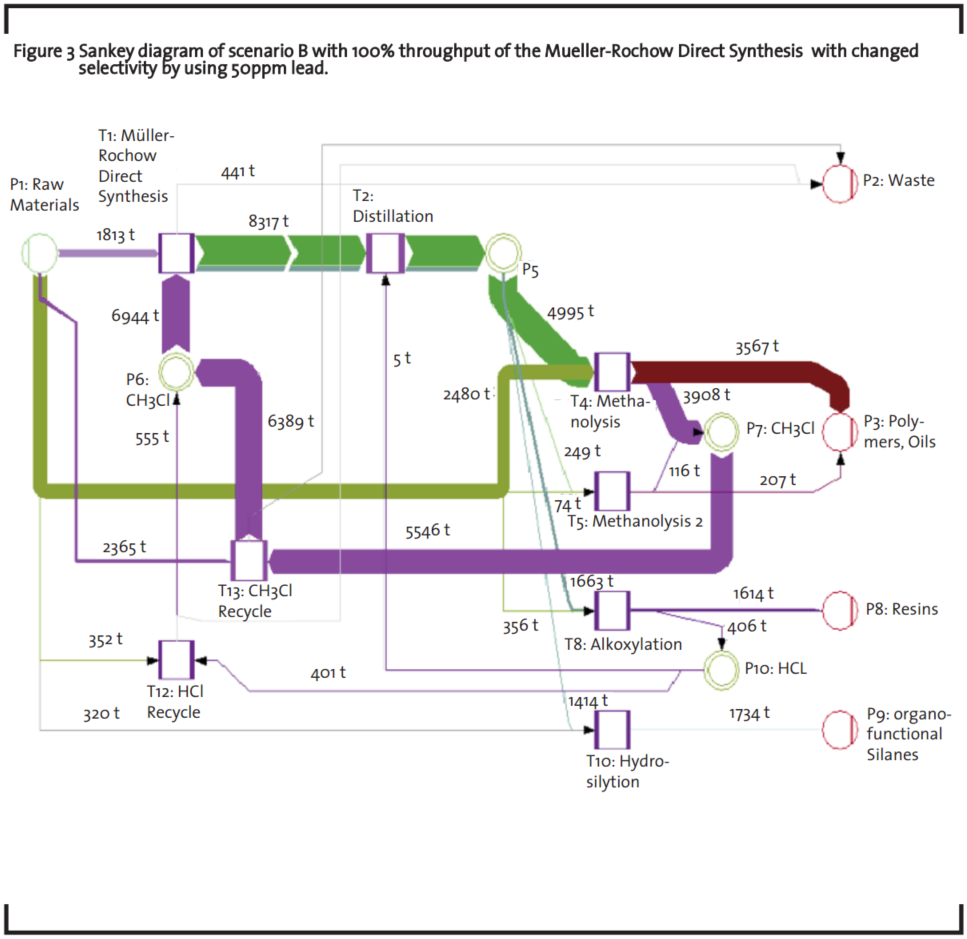
In comparison with the base scenario (see figure 1) it shows also the changes in the precursor flows: 645t less dimethylsilandiol and 30t more trimethylsilanol are produced, the precursors for the main product group of Silicone polymers and oils, while 925t more methyldichloromethoxysilane is produced, the precursor for resins. The output of vinylmethyldichlorosilane, the target precursor for this case study, increases by 1,386t from 348t to 1,734t.
According to stoichiometric, the ratio of feed stock to the reactor changes from 6,684t chloromethane (3.69 : 1) in the scenario A to 6,944t chloromethane (3.83 : 1) in the scenario B to a constant feed of 1,813t silicon. Since less dimethyldichlorosilane is produced in this scenario, less chloromethane is recycled (4,024t) and accordingly more has to be compensated by external sources (2,365t versus 863t in scenario A). Depending on the market prices of raw silicon and chloromethane, costs for waste disposal and the allocation of costs at the Mueller-Rochow Direct Synthesis and the distillation these changes will have a substantial effect on the conversion costs of intermediates and final products.
4.5 Scenario C: Full reactor capacity at adapted selectivity and converter
In scenario B the output of the main precursor for silicone polymers and oils, dimethylsilandiol, is 645t less than in the base scenario. Moreover, there is more methyldichloromethoxysilane than needed for resins. Tomanek described a process to rearrange trimethylchlorosilane and methyltrichlorosilane to dimethyldichlorosilane in presence of aluminum chloride (Tomanek, 1992). The network shown in figure 4 is extended by a converter (T3) undergoing this rearrangement. As initial flow the input to the converter is set to consume the full amount of trimethylchlorosilane out of the distillation in order to compensate the discrepancy of the throughput of dimethylsilandiol in scenario B to the base scenario as much as possible.
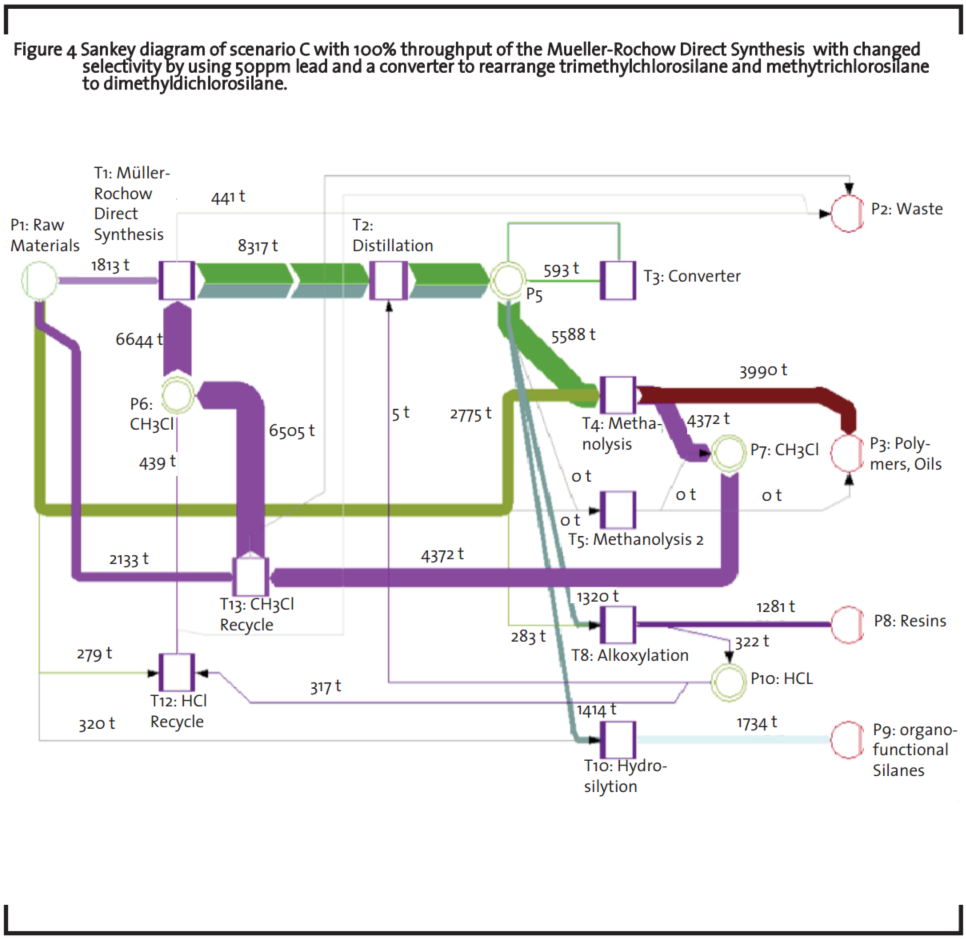
The mass flow of dimethyldichlorosilane to the Methanolysis 1 is due to the converter 95% of the flow in the base scenario leading to 3,990t of dimethylsilandiol for further processing to silicone polymers and oils. Since the full amount of trimethylchlorosilane and 343t methyltrichlorosilane are utilized by the converter, no trimethylchlorosilane reaches the Methanolysis 2 leading to zero trimethylsilanol. In this case, trimethylsilanol has to be purchased from external resources since specific mixtures of dimethylsilandiol and trimethylsilanol are needed to produce silicone polymers and oils. In addition, the reduction of methyltrichlorosilane feed to the Alkoxylation reduces the amount of methyldichloromethoxysilane by 333t related to scenario B without converter but still 592t more than in the base scenario. The mass flow of methylhydrogendichlorosilane is not influenced by the additional process of the converter. Therefore, the amount of vinylmethyldichlorosilane is equal to scenario B and 5.0 times higher than in the base scenario.
The higher amount of chloromethane recycled from the Methanolysis leads to 10% less external supply of chloromethane to feed the MuellerRochow Direct Synthesis. Depending on raw material prices, costs allocation rules, and conversion costs of the converter unit, the reduction of external supply of chloromethane may counterbalance the higher cost of the dimethyldichlorosilane due to the additional converter unit.
4.6 Benchmark of scenarios
The target of this case study is to find the best adaption of the integrated production network to meet the future market demand especially the higher demand on precursors of organo-functional silanes. After investigating several scenarios the results must be benchmarked. According to the target of the study the mass flows of the precursors will be compared first.
In figure 5 the mass flows of the different precursors are shown by the various scenarios. The output of vinylmethyldichlorosilane as the representative of numerous precursors of organo-functional silanes increased in every scenario compared to the base scenario. In scenario A with 100% throughput the increase is only by a factor of 1.2 while in the scenarios B and C with adapted selectivity of the Mueller-Rochow Direct Synthesis the increase is 5.0 times. There is no difference between scenario B and C because the added converter unit in the latter has no influence on the output of vinylmethyldichlorosilane. Since no specific volume of the future demand on organo-functional silanes is defined in the case study, the scenarios cannot be further assessed regarding the throughput of the organo-functional silanes.
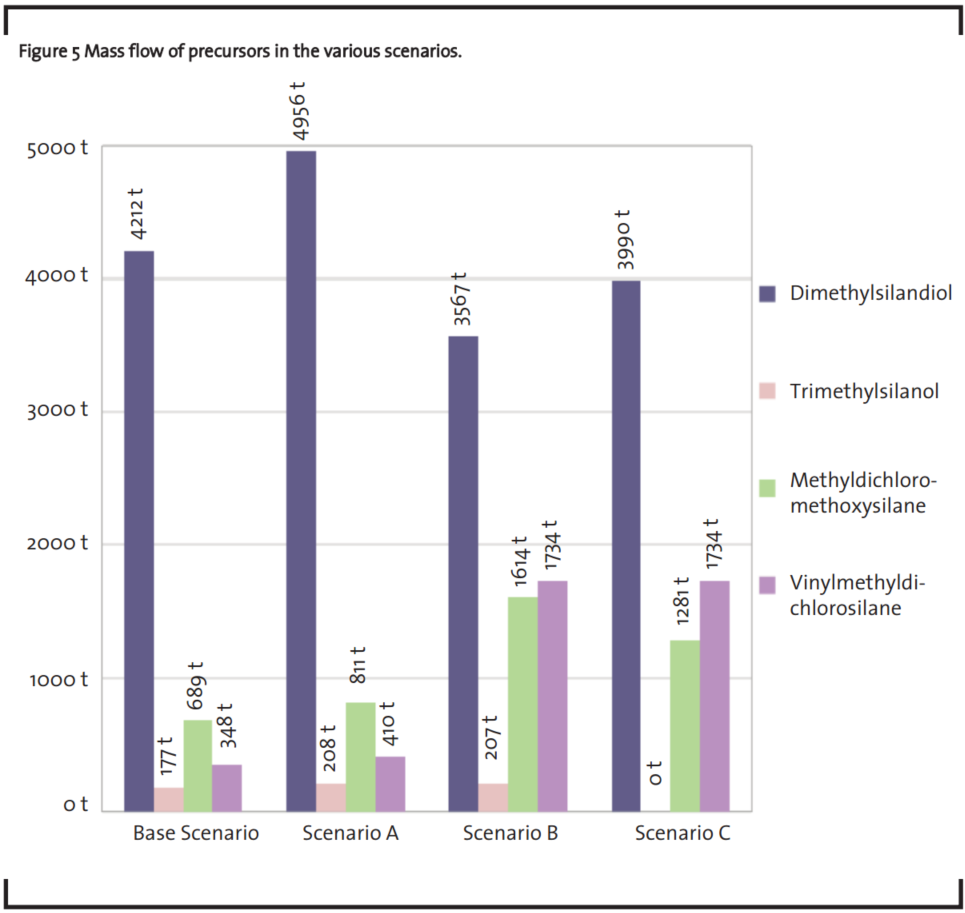
In this case study the future demand on precursors for silicone polymers and oils and for resins remain stable. Only in scenario C the throughput of dimethylsilandiol is nearly equal to the base scenario. In scenario A the throughput is 18% or 743t higher while in scenario B the throughput decreases by 15% or 645t. Concerning trimethylsilanol the scenarios A and B are equal with 18% or 31t increase. Only in scenario C the output of trimethylsilanol drops to zero since the converter consumes all of trimethylchlorosilane to compensate the insufficient throughput of dimethylsilandiol. For further investigations the weighting between dimethylsilandiol and trimethylsilanol must be defined to optimize the converter throughput accordingly. The weighting may be defined by a combination of market demands and prices and also by the contribution margin of final products and the availability of the precursors on the market. Comparing the outlet of methyldichloromethoxysilane in the different scenarios, the mass flow is always higher than the market demand referred to the base scenario. In scenario A and B additional 122t (1.2x) and 925t (2.3x) are produced, respectively. The high surplus production of methyldichloromethoxysilane in scenario B is reduced in scenario C by the converter unit leading to 592t or 1.9 times higher throughput relative to the base scenario.
After having discussed output flows of the network in the paragraphs above figure 6 shows the major input flows. In the scenarios only two throughput levels of the Mueller-Rochow Direct Synthesis are discussed, 85% and 100%. Accordingly only two mass flows of raw silicon are considered as initial flows, 1,541t in the base scenario and 1,813t in all other scenarios.
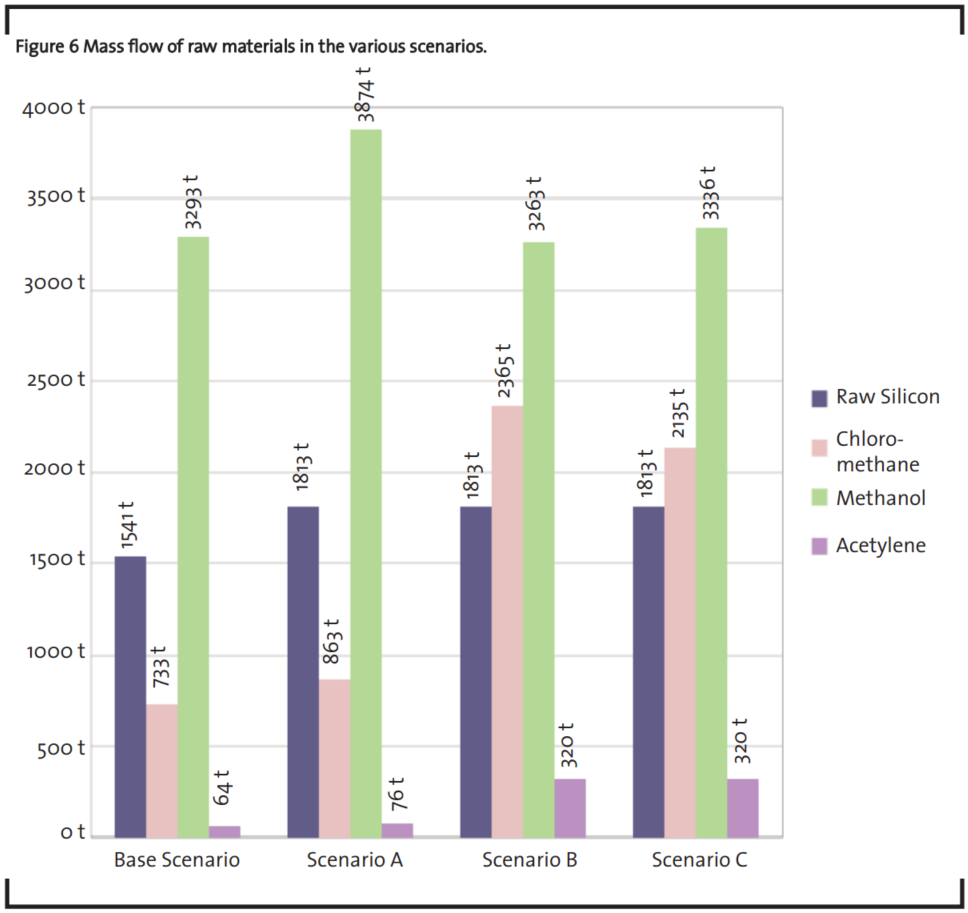
Chloromethane as the second reactant in the Mueller-Rochow Direct Synthesis is mostly supplied by a recycle flow from the Methanolysis units. The deficit on chloromethane must be purchased from external suppliers. The scenarios show a wide variation of external chloromethane supply. The increase of a factor of 1.2 in scenario A is only due to a higher throughput of the Mueller-Rochow Direct Synthesis while the significant increases in scenarios B and C, 3.2 times and 2.9 times, respectively, are due to the change of the selectivity. Higher amounts of methyltrichlorosilane and methylhydrogendichlorosilane are produced in the Mueller-Rochow Direct Synthesis in these scenarios and in their further processing to precursors of resins and organo-functional silanes no chloromethane is created as a by-product feeding the recycle flow. Assuming higher costs for external chloromethane supply compared to internally recycled this effects directly the cost structure of all precursors.
The variation of methanol supply in the different scenarios is mainly driven by the throughputs of Methanolysis 1 and Alkoxylation and its corresponding HCl-Recylce unit (T12). The demand on acetylene is directly related to the vinylmethyldichlorosilane throughput.
The benchmark should be continued with a cost analysis. Using extended material flow analysis the calculation of conversion costs and contribution margins deliver the necessary data base. Several important factors can be included in this cost analysis, e.g., fix and variable costs of all operation units and price elasticity of raw materials, utilities, energies, and final products. Especially the allocation of costs at coupled productions must be considered.
After identifying valuable scenarios from a material and cost perspective the benchmark can be extended by technical feasibility studies and investment estimations. This includes a bottleneck analysis of all operations units and material transport systems, for instance
- Mueller-Rochow Direct Synthesis,
– capacity of crushing and mixing devices
– fluidized bed throughput defined by residence time and thermal household
– cyclone, filter, and scrubber limits
– capability of compressors, pumps and evaporators, pipes and conveyors, etc. - capacity and efficiency of distillation/separation,
– separation efficiency on different feed stocks (pressure levels, reflux ratio, fee ding points, etc.)
– dimensions of columns and heat exchangers - capacity of cycle flows,
– transport and interim storage
– reconditioning and treatment - capacity of downstream units,
– cycle times and reactor dimensions
– capacity of post processing units, e.g., cleaning, packaging, etc.
– operation planning of batch and semicontinuous processes
– interim storages - Configuration of utilities and energy suplies, e.g., heat integration via pinch technology,
- Environmental and safety matters, e.g.,limits on waste disposal or storage of hazardous materials.
Based on the bottleneck analysis the necessary investments for the debottlenecking can be estimated. Moreover a timeline and a transition plan should be developed how the current configuration of the integrated production network should be transferred into the new configuration according to the investigated scenario. It is important to consider the transition phase in the benchmark since production should continue efficiently as long as possible during the transition which typically takes several years. Not all scenarios will have the possibility to earn money during the transition into the new configuration. The transition phase can be modeled stepwise using several extended material flow analyses.
Important key figures can be estimated using the collected data of every scenario and benchmarked, e.g., ROI, IRR, earnings before interest, taxes, depreciation, and amortization (EBITDA ), etc.
A full benchmark can be done using a weighted decision matrix where every scenario is scored along a set of criteria or key figures (Grundig, 2006, Lunau et al., 2008). The weighting factor of every criterion or key figure is multiplied with the score and summed up to a total score per scenario. The highest total score is the best scenario according to the criteria and weighting. The extended material flow analysis is an iterative process. Any target conflicts depicted in the benchmark may lead to ideas or combinations of new promising scenarios which shall be investigated.
5 Discussion
In a simplified case study the methodology of the extended material flow analysis is demonstrated. Even if the discussed drastic change in the product mix due to a change in the selectivity of the Mueller-Rochow Direct Synthesis cannot be produced without huge investments in different production lines, it demonstrates the strong effect of few process steps on the product portfolio and on the economic efficiency of an integrated production network. It also demonstrates the complexity and sometimes unexpected results of changes in these networks. Especially the conversion cost of the final products in an adapted network estimated by cost analysis is of high value for far-reaching decisions. In the discussed case further literature search may reveal an adapted change of the selectivity of the Mueller-Rochow Direct Synthesis to better fit to the market demands and reduce investments. Extended material flow analysis can be also used here to define the target for a R&D project to identify specific process conditions of the MuellerRochow Direct Synthesis to adjust the selectivity according to the defined optimized scenario.
Starting with material flow analysis and extending with cost and investment analyses while using scenario techniques, an optimized configuration of the integrated production network can be found by using extended material flow analysis. The potential to consider the majority of relevant aspects describing the capability and efficiency of integrated production networks makes this methodology very powerful and beneficial. One modeled network can be analyzed from different perspectives simultaneously, e.g., resource efficiency and productivity, economic and ecological efficiency, life cycle assessment (LCA), technical capability, and risk assessment.
The descriptive and prescriptive character of the extended material flow analysis allows estimation of unknown flows, identification of constrains and correlations, cause-and-effect chains, dependancies between throughput, energy consumption, and costs providing a basis for product and project portfolio analyses, profitability analyses, and investment appraisals, to name only a view possible applications of extended material flow analysis. Using various display formats, e.g., balance sheets and Sankey diagrams, even complex results of an investigation can be presented in a transparent and comprehensive manner. Therefore, extended material flow analysis supports the definition of proper mid to long-term development strategies for integrated production networks to follow the company’s vision.
References
Alberti, K.. (2001): Business Risk Management – StrategischerAnsatz zur Steigerung des Unternehmenswertes: in Festel, G., Hassan, A., Leker, J., Bamelis, P. (ed.), Betriebswirtschaftslehre für Chemiker – Eine praxisorientierte Einführung, Springer-Verlag, Berlin, p.109-115
Bode, A., Buerkle, J., Hoffner, B., Wisniewski, T. (2011): Ein Blick durch die Kostenbrille: Anwendung von Stromanalysen zur Bewertung und Verbesserung von Produktionsprozessen, Chemie Ingenieur Technik, 83(10), p. 1553-1564
Brudermueller, M. (2001): Produktionsverbund in der chemischen Industrie:in Festel, G. Soellner, F., Bamelis, P. (ed.), Volkswirtschaftslehre für Chemiker, Springer-Verlag, Berlin, p. 168-180
Brudermueller, M., Langguth, E. (2001): Kuppelproduktion:in Festel, G., Hassan, A., Leker, J., Bamelis, P. (ed.), Betriebswirtschaftslehre für Chemiker – Eine praxisorientierte Einführung, Springer-Verlag, Berlin, p.288-298
Brunner, P. H., Rechberger, H. (2003): Practical Handbook of Material Flow Analysis, CRC Press LLC
Daenzer, W., Huber, F. (ed.), (1994): Systems engineering: Methodik und Praxis, 8th ed., Verlag Industrielle Organisation, Zuerich
Duggan, K. (2012): Creating Mixed Model Value Streams: Practical Lean Techniques for Building to Demand, 2nd ed., CRC Press, Boca Raton
Fandel, G., Fey, A., Heuft, B., Pitz, T. (2009): Kostenrechnung, 3rd ed., Springer-Verlag, Berlin, p. 192-203
Gartner Inc. (2012): Cool Vendors in Green IT and Sustainability, available at http://www.gartner.com/technology/reprints.do?id=1-1AN8URJ&ct=120524&st=sg#h-d2e177 accessed January 6th 2013
Grossmann, I. (2005): Enterprise-wide Optimization: A New Frontier in Process Systems Engineering, AIChE Journal, 51(7), p. 1846-1857
Grundig, C-G. (2006): Fabrikplanung: Planungssystematik – Methoden – Anwendungen, 2nd ed., Carl HanserVerlag, Munich, p. 173-181
Haeuslein, A., Hedemann, J. (1995): Die Bilanzierungssoftware Umberto und mögliche Einsatzgebiete, in Schmidt, M.,Schorb, A. (ed.), Stoffstromanalysen in Oekobilanzen und Oeko-Audits, Springer-Verlag, Berlin, p. 59-78
Langguth, E., Brudermueller, M. (2001): Kalkulation bei Kuppelproduktion: in Festel, G., Hassan, A., Leker, J., Bamelis, P. (ed.), Betriebswirtschaftslehre für Chemiker – Eine praxisorientierte Einführung, Springer-Verlag, Berlin, p.534-540
Lunau, S., Mollenhauer, J.-P., Staudter, C., Meran, R., Hamalides, A., Roenpage, O., von Hugo, C. (2008): Design for Six Sigma + Lean Toolset – Innovationen erfolgreich realisieren, Springer, Berlin
Moeller, A., Rolf, A. (1995): Methodische Ansätze zur Erstellung von Stoffstromanalysen unter besonderer Berücksichtigung von Petri-Netzen: in Schmidt, M., Schorb, A. (ed.), Stoffstromanalysen in Oekobilanzen und OekoAudits, Springer-Verlag, Berlin, p. 33-58
Proud, J. (2007): Master Scheduling: A Practical Guide to Competitive Manufacturing Scheduling, 3rd ed., John Wiley & Sons, Hoboken
Schmidt, M. (2008a): The Sankey Diagram in Energy and Material Flow Management, Part I: History, Journal of Industrial Ecology, 12(1), p. 82-94
Schmidt, M. (2008b): The Sankey Diagram in Energy and Material Flow Management, Part II: Methodology and Current Applications, Journal of Industrial Ecology, 12(2), p. 173-185
Tomanek, A. (1992): Silicones and Industry. A compendium for practical use, instruction and reference, Carl Hanser Verlag, Munich
VCI-Prognos-Study (2012): Die deutsche chemische Industrie 2030, available at https://www.vci.de/Services/Publikationen/Broschueren-Faltblaetter/Seiten/PrognosStudie_2030.aspx, accessed January 6th 2013
Viere, T. (2009): Verbundnetz chemische Industrie: in Schmidt, M., Lambrecht, H., Moeller, A. (ed.), Stoffstrombasierte Optimierung – Wissenschaftliche und methodische Grundlagen sowie softwaretechnische Umsetzung, MVVerlag, Münster, p. 167-173