Decarbonization strategies in converging chemical and energy markets
Abstract
Transforming the chemical industry to carbon neutrality requires abundant and cheap renewable energy as well as synergies and flexibilities from a convergence of the chemical and energy markets. Decarbonization strategies need to manage technical, financial and stakeholder requirements in an uncertain, volatile and ambiguous regulatory and socio-political environment.
1 Introduction
Today’s chemical industry is built on fossil hydrocarbons, which are used as feedstock and a source of energy. The industry is a significant contributor to human made greenhouse gas (GHG) and carbon dioxide (CO2) emissions. Via national and European associations, the chemical industry has communicated the goal to become carbon neutral by 2050 at the latest (Stoy, 2019). Higher energy and resource efficiencies, using bio- or waste-based feedstocks and circulating materials are activities currently being undertaken. However, all of this covers only about 40% of the emission reduction goal. The remaining 60% requires abundant, cheap renewable energy and a convergence of the chemical and energy markets. The higher the synergy and flexibility of this convergence, the less carbon-capture utilization (CCU) and sequestration (CCS) is needed to achieve emission targets. A smart utilization of synergies between chemical and energy markets could go well beyond the implementation of new climate standards and beyond the borders of the chemical industry. The chemical industry is the critical linking pin between natural resources and energy and the downstream industrial and consumer applications. Rather than being part of the emission problem it could become the engine to build decarbonized supply chains from natural resources to consumers and the creator of a new, differentiating, green and intersectoral “Verbund” in Europe.
2 Current situation — almost 10% of GHG/CO2 emissions created by the chemical industry
In 2018, 85% of the global energy supply was based on fossil hydrocarbons, especially crude oil, natural gas and coal (IEA WEO and Statista, 2019). Those fossil hydrocarbons contain high concentrations of carbon – 75% of natural gas, 86% of crude oil and 96% of coal (IPCC, 2006). By combustion, utilization and potentially second use of fossil hy-drocarbons, practically all carbon will ultimately end up as carbon dioxide (CO2) in the atmosphere. There is a widely accepted consensus (COP 21, UNFCCC, 2015) that human-made CO2 emissions from fossil hydrocarbons are the major source of greenhouse gas emissions and thus global warming and climate change. Until 1971 oceans and vegetation could completely compensate for the human made emissions. In 1990 the earth overshoot day was December 7th and in 2019 it was already on July 29th. This discussion is not new, but started more than two decades ago, when 192 parties signed the Kyoto Protocol (Kyoto Protocol, 1997).
However, reality is very different from those agreements and ambitions (IEEJ, 2018; IEA 2018; Jacob 2019; OPEC 2018). Predictions forecasted much more energy and resource efficiency activities and a global energy demand growth below 1% per annum. In 2018 and 2019 energy demand has grown more than 2% per annum, which is almost in line with the growth rate of global gross domestic product. Even more concerning is the fact that more than two thirds of the new energy supply additions are based on fossil hydrocarbons (Deloitte 2019a; IEA 2019; CNPC 2018; Equinor 2018, Shell 2019).
This does not at all match the COP21 climate targets. The latest congress in December 2019 in Madrid (COP25) has shown that countries that have strong oil, gas or coal industries, such as the United States, Brazil, China, India, Saudi Arabia or Australia, are resisting change.
In order to achieve the 2030 greenhouse gas (GHG) emission targets and to limit global warming to 1.5oC, energy consumption would need to be reduced drastically. We are talking about an order of magnitude of the energy consumption of the whole of Europe and the United States together. This is unlikely to happen in the next decade. Just the opposite: decarbonization activities in many sectors will demand much more renewable energy. However, we are often too optimistic about what we can achieve in the shorter term, but are too pessimistic about what we can change longer term (Amara, 1978). Those changes typically come exponentially. Just think about the lengthy discussions and ultimately very effective ban of fluorocarbons to fight ozone layer depletion.
Almost three quarters of the 2018 energy demand growth and global greenhouse gas emissions come from China (33%), the United States (29%) and India (11%) (IEA, 2019). Forty percent of the energy is used for power generation (electricity and heat), followed by transportation (23%, planes, vehicles, ships) and industry (21%, especially iron and steel, cement, chemicals and fertilizers, refineries, non-ferrous metals, ferroalloys and silicon, pulp and paper, ceramics, lime and glass). Statistics show a sector view within the four walls of each industry, neglecting the interlinkages. In order to cover the full carbon footprint, it is more advisable to have a usage or application view that reaches back all the way to the natural resources being used. This would mean that we look at the carbon footprint of housing including heating or cooling, mobility of people and goods, food chains from farm to plate, healthcare, communications, clothing, leisure and sports, etc. Individual carbon footprint calculators, like those offered by WWF, TerraPass, ICAO, EPA, Climate Care or CarbonTrust, do exactly that. They all have different scopes of which categories and emissions are included and which are not. There is no commonly agreed upon emission data set, but the carbon footprint calculators directionally point at the most relevant emissions and ask for appropriate actions.
When looking at the climate impact of the chemical industry, we suggest to do the same and look at the application of chemicals and materials from natural resources to consumption. This means to not only look at scope 1 emissions (WIR/ WBCSD, 2019) from chemical operations, but also scope 2 emissions from imported energy and scope 3 emissions from purchased products, transportation and application and usage of chemicals and materials. This broader view helps to identify sustainable, climate-friendly applications and those, where other solutions are preferable. However, it is not always easy for a producer of chemicals or materials to know enough about all relevant applications or to be able to steer demand into certain application areas and avoid others. Thus often the producer and product perspective is taken as a pragmatic shortcut. By doing that, the chemical industry is often seen as part of the emission problem rather than an obvious part of the solution, i.e. any decarbonization strategy or abatement of emissions needs the chemical industry to succeed. The chemical industry is the crucial linking pin to carbon neutrality. It transforms natural resources and energy into industrial and consumer products and solutions. It is appropriate to show the avoided GHG/CO2 emissions through precision applications, insulation, electrification, renewable power generation and distribution, lightweight materials and chemicals rather than other material alternatives. In any case, we recommend to consider the GHG/CO2 emissions within four walls plus indirect emissions from transport, third-party energy and feedstock supply. By doing that, the chemical industry‘s GHG/CO2-emissions are almost 10%, which is nearly double the numbers found in most statistics.
Between 1990 and 2015, those emissions more than doubled globally (Figure 1) and with the chemical industry growing at 1.5 times the rate of global GDP (CEFIC, 2020), the sector’s CO2 emission share is likely to further increase in the future. More than 85% of current investment decisions in the chemical industry are in favor of fossil hydrocarbons, while less than 15% of global investments are currently in favor of renewables (bio- or waste-based), recycling (mechanical and chemical) or energy and resource efficiency improvements. Boards are currently struggling to dedicate more money to green investments, as they typically have lower returns than fossil hydrocarbon-based ones.
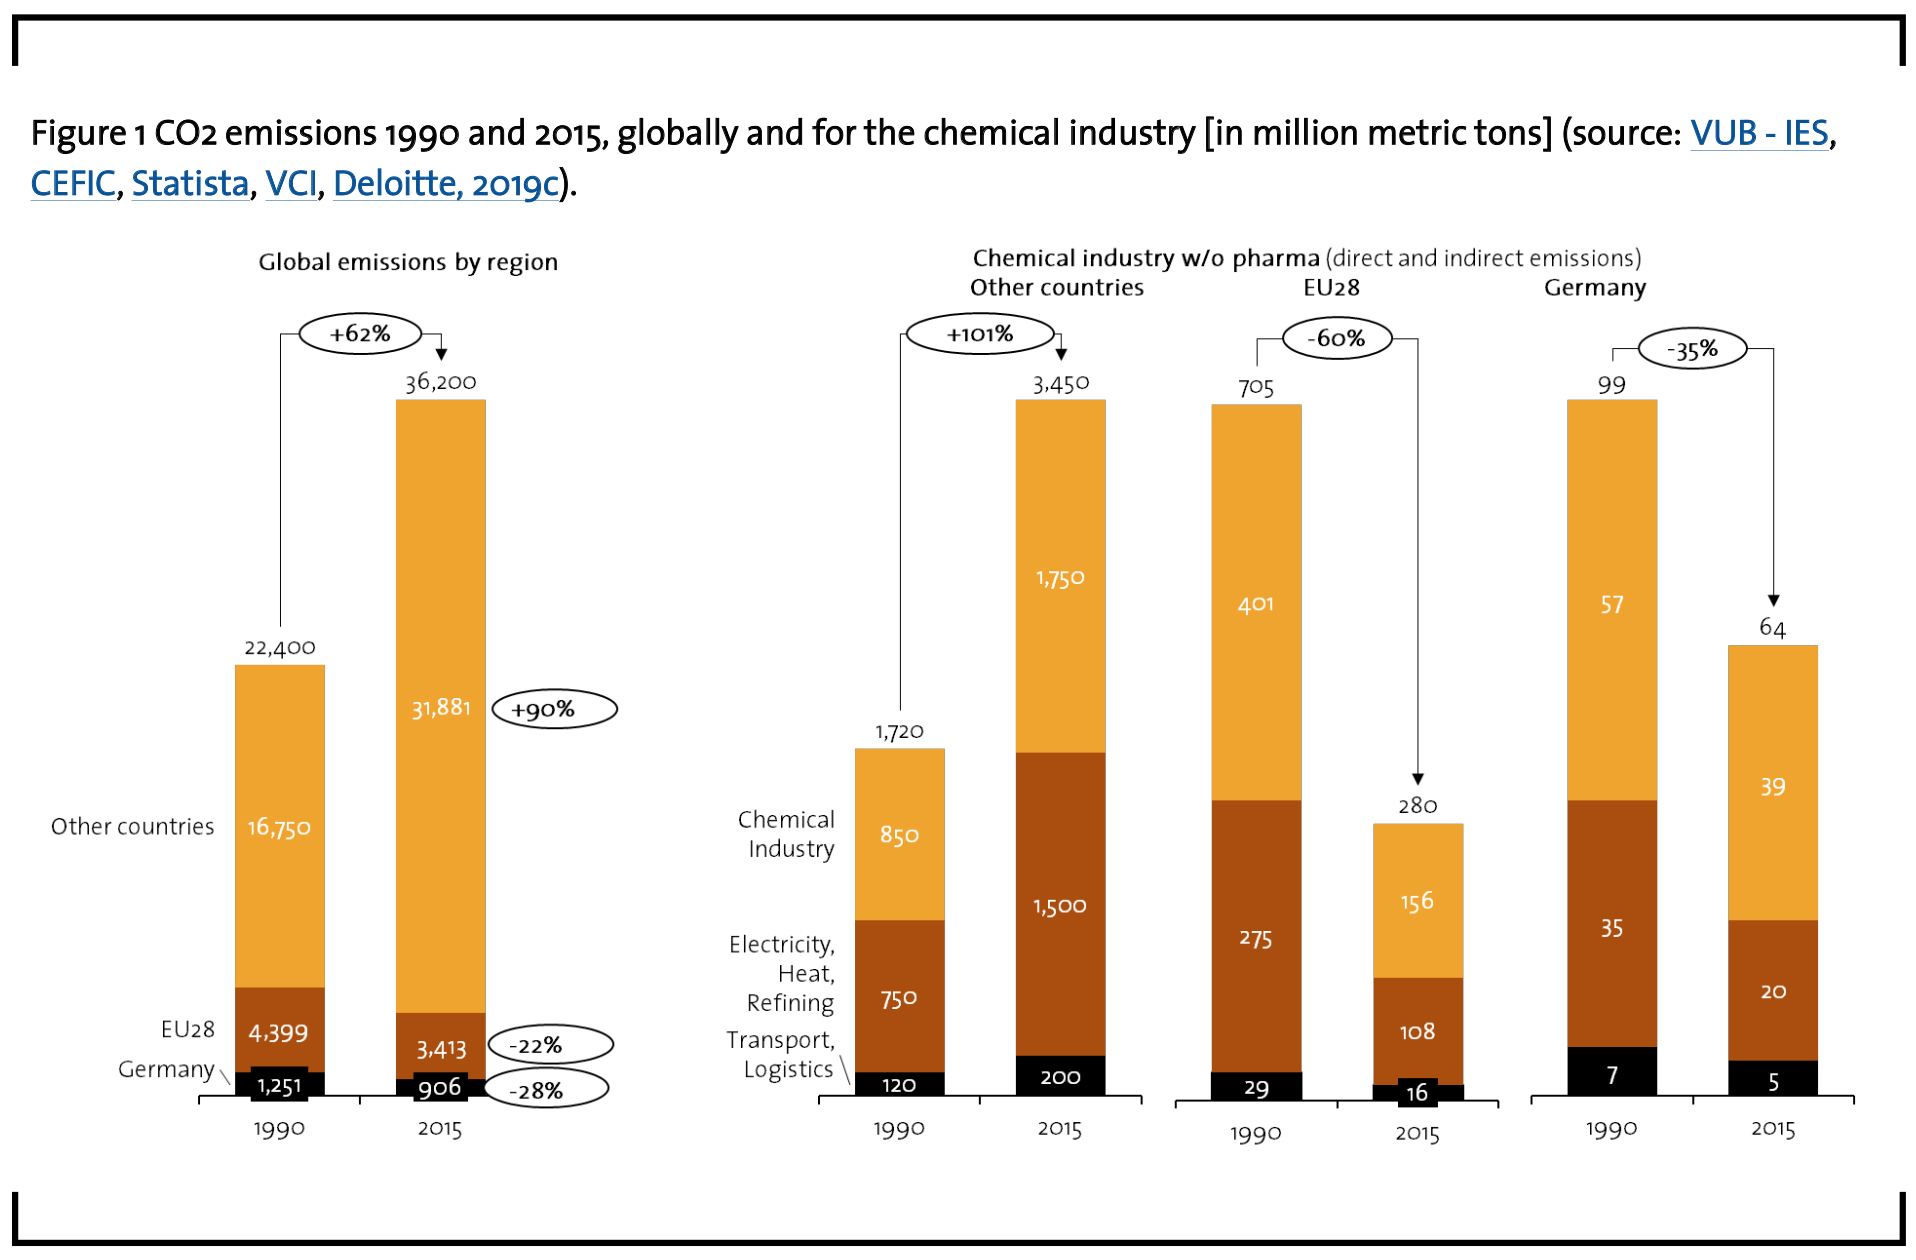
When looking to Europe/ EU27 or, more specifically, Germany, we see different dynamics (Wachsmut 2018; Wyns 2018). In Germany, the chemical industry´s share of CO2 emissions has decreased significantly over the past few decades despite more output and value creation (VCI, 2019c).
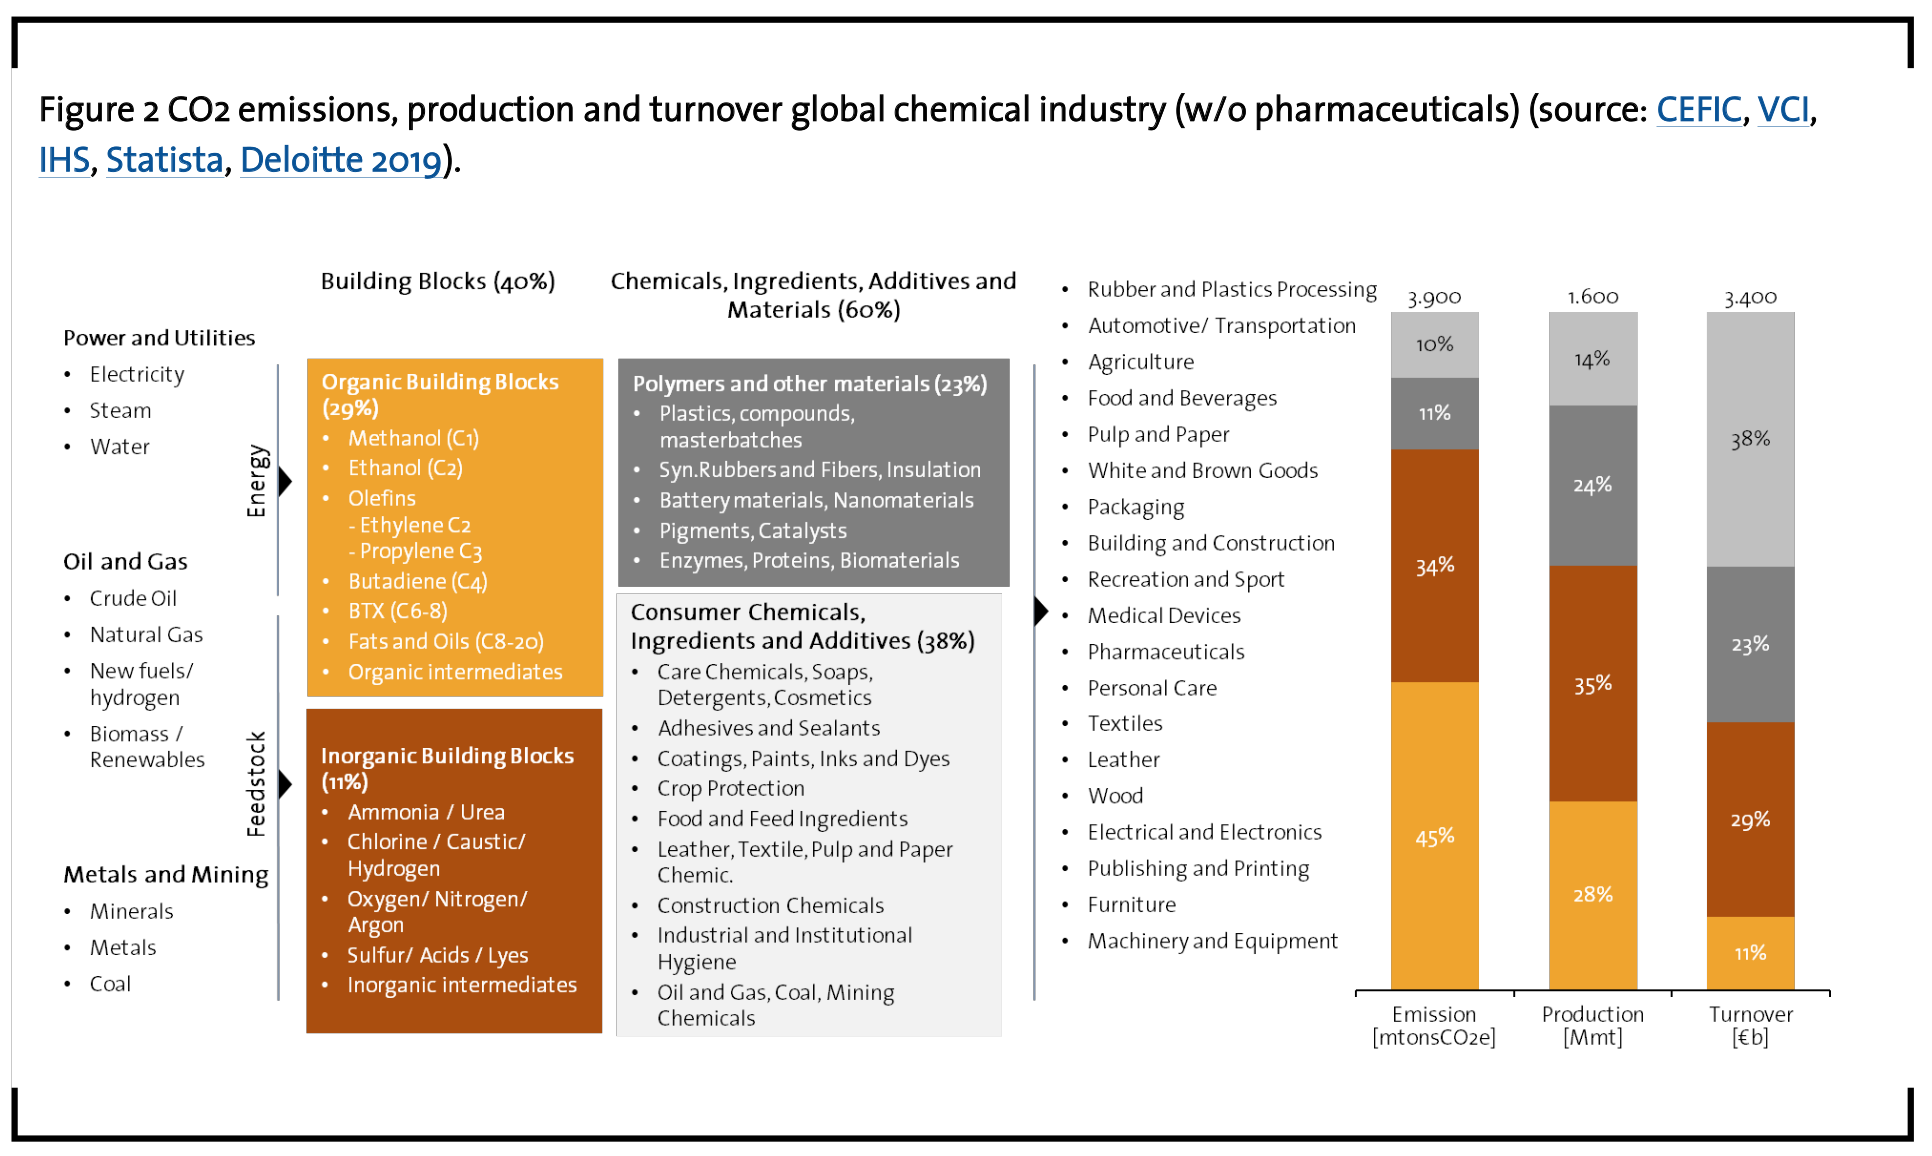
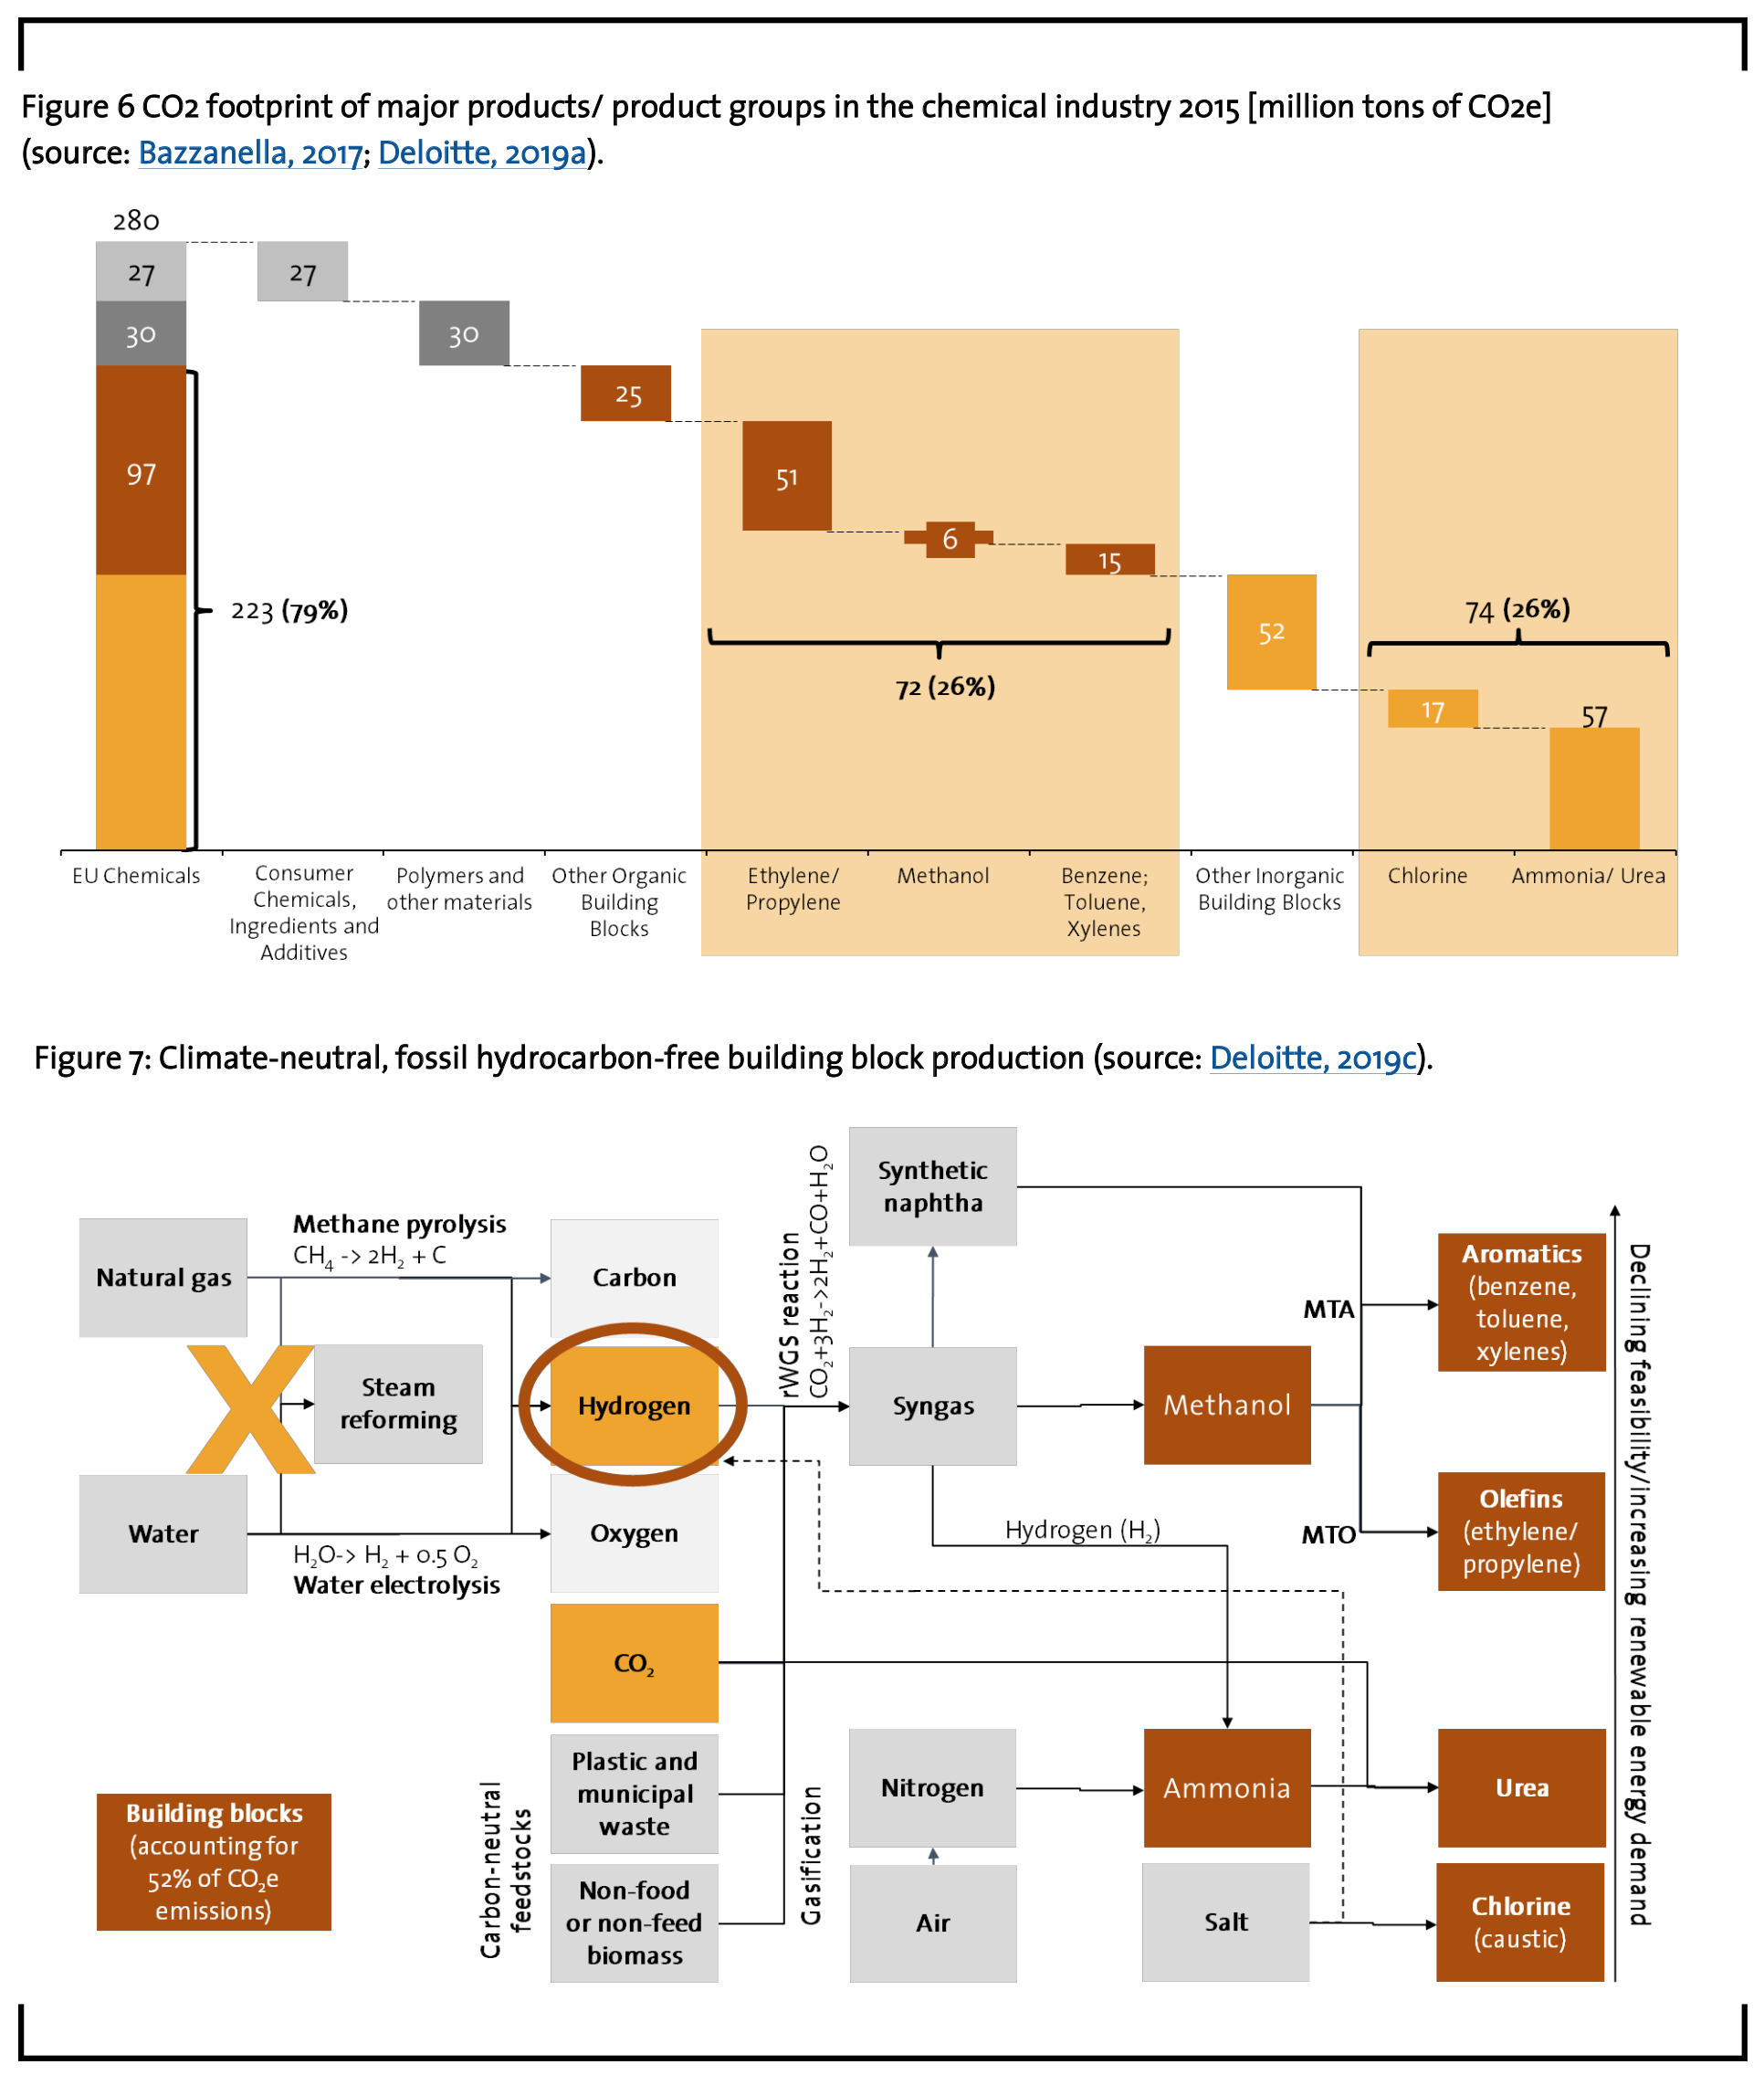
Germany has a much higher share of renewable electricity sources, in 2018 at 38% compared to 4% globally (UBA, 2019). Until 2025 the renewables share is expected to be 40-45% (Bmwi, 2019). However, this reflects electricity, not heat, which is an important energy source for the chemical industry. The European and German chemical industries have accelerated energy and resource efficiency actions, moved selectively to bio- and wastebased materials, and are exploring opportunities related to mechanical and chemical recycling of materials (VCI, 2019). However, the bulk of the impact is due to the fact that the European and German chemical industry is becoming less and less competitive in producing organic and inorganic building blocks. These building blocks account for more than three quarters of the energy and CO2 intensity and also emissions of the industry, but cover only 40% of revenue (Figure 2).
By shortening the value chain, we have become greener in Europe and Germany. However, the climate does not care if GHG and CO2 emissions are generated inside or outside the EU or Germany. And thus, the question is: How long can we sustain a high-value-creating European and German chemical industry without being backward integrated into feedstocks? There is a widely shared view that further cutting the roots of the European and German chemical industry by importing energy- and CO2-intense building blocks cannot be the solution. Doing so would not contribute to meeting global climate targets and would further endanger the sustainability of the integrated downstream structures of specialty, fine and consumer chemicals as well as materials, whether plastics, rubbers, fibers, catalysts, batteries, packaging or others.
It is a fact that the chemical industry in Europe is losing global competitiveness (CEFIC, 2019) especially in the backend of basic building blocks and petrochemicals, despite its absolute revenue, value and export growth. In 2007, EU28 accounted for more than 27% of the global chemical industry. In 2018, it accounted for less than 17% in spite of 0.7% p.a. absolute growth.
3 Climate protection — a societal challenge
The perception of sustainability as a costly luxury has changed irrevocably, especially in the past 12-18 months. With the energy transition well underway, the financial risks and opportunities of de-carbonization are now an imperative for consideration at the board level. The political and societal discussions around climate protection and carbon neutrality are captured in the form of climate and emission targets, especially in Europe and Germany.
The energy intense industries, which include base chemicals and fertilizers, are currently more defensive and see short-term cost increases and much higher energy consumption with higher carbon dioxide, raw material and energy prices that are able to destroy the competitiveness of the European energy-intensive industries (VCI, 2019d).
At the same time the direct and indirect customers of the chemical industry are already taking action on decarbonization and signed up for initiatives such as the RE100 (https://there.100.org) or the B Team (https://bteam.org). Specialty chemicals and consumer chemicals companies like Akzo, BASF, Bayer, Corbion, DSM, Givaudan, IFF and LANXESS are starting to follow the trend. This may have more stability and longevity than any political trend. At the same time investor pressure is being exerted on chemical companies to disclose their climate risks with respect to transition risk (winning or losing product portfolio, carbon pricing, stranded assets, etc.), regulatory risks (regulations, license to operate, etc.) and physical risks (damaging weather events, low or high water levels influencing logistics, etc.). Under a range of future scenarios, the impacts on companies ´ earnings over the next 10 to 20 years can flag material potential writedowns. While this pressure is currently mostly being felt by the global companies, from the investor pressure combined with the increasing community expectations, chemical companies at the national level are likely to experience the same within the next year or two.
The change is rapid and the biggest risk for organizations is to be blindsided. There are however also significant opportunities for those that are innovative. There is a nascent demand for “green” or carbon neutral products and solutions across the economy and in export markets.
On December 11, 2019 the European Union presented a “Green Deal” that will enable the EU to become the first climate neutral continent by 2050 (EU, 2019). It foresees the supply of clean, affordable and secure energy and a mobilization of several industries for a clean and circular economy. The focus is on cities that account for two thirds of energy consumption and more than 70% of greenhouse gas emissions.
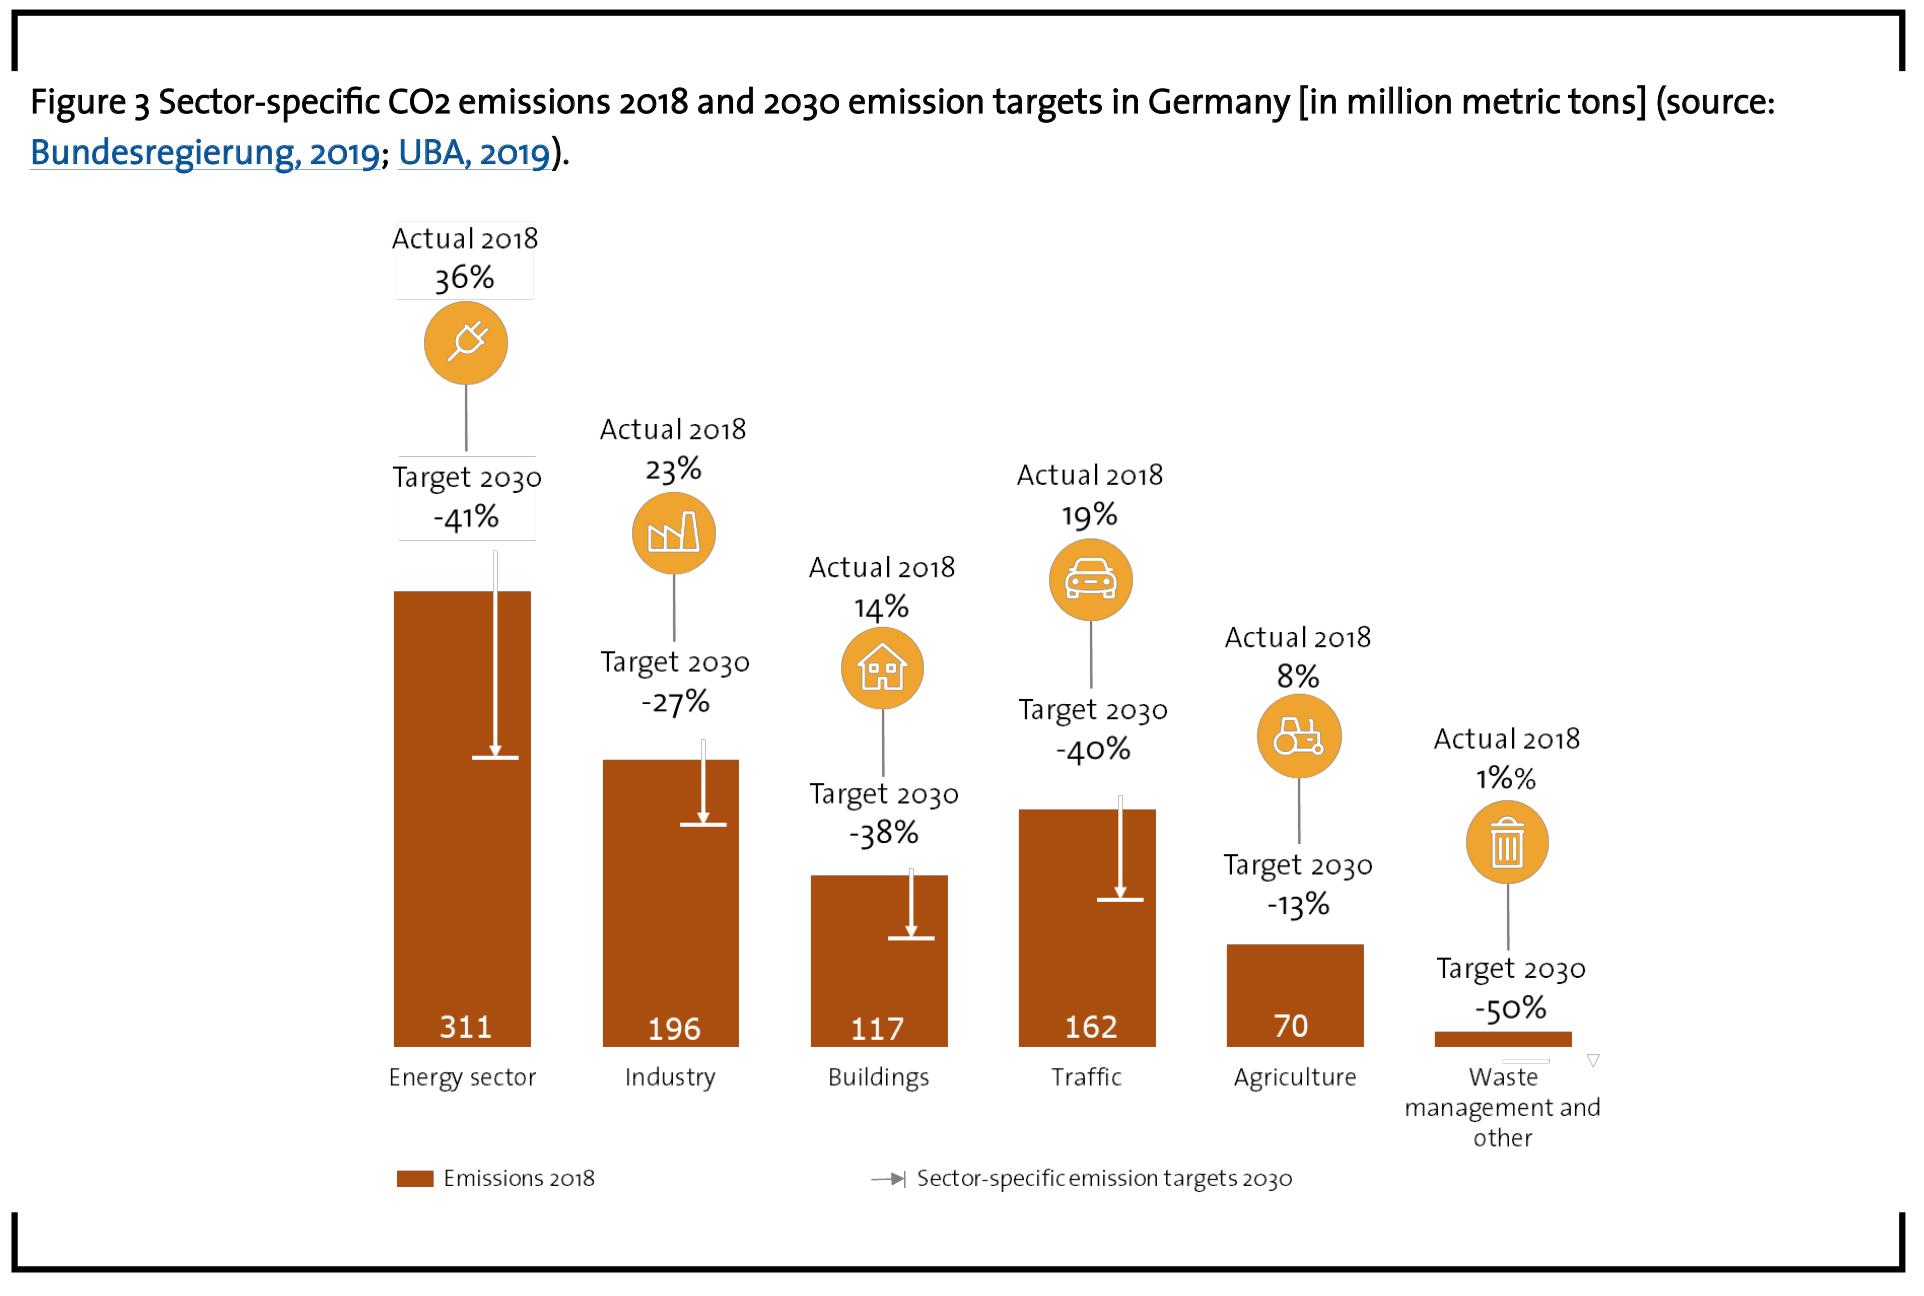
Some countries are starting to define sectorspecific emission targets based on the European emission framework (Figure 3). They will be achieved by 2030 and are based on 2018 actuals.
In Germany, for instance, the energy sector contributed 36% of CO2 emissions in 2018. Industry (23%), traffic (19%), buildings (14%), agriculture (8%) followed. Specific reduction targets of 41% for the energy sector and 23% for the industry sectors have been defined. Note that those politically determined, sectorspecific emission reduction targets neither facilitate cross-sector synergies nor do they reflect the convergence of the energy sector with other industries.
Moving from fossil hydrocarbon to renewable energy generation has the biggest emission reduction impact in absolute terms. This might be easily overcompensated by a much higher demand for renewable energy. Wind and solar are the typical renewable energies in Germany that substitute nuclear and fossil hydrocarbon energies. However, smart grids, buffers and storage technologies are needed to secure reliable power generation. An integration with mobility (power-to-fuels), heating (power-to-heat) and industrial sectors (powerto- products) can help to achieve the set targets.
Industry is the second biggest user of energy in the form of electricity and heat in Germany. Unlike other energy-intensive industries, the Prechemical industry has a dual challenge. It is faced with the substitution of fossil hydrocarbon-based generation of electricity and steam and fossil hydrocarbon feedstocks. Crude oil and to a lesser extent natural gas and coal are by far the largest feedstock suppliers of the chemical industry. While demand for crude oil for heating and mobility applications is starting to decline, demand for chemical applications is growing strongly. Direct Crude Oil-to-Chemicals (COTC) technologies have the potential to merge refining and petrochemicals and more than double the value that can be unlocked from a barrel of crude oil (IHS, 2019; Dickson, 2019). However, Asia, the Middle East and the US Gulf Coast are the primary regions to build and use these technologies.
4 Decarbonization options — efficiency, carbon-neutral feedstocks and circular flows are insufficient to meet emission targets
In spite of the achievements already made by the chemical industry in Europe and Germany, more work is required to meet the European and German climate targets (Simon 2019). In order to achieve those targets, the industry has to avoid the use of fossil hydrocarbons, both as a feedstock and as a source of energy (Figure 4). Although it is not fully clear which activities will ultimately lead to achieving the climate targets (Günther, 2019), there are some obvious decarbonization options and pathways to consider.
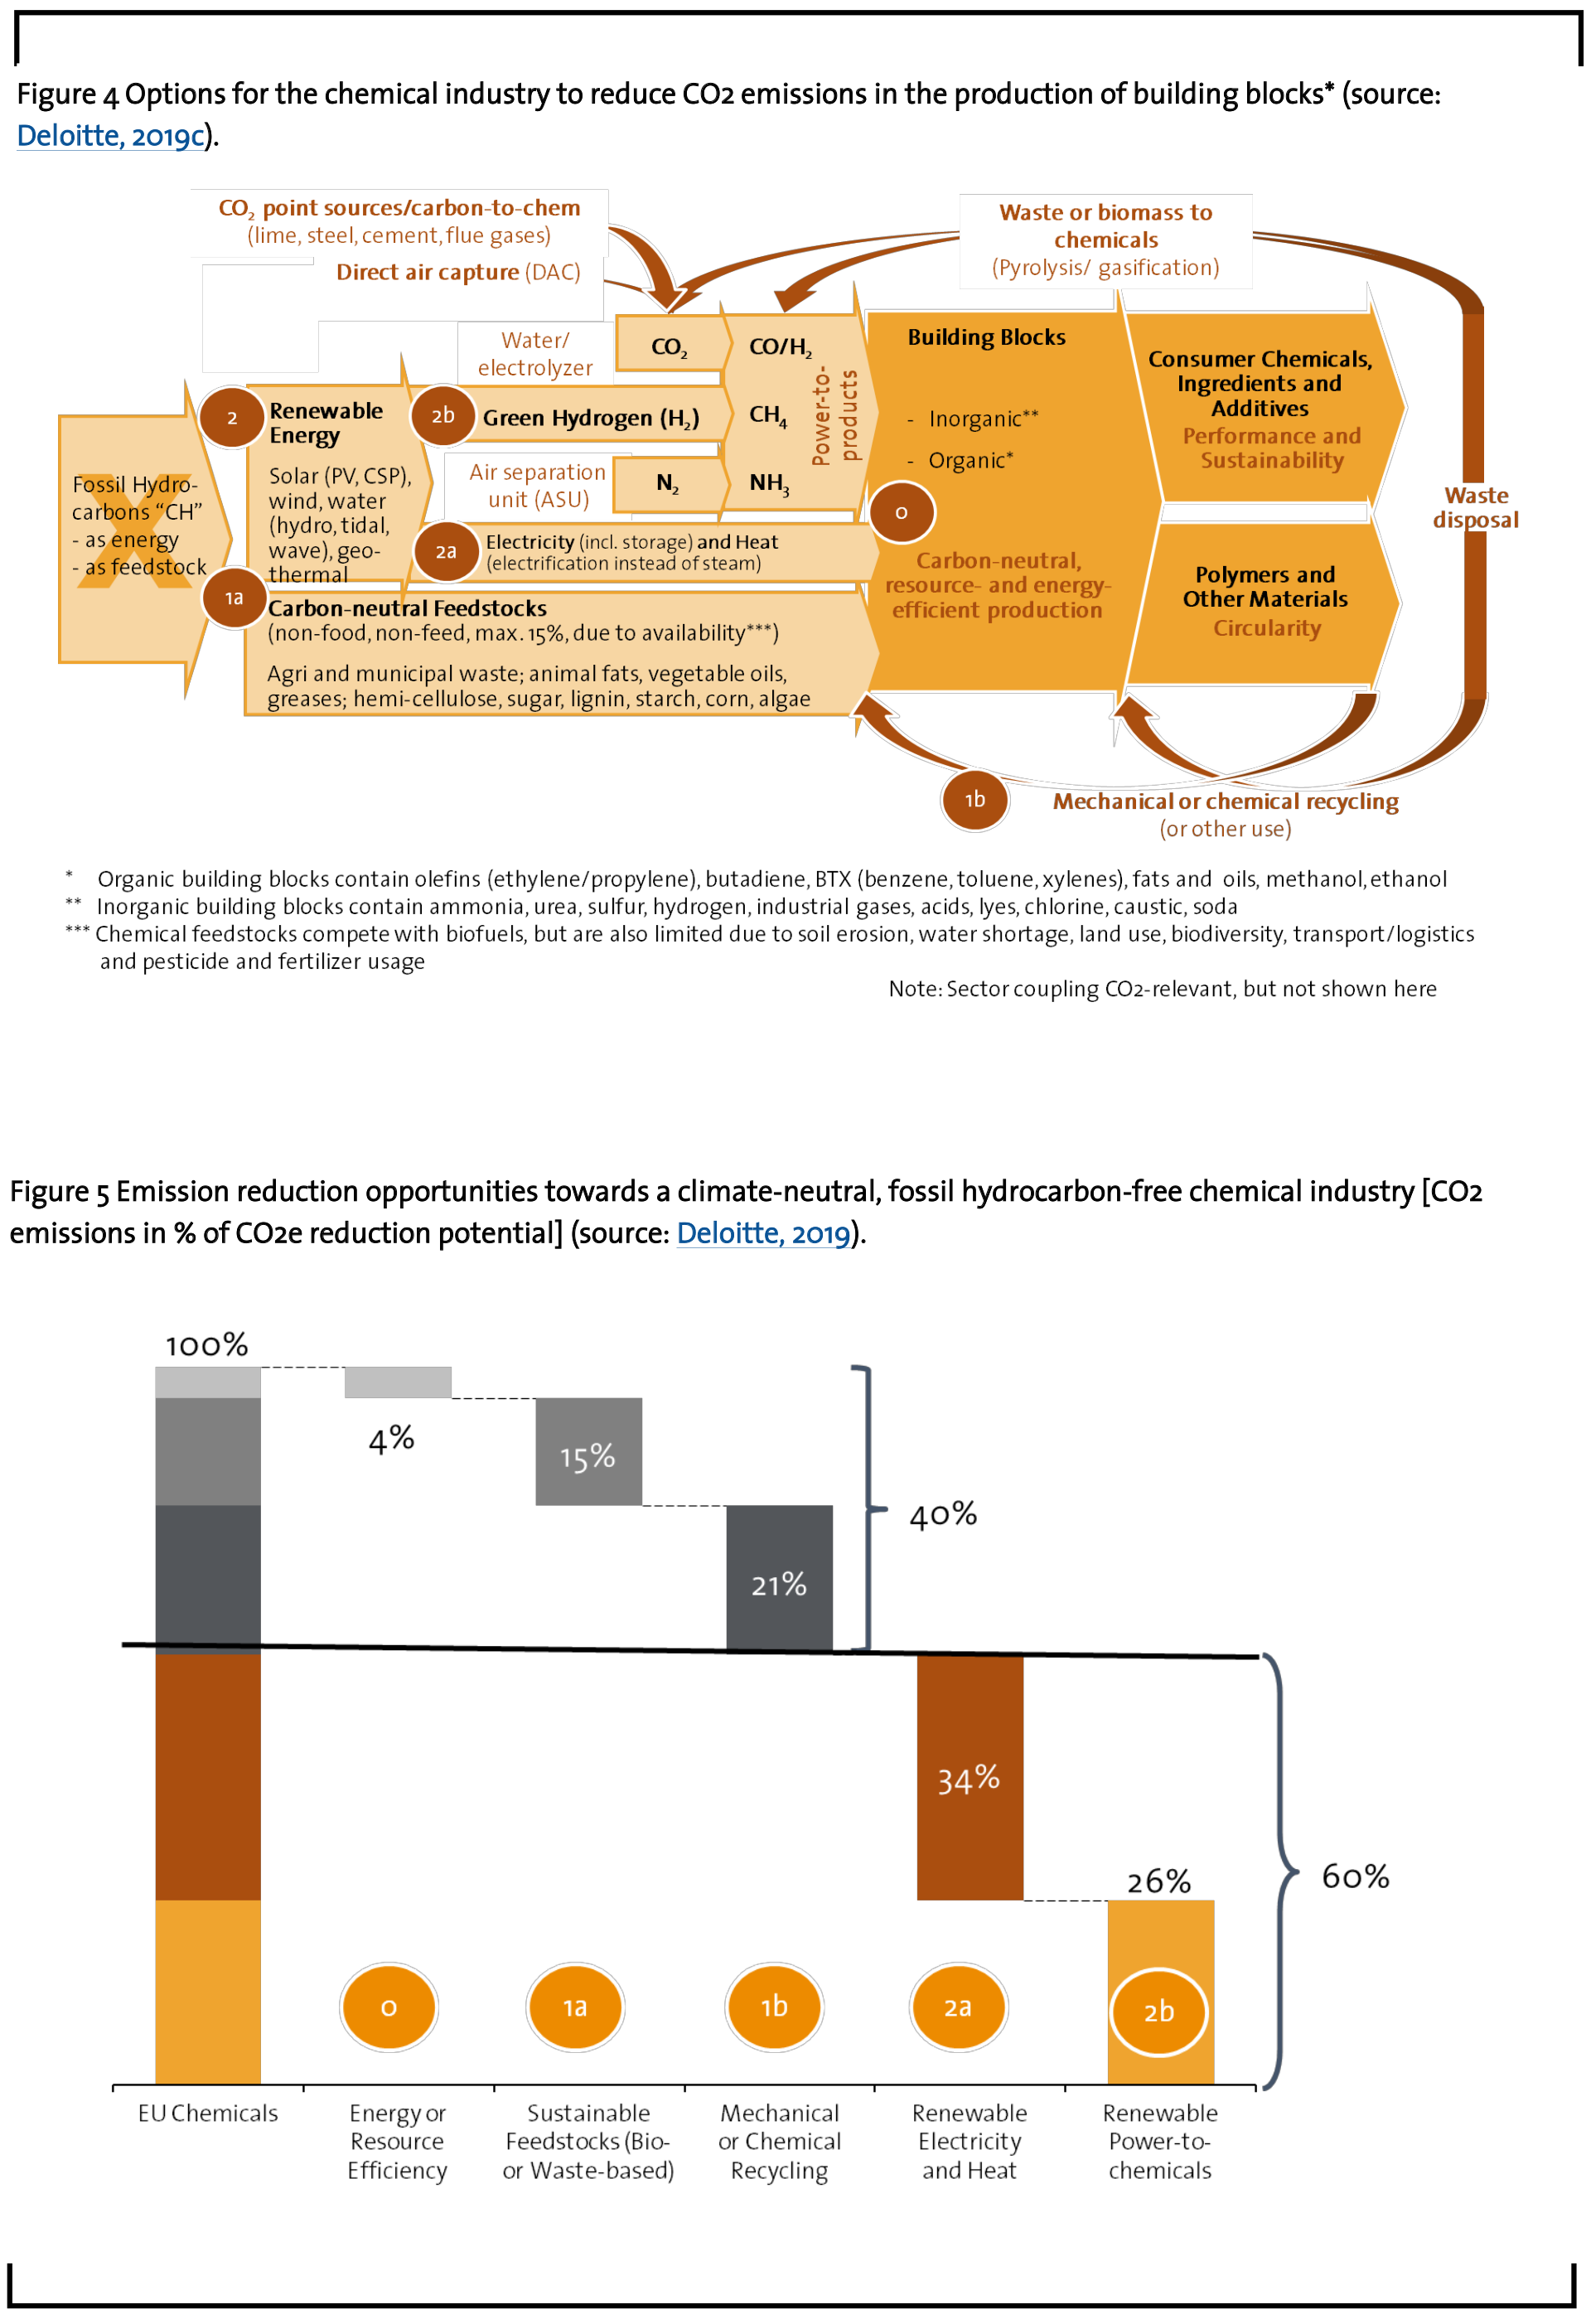
Improvement of resource and energy efficiency (Figure 4, 0) in producing chemicals and materials has always been a key activity of the industry, but further improvements are possible by using digital tools.
The net effect of energy and resource efficiency activities is about 4% (Figure 5, 0). The gross effect is potentially much larger, but digitalization leads also to a dematerialization. This means that chemicals and materials can be used much more effectively, which reduces the specific chemical or material consumption. Precision farming, personalized food or medicine or 3D/4D printing of materials are examples where up to 40% less material or chemicals are needed to fulfill the same purpose. This comes with a significant emission reduction, at least before rebound effects. However, specific efficiency gains are easily overcompensated by much higher absolute energy demand. Additionally, the reduction is taking place in the application and not the production of chemicals and materials. Thus the effect is included in a lower demand growth and is not calculated a second time as an efficiency driver and contributor to emission reduction.
A much bigger effect of up to 15% emission reduction can be expected using sustainable feed-stocks (Figure 5, 1a). Sustainable feedstocks are either waste- or bio-based and can include plant or animal fats, sugar, lignin, hemicellulose, starch, corn and algae. It is likely that sustainable feedstocks will play an increasingly important role in the production of bio-based chemicals like alcohols, organic acids and polyesters. However, the use of sustainable feedstocks is also limited due to competition with food, feed, biofuels and bioenergy applications as well as physical limits imposed by soil erosion, water shortage, land use, reduced biodiversity and the use of agrochemicals. Another limiting factor is the typically low resource and logistics efficiency. For instance, to produce 1 ton of methanol, it takes 2.5 tons of lignocellulose or 8 tons of sugar and transportation of the raw materials over long distances.
Another pathway to avoid the production of virgin materials (e.g., polymers, rubbers, fibers, catalysts, batteries, packaging materials, solvents, heat transfer fluids and lubricants) is the closure of material loops (Figure 5, 1b). This can happen through reuse, mechanical or chemical recycling or alternative uses in other applications. An additional positive effect is the avoidance of uncontrolled littering (e.g., of single-use plastics).
If circular logistics, material separation and recovery are feasible, this is often the best solution to support climate neutrality. Note that circularity does not necessarily mean producing the same product for the same application again. Often, it is more effective and efficient to make other products or use the original product in other applications, such as employing wind blades as additives for construction materials or giving lithium-ion batteries of electric vehicles a second life in stationary applications before recycling them. However, all those materials make up only a bit more than 20% of the chemical industry. Thus, the impact is also limited to that order of magnitude, even if almost all materials would be reused or recycled.
Overall, we can probably achieve 40% of the chemical industry´s long-term emission target by maximizing energy and resource efficiency (Figures 4 and 5, 0), using sustainable bio- or waste-based feedstocks (Figures 4 and 5, 1a) and running materials in circles (Figures 4 and 5, 1b) to prevent them from leaking into the environment. So far so good, but what about the remaining 60% (Figures 4 and 5, 2) of the emission reduction target?
5 Abundant and cheap renewable energies are a prerequisite for full decarbonization
Abundant and cheap renewable energy is a prerequisite (Figures 4 and 5, 2) for achieving the remaining CO2 reduction target. The cost of many renewable technologies are plummeting. Solar photovoltaics (PV) have decreased in price by 80% since 2008 (Lazard, 2019), more than wind power or other renewables. Renewable energy is already today the cheapest way to generate a unit of electricity and its advantage against fossil fuels, nuclear and other energy sources is likely to further increase in the future. Low unit cost is a good starting point, but it needs to be complemented by a secure supply also in cases when the sun does not shine and the electricity has to be transmitted from where it is generated to where it is consumed.
A total of 34% of current fossil hydrocarbonbased emissions result from energy generation (electricity and heat) (Figure 5, 2a), either by third party energy providers or within the chemical industry, and a smaller part from the transportation of feedstocks, chemicals or materials. A full substitution of fossil hydrocarbons with renewable energies like solar (PV – photovoltaic or CSP – concentrated solar power/ solar thermocycle), wind power, bioenergy, waste-toenergy, heat pumps, energy storage, hydro power (tidal, wave) or geothermal energy is needed in order to become climate neutral. Nuclear power might also fall into that category, but not in Germany, where there has been a political consensus to move away from that technology.
An electrification of transportation and chemical processes is needed. On the transport side, electrification becomes less attractive the longer the distance, the heavier the load and the faster the means of transportation. Biofuels for trucks, ships and especially planes are an alternative route towards carbon-neutral transportation. Longer-term hydrogen might serve as a direct fuel for planes. For chemical processes, electrification is technically feasible, but it becomes increasingly inefficient and energyintensive to electrify processes that operate above 400 °C or below -150 °C. Furthermore, electric heating of a gas or naphtha cracker requires about three times more energy than using natural gas, liquefied petroleum gases or naphtha. It is also much more difficult to create energetic synergies between endothermic and exothermic processes (“heat Verbund”) with electricity than with steam. Currently, chemical processes are often heated via natural gasbased cogeneration of power and heat. This is a very efficient process, but creates climaterelevant CO2 emissions.
The share of renewable energy generation in Germany, Austria and the Nordic and Baltic countries currently exceeds 38% (Bmwi, 2019), but this is not true for most of the rest of Europe and certainly not for most regions outside of Europe (Motyka 2019). Buffering renewable energy both short- and long-term, as well as distributing the energy to areas where it is really needed, are still inefficiencies that people are currently trying to overcome. Chemicals like chlorine, ammonia, hydrogen and methanol are potential chemical buffers that could be used to store abundant renewable energy.
The remaining 26% (Figure 5, 2b) of emissions is the toughest to reduce, because this requires the substitution of fossil hydrocarbonbased feedstocks with climate-neutral feedstocks that do not result from waste, biomass or circularity. The carbon part is relatively easy to solve. There are currently enough point sources of CO2 available from the lime, steel and cement industries and other flue gases. In the future, direct air capture will potentially become an option, if prices come down from the current high point of 500 €/ton of CO2. Carbon Engineering, Climeworks, Global Thermostat and other pioneers in Direct Air Capture technologies are optimistic to get costs down to 100-250 €/ton of CO2.
The primary issue is climate neutral hydrogen. Currently, hydrogen is produced from natural gas via steam reforming (48%), crude oil in refineries (30%), coal gasification (18%) and as a by-product in the production of chlorine via electrolysis of salt (4%) (GVR, 2018). Thus, 96% of hydrogen is currently made from fossil hydrocarbons (“grey hydrogen”).
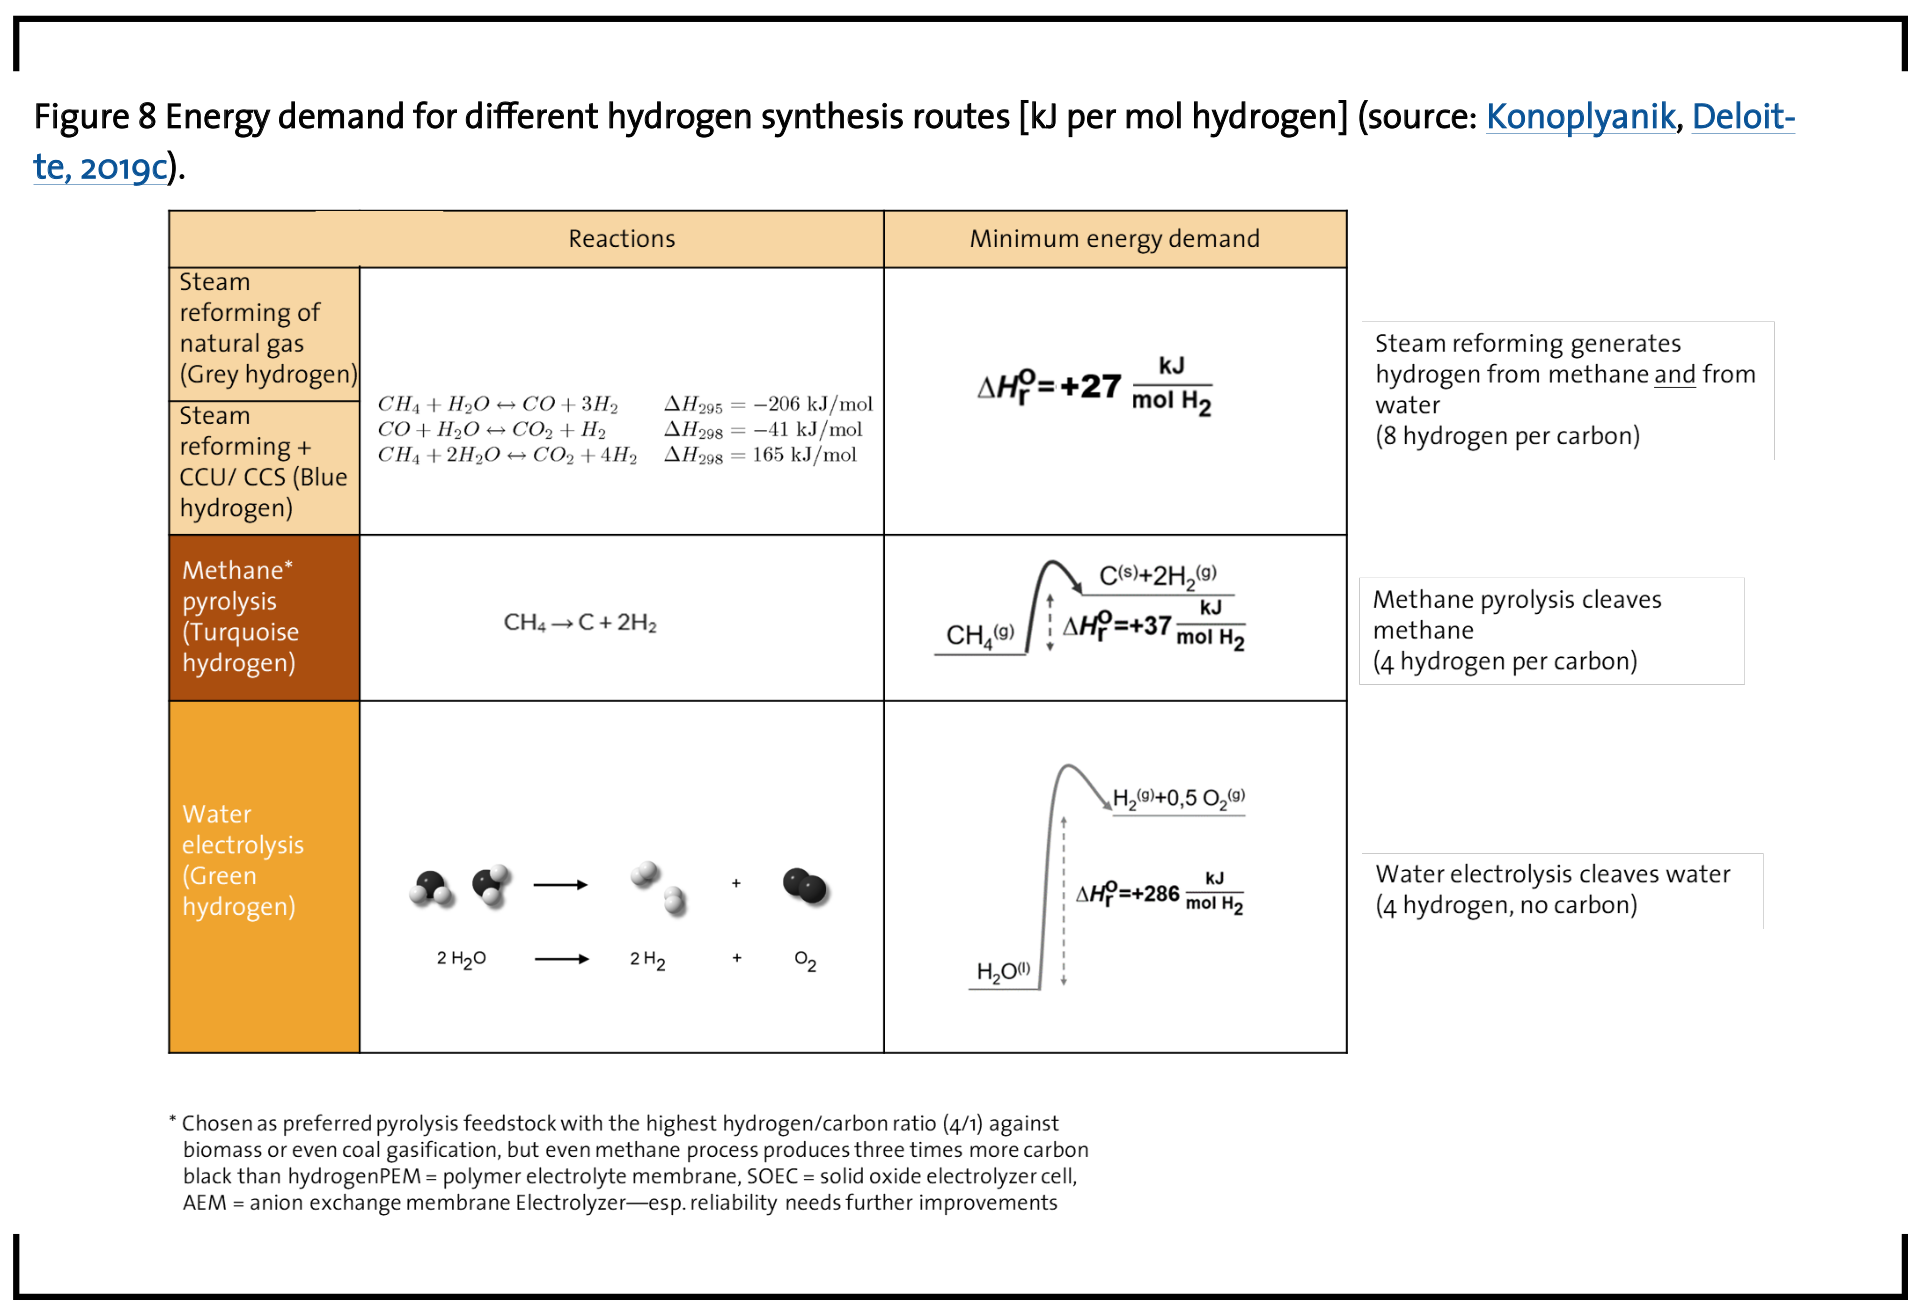
If climate neutral hydrogen was available, we could produce syngas/ methanol and ammonia and ultimately the nine key chemical building blocks (chlorine, ammonia/urea, methanol, ethylene/propylene and benzene/ toluene/xylenes) that make up more than half of the chemical industry’s overall CO2 emissions (power-to-products) (Figure 6).
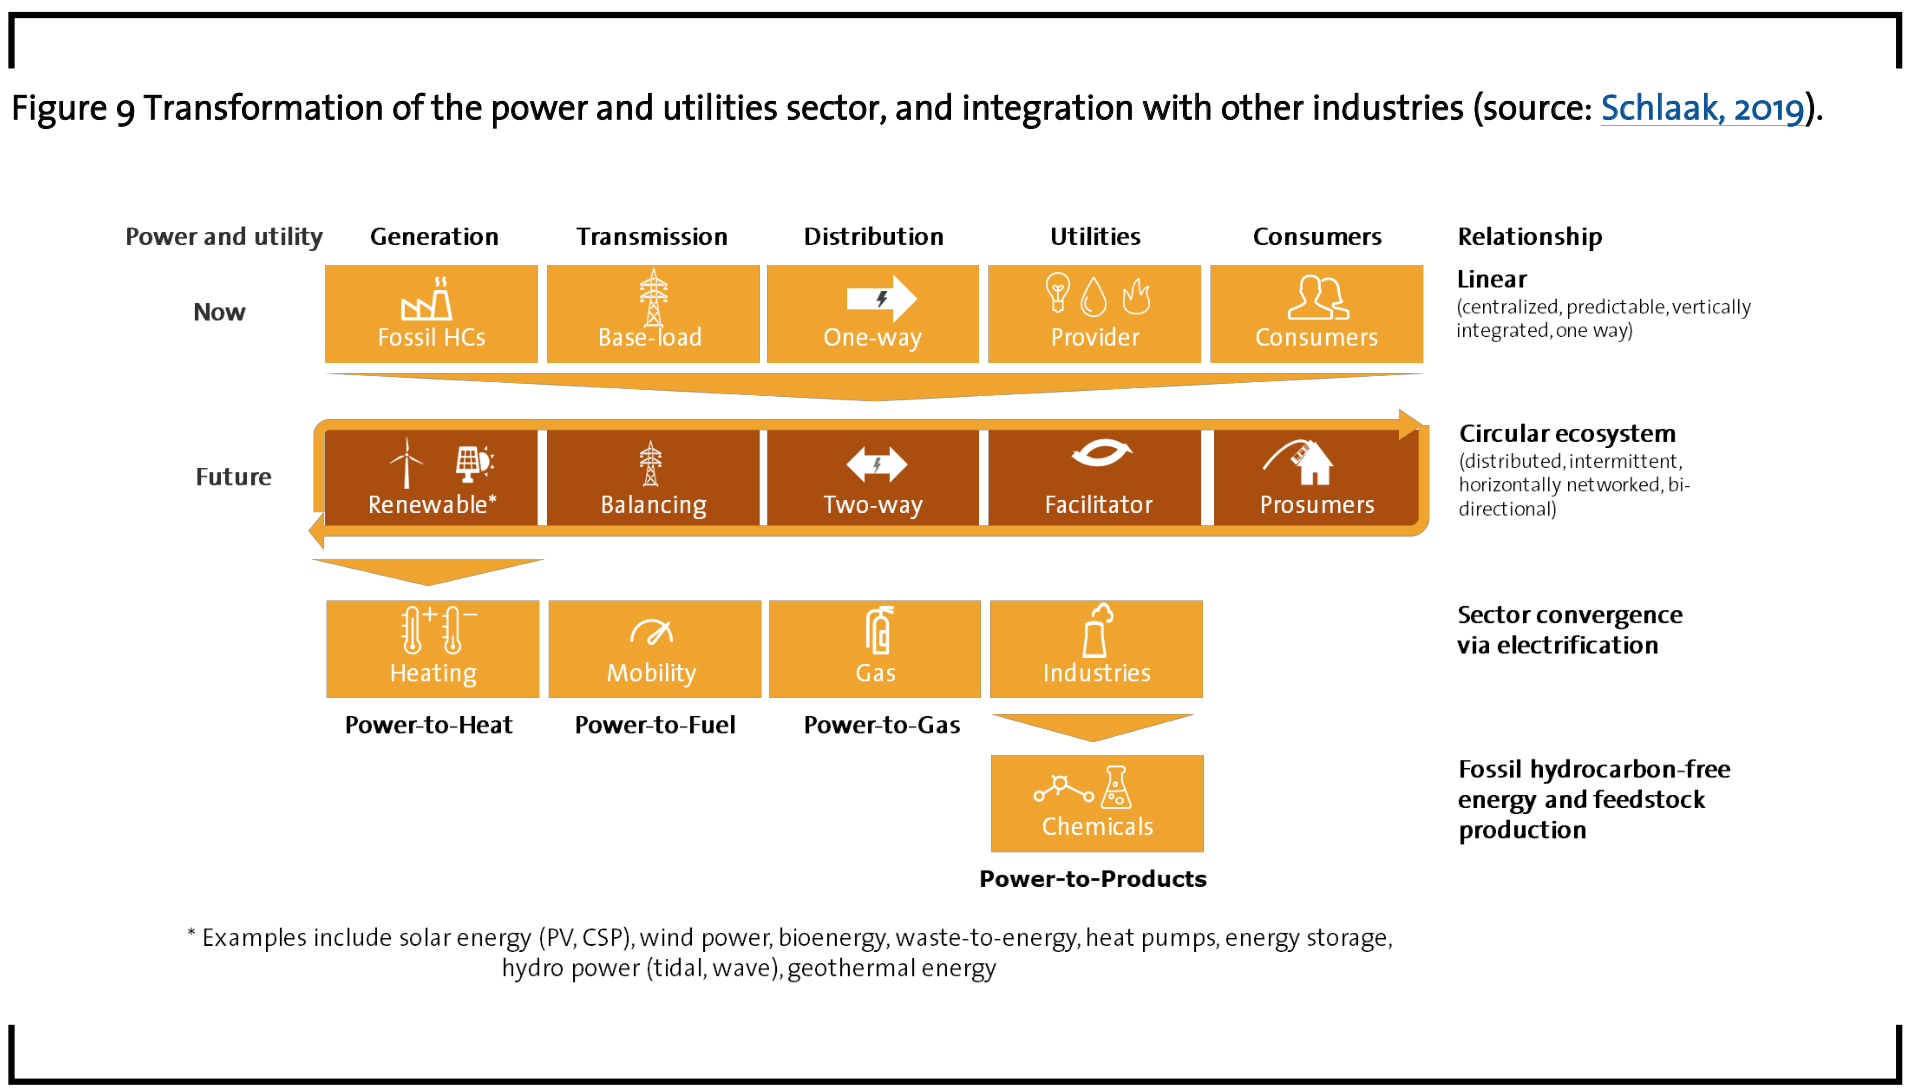
There are three major routes to climateneutral hydrogen (Figure 7): via steam reforming plus CCU/CCS („blue hydrogen“), via methane pyrolysis (or pyrolysis of other hydrocarbons or waste) – (“turquoise hydrogen”), or via water electrolysis (solar thermocycle and other experimental routes excluded) – “green hydrogen”.
Steam reforming is energetically and thermodynamically the best option to produce hydrogen. However, it generates CO2 which needs to be stored or used. This makes the whole process not really carbon neutral and there is already a lot of criticism about calling „blue hydrogen“ a climate or carbon neutral synthesis route.
The issue with methane pyrolysis is that it produces only half as much hydrogen per molecule of natural gas as the current process of steam reforming. Further, and importantly, it produces three times as much carbon black as hydrogen. What to do with all the carbon black? (BFI, 2019)
Thus, the environmentally preferred route is the electrolysis of water to produce hydrogen and oxygen. End-to-end efficiency is only around 30% currently and reliability is relatively poor, but the process is being worked on and technological progress can be expected.
Unfortunately, this environmentally preferred route towards carbon neutral hydrogen is the thermodynamically poorest pathway since more than 10 times as much energy is needed to produce hydrogen from water compared to steam reforming, where hydrogen is made from natural gas (Figure 8).
This is not surprising since water as well as air or carbon dioxide are very stable molecules with a very low energy level. However, fossil hydrocarbons already bring a high level of energy with them intrinsically. As it is about thermodynamic stability and energy differences, there is not much that technological progress could change about that thermodynamic fact. Thus, only if renewable energy is abundantly and cheaply available, the water electrolysis route towards “green hydrogen” can become economically feasible.
Currently, it is hard to imagine how to make those green routes that consume enormous amounts of renewable energy, cost competitively in comparison to existing routes. We are not looking at 10-20% cost increases, but 4-6 times the current costs of producing chemicals from fossil hydrocarbons. This also means that we would need much more renewable energy. We are talking about 60% of the current European and 100% of the German energy demand today to cover only the energy needs of the chemical industry in Europe or Germany respectively to become carbon neutral.
In the past 20 years about 253 megawatts of “green hydrogen” capacity were built globally. Wood Mackenzie projects an almost 13 times as high growth in the coming five years until 2025. We share the long-term optimism about “green hydrogen”, but currently, at the beginning of 2020, we do not see the needed return on capex logic of those investments (Wood-Mackenzie, 2019).
A good starting point for „green hydrogen“ applications are energy intense inorganics, like urea, chlorine or oxygen, before trying to make larger hydrocarbons, like aromatics, from „green hydrogen“. For the latter one should probably think about other CO2-abatement options.
Depending on the future costs for carboncapture sequestration (CCS) and utilization (CCU), it might be much more economical to apply those decarbonisation routes at the end of the life cycle rather than producing chemicals and materials from “green hydrogen”. CCS technology can reduce carbon dioxide emissions by up to 90%. This would increase hydrogen costs by about a third compared to current cost levels. Thus “grey hydrogen plus CCS” and “blue hydrogen” seem to be reasonable „bridge“ technologies mid-term, but probably not longterm, due to upscaling and supply logistics issues and the fact that they are not fully carbon free.
In the case of “green hydrogen” we are talking about the longer-term preferred route, but also multiple times the current hydrogen costs and huge energy demand. Additionally, we must evaluate whether it makes sense to use “green hydrogen” to produce chemicals and materials, or if the production of fuels or heat or storing electricity might be a better use.
The thermodynamic and cost discussion shows the social dimension and equality discussion around decarbonization. If costs of individual transportation and heating or cooling double, meat and milk prices quadruple and air plane tickets cost five to ten times as much as today, we will find ourselves in the midst of a socio-political equality discussion. The tension between those who can afford decarbonization costs and those who cannot will become much larger than the digital divide discussion about those who participate and benefit from digitalization and those who do not. This social divide will most likely spread across all societal groups and needs careful political management to avoid unrest or other unwanted side effects.
6 Cross-sector synergies and flexibilities can support renewable power-to-products
The mere substitution of fossil hydrocarbons to produce energy or feedstocks for the chemical industry is likely to stay uneconomical, even if fossil hydrocarbons are heavily taxed and if there is a high price for CO2. It will be hard to find convincing and sustainable business models for this substitution. However, renewable energy is more than a supply chain change. It is a transformation of the whole industrial sector, which opens further opportunities.
Currently, power producers first burn fossil hydrocarbons, then transmit a base load to the utility provider and ultimately to the industrial customer or consumer (Figure 9).
In the future, renewable energies will be balanced in a two-way fashion. Utilities are becoming facilitators to industrial or private prosumers. A centralized, predictable, verticallyintegrated, one-way, linear business model becomes a distributed, intermittent, horizontally-networked, bidirectional and circular ecosystem. Via the electrification and, in the case of the chemical industry, renewable power-toproducts routes, the industrial sectors from power and utilities via heating, mobility, gas and energy-intensive industries converge (Figure 10).
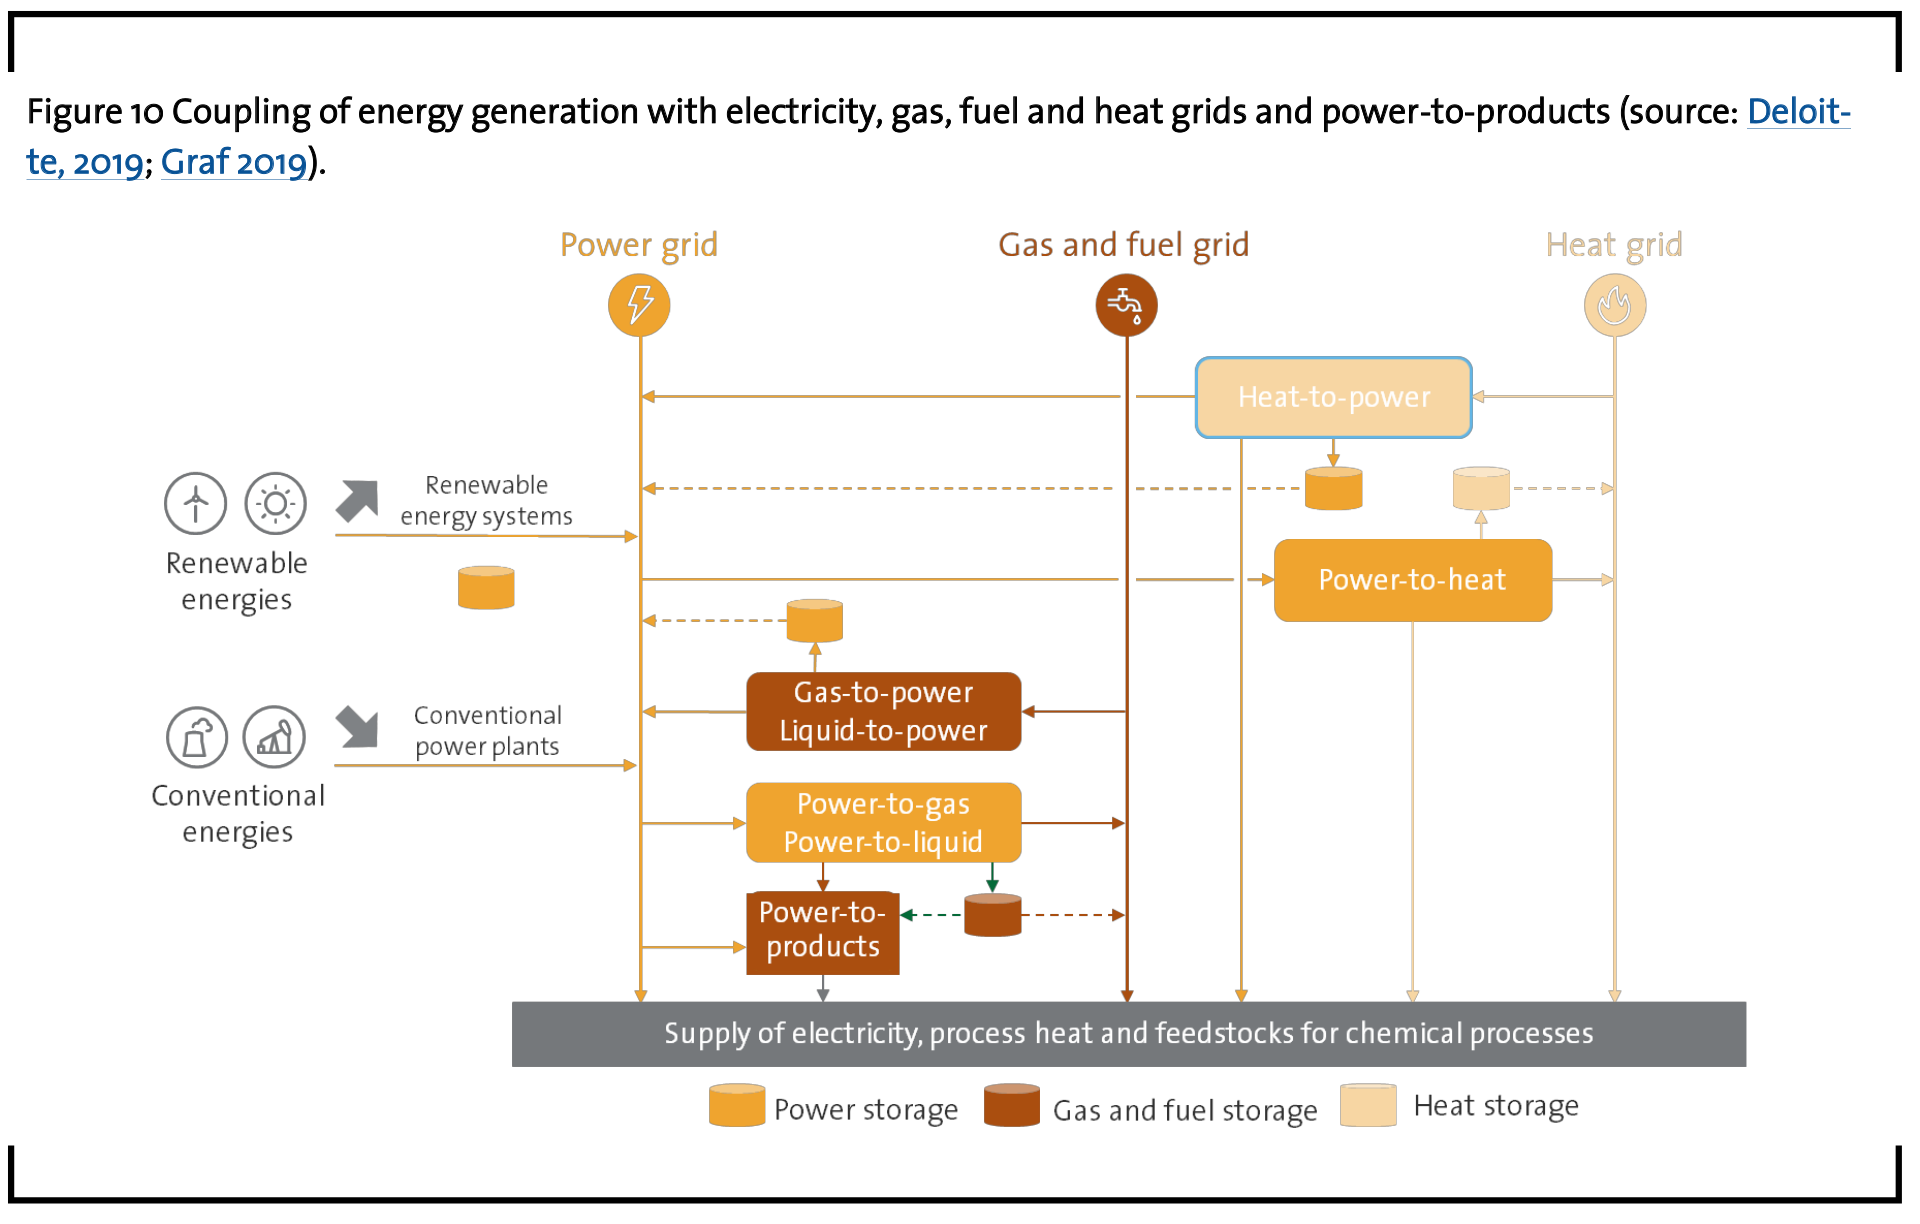
This enables cross-sector synergies and flexibilities, but also requires a multitude of renewable energy at affordable prices. The chemical industry, for instance, can help to buffer, store and optimize the fluctuating renewable electricity supply and demand by adjusting production levels in real time and/or using less power for the same production volumes and thermic or chemical storage. Optimizing this circular ecosystem by coupling the electricity, gas, fuel, heat and chemical grid can optimize production and reduce investment needs.
7 Control reserve market participation, interruptible loads and redispatch
The increasing share of renewable energies will lead to an increasing volatility of energy generation, which will be increasingly difficult to match with a fluctuating energy demand. Here, network operators need the support of other sectors to buffer, capture peak loads and avoid shortages. The chemical industry is the biggest single energy user and is earmarked to be a natural partner for the energy and utility sector. The starting point could be the supply of control reserve by transmission system operators (TSOs) to balance power fluctuations. Primary control reserve has to be available within 30 seconds, secondary control reserve within five minutes and minute reserves within 15 minutes (SMARD, 2019). This can be either positive (more supply, less demand) or negative (less supply, more demand) control reserve. Traditionally, this has been done by power plants. However, since July 2018, the minimum performance for secondary control reserve and minute reserve was reduced to 1 MW (megawatt), which allows energy-intensive industries to participate in the control reserve market, whether individually or pooled together with other participants. Like power plants, they are reimbursed for their readiness (capacity price) as well as for their contribution (energy price). From January to October 2019, 3.6 GW (gigawatt) of secondary control reserve and 2.4 GW of minute reserve power have been available in Germany, of which 2% and 8%, respectively, were actually retrieved (SMARD, 2019).
Fluctuating auction prices, available infrastructure and the type of chemical process determine on a case-by-case basis if participation in those control reserve markets is financially attractive or not. With increasing subsidies of up to 55% capex for climate-friendly investments and other direct and indirect support for energy efficiency and carbon neutrality, more and more co-investments are becoming economically attractive. Chlorine and hydrogen through electrolysis, air separation and industrial heat pumps/ thermal storage are products under investigation and pilot realization.
As an alternative to participating in the control reserve markets, the chemical industry can also participate directly in the grid by integrating large, energy-intensive assets (electrolysis, air separation, large heat pumps, cogeneration plants, etc.). Since 2017, market entry barriers for industrial power users have been lowered to a minimum supply performance of 5 MW (Kratzsch, 2018). Currently, 750 MW of immediately interruptible loads ‘off’ (automatically frequency-controlled within 350 minutes) and an equal volume of quickly interruptible loads ‘off’ (remotely controlled within 15 minutes) are tendered each week, but only 57% of the immediately and 98% of the quickly interruptible loads are being served.
Due to this unserved demand, capacity and energy prices have been 500 €/MW and 400 €/ MW respectively. Interruptible loads are thus an interesting playing field for the chemical industry. As with the control reserve market, players need to be prequalified by TSOs. This is typically free of charge, but takes two to three months and internal efforts, like organization, planning and providing the necessary control and reporting technology.
The opposite interruptible loads ‘on’ are another area for feeding collaboration. In the first quarter of 2019, 3.3 TWH (terawatt hours) of power from EEG (Gesetz für den Vorrang Erneuerbarer Energien) and cogeneration plants had to be abolished in order to prevent bottlenecks in the distribution and transmission network. This primarily affected wind parks (77% on-shore, 22% off-shore). Their power supply control rate was 7% for on-shore and 11% for off-shore wind parks. The forced shutdown of EEG plants led to 364 € million in compensation payments to the operators. This loss of electricity production could also have been used to contribute to decarbonization and climate targets. 3.3 TWH of power could have produced 870 million Nm3 of “green hydrogen” via high-temperature electrolysis.
This back-of-the-envelope calculation shows the potential for decarbonization. Instead of shutting down renewable power generation or over-investing in network bottlenecks, excess energy can be used to produce heat via cogeneration (power-to-heat) or “green hydrogen” (power-to-gas, potentially to-liquids or toproducts).
The energy industry act (Energiewirtschaftsgesetz, EnWG § 13 Abs. 1 No. 2 EnWG and Ordinance on flexible loads, AbLaV) provides an existing regulatory and legal framework for flexible loads contracts between transmission network operators and chemical companies. Although the 2016 amendments (EnWG § 13 Abs. 6a) focus explicitly on power cogeneration technology, other technologies are not excluded.
Redispatching is another bottleneck activity of transmission operators, where power plants before the bottleneck have to reduce and those behind the bottleneck have to increase their power. This primarily affects hard coal power plants. In the first quarter of 2019, this equaled 5 TWH, with redispatch costs of almost 110 € million. Although here we do not ‘lose’ renewable energy, we generate high network costs, which are avoidable through intelligent sector coupling.
8 Decarbonization strategy
Why do chemical companies need to have a decarbonization strategy? It is essential for them to understand the climate risk embedded in their operations in terms of physical risk (extreme weather events, low or high water levels, etc.), regulatory risk (new legislation, license to operate, etc.) and transitional risk (portfolio changes, market trends, etc.). In parallel there is an increasing pressure from shareholders and other stakeholders to become more transparent on the climate risks and opportunities companies are facing. There are currently no generally accepted accounting standards on decarbonization and climate change. Michael Bloomberg´s Task Force on Climate-Related Financial Disclosures (TCFD) is one attempt among others to establish those standards. Chemical associations and large chemical companies are currently trying to define and agree upon those standards.
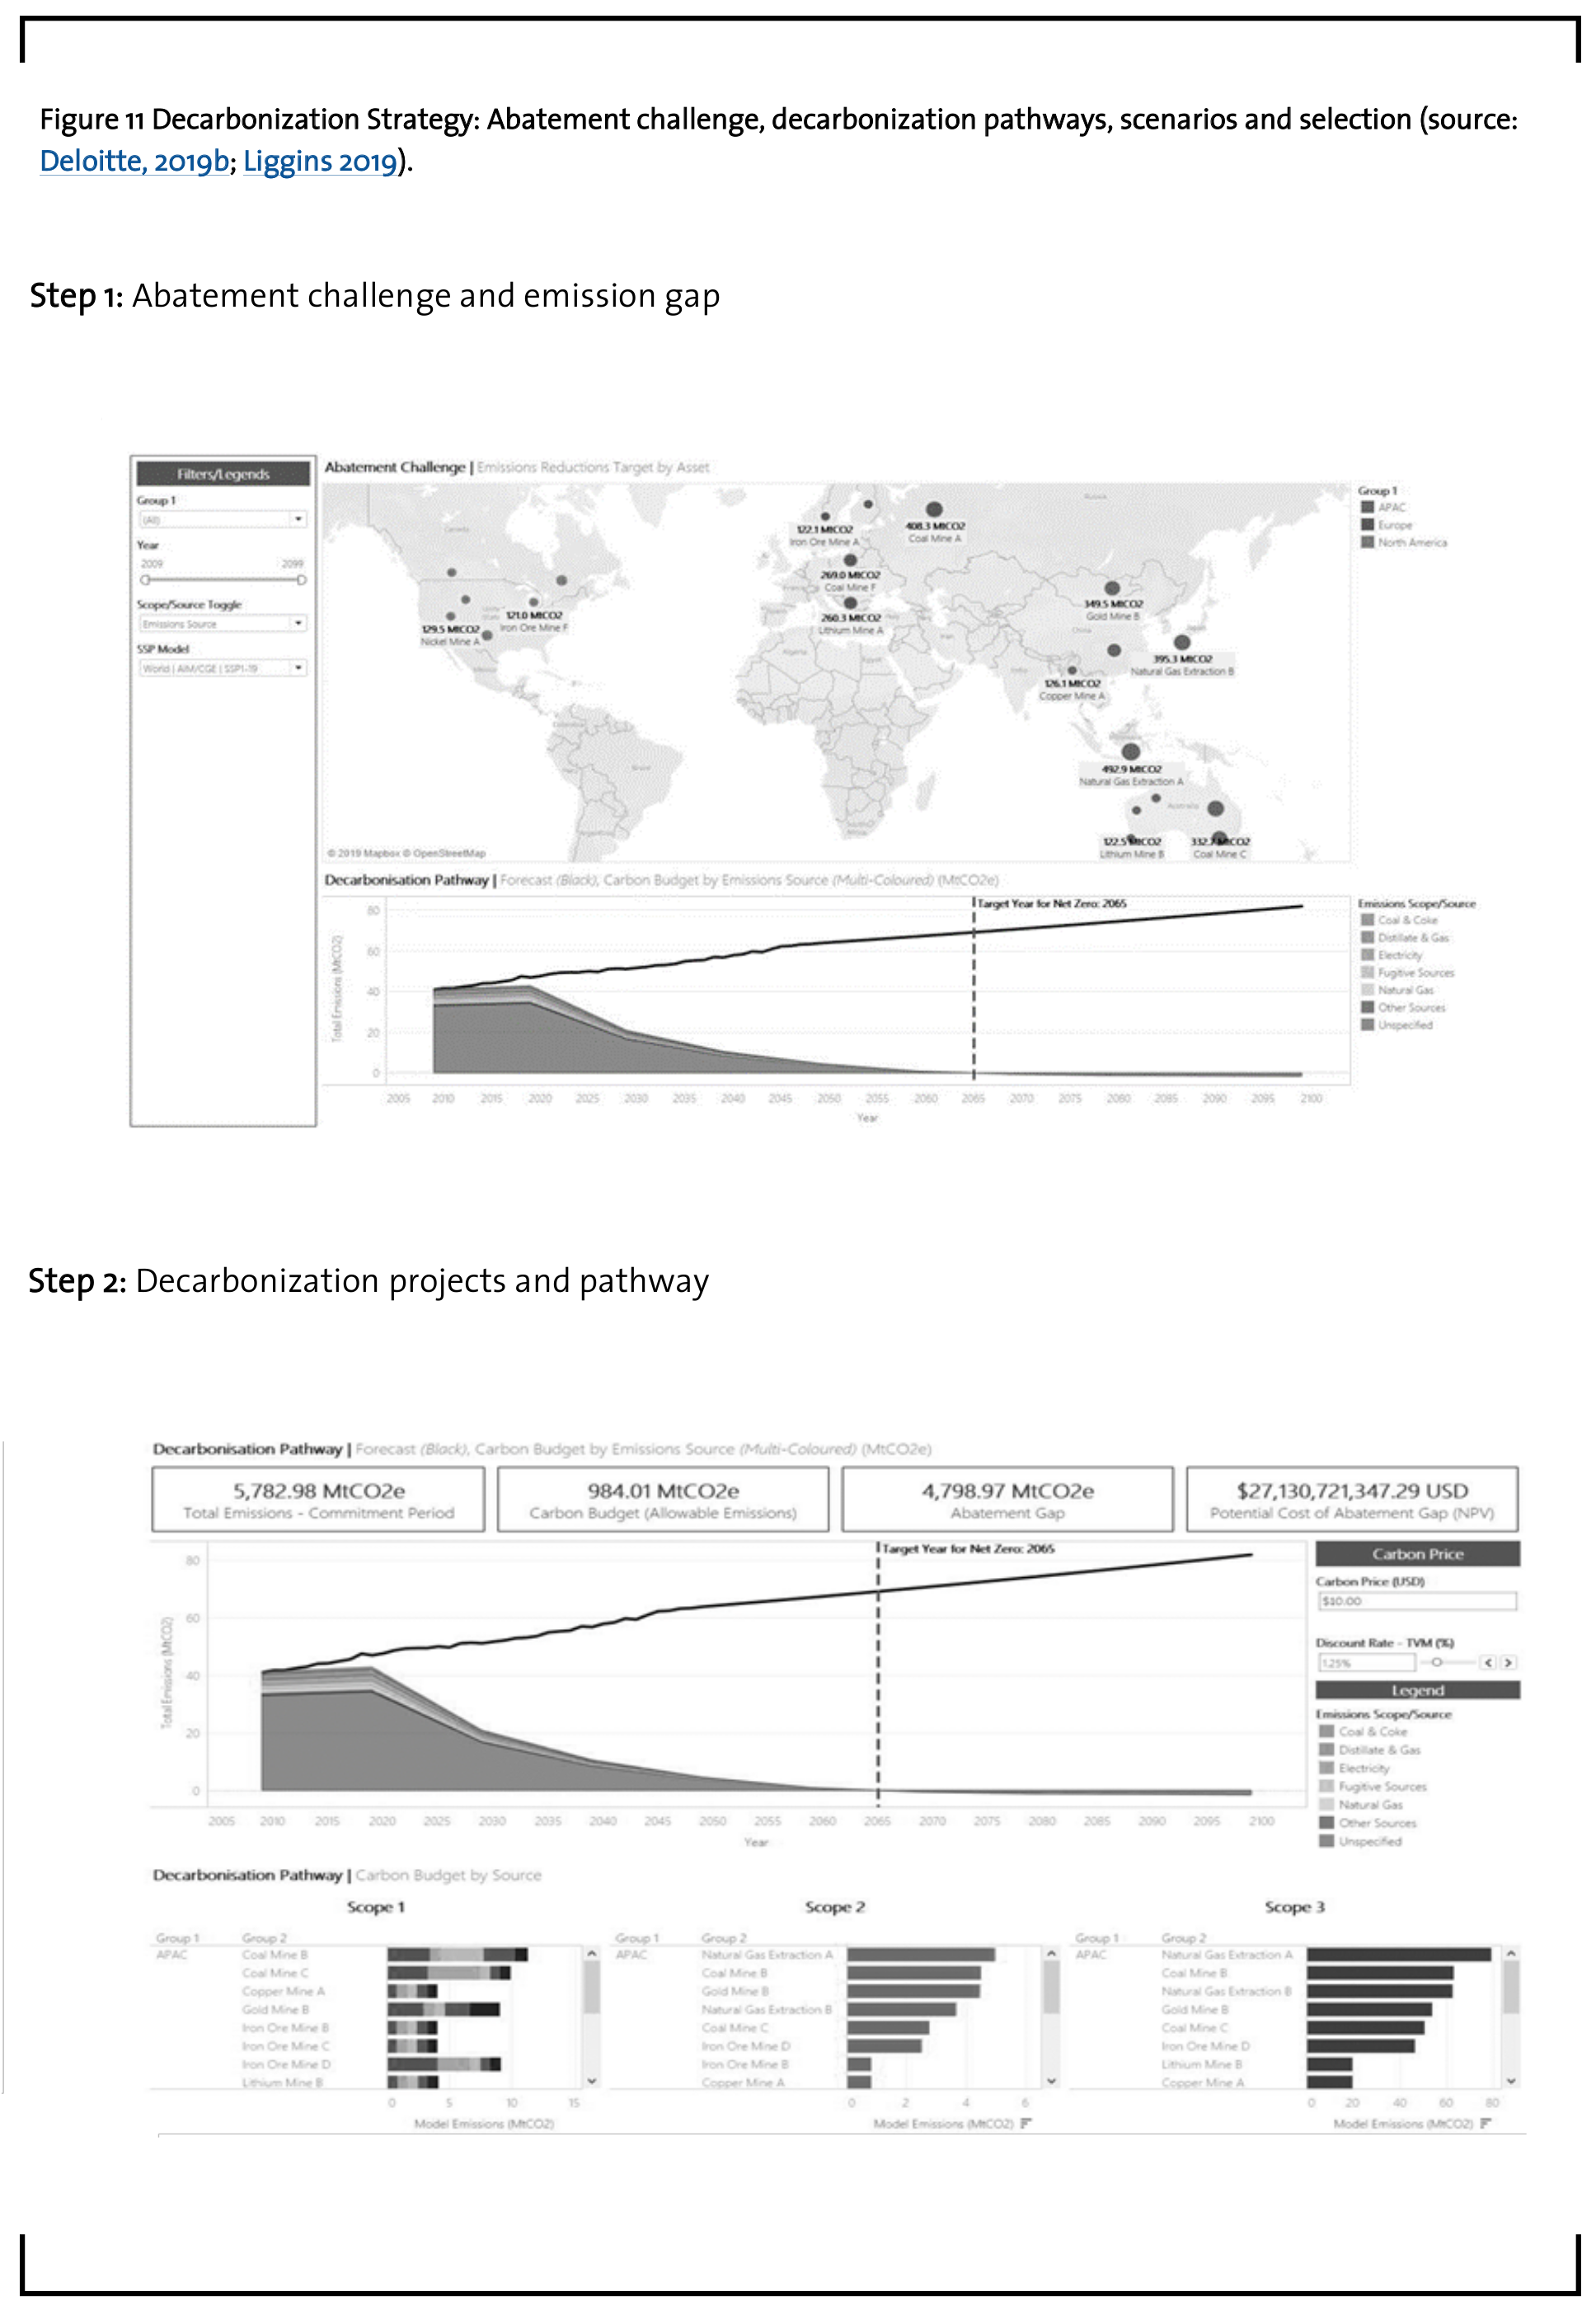
But companies should not wait for those standards. Until they exist and are agreed upon companies should leverage scientific information from leading bodies and methodologies, including the Intergovernmental Panel on Climate Change (IPCC), Representative Concentration Pathways (RCP), the International Institute for Applied Systems Analysis (IIASA), Shared Socioeconomic Pathways (SSP) and Science Based Targets (SBT) methodologies among others (Figure 11).
It is important to include at least the suppliers and customers, but ultimately we are looking at the decarbonization of the whole supply chain. This becomes a very interesting area, as not only energy and chemical sectors are converging, but there is also a new view to select and support decarbonization projects along the whole supply chain to ensure that they are meeting market demand. A project at a downstream user or a supplier of the chemical industry might have a much larger decarbonization impact per Euro invested than a project at the value step of the chemical production. This involves a new collaboration along the supply chain with suppliers, partners and customers. The chemical industry knows how to play and perform in „Verbund“ structures and has a crucial role in this supply chain perspective, as it is the linking pin between the natural resources and energy industries on the one hand side and connecting them with 96% of the downstream industries and users on the demand end, which cover almost all sectors one can think of.
A decarbonization strategy and net zero emission plan can be developed in four steps:
Step 1: Understand the abatement challenge in the value chain and quantify your emission gap
- Understand climate risk under a range of future scenarios, how markets, revenues, profits and the asset values could be impacted.
- Define your current greenhouse gas/ carbon dioxide emission footprint, including external material and energy suppliers and transportation of chemicals and materials per product/ product group and asset/ site/ region.
- Understand the carbon footprint challenge of your customers and the role of your chemicals or materials relative to alternative applications customers might have for all major product applications. This includes also potential new applications and customers.
- Review the specific product/ sector value chain to identify upstream or downstream linkages and abatement challenges. Evaluate players/ competitors, their likely strategies and corresponding opportunities and threats for your products and company.
- Quantify the abatement gap for the next 30 years, primarily for your individual position, but also with a view on your suppliers and customers as well as the relevant product group/ sector as a whole.
Step 2: Identify and prioritize decarbonization projects and pathway (“base case”)
- Reference IPCC scenarios and consider a range of abatement pathways for your company and the potential costs, liabilities and opportunities inherent in each.
- Undertake thorough technical and commercial analysis of potential decarbonization pathways. Be as concrete and tangible as possible per project, which could be an asset/ site/ region or product/ product group.
- Carry out financial modelling to identify and prioritize profitable business opportunities. Quantify the impact of abatement projects and determine least cost projects.
- Use actual prices and costs, especially for fossil hydrocarbons, energy and carbon dioxide.
- Summarize all ranked projects into best return of capital employed abatement pathway (“realistic scenario” or “base case”).
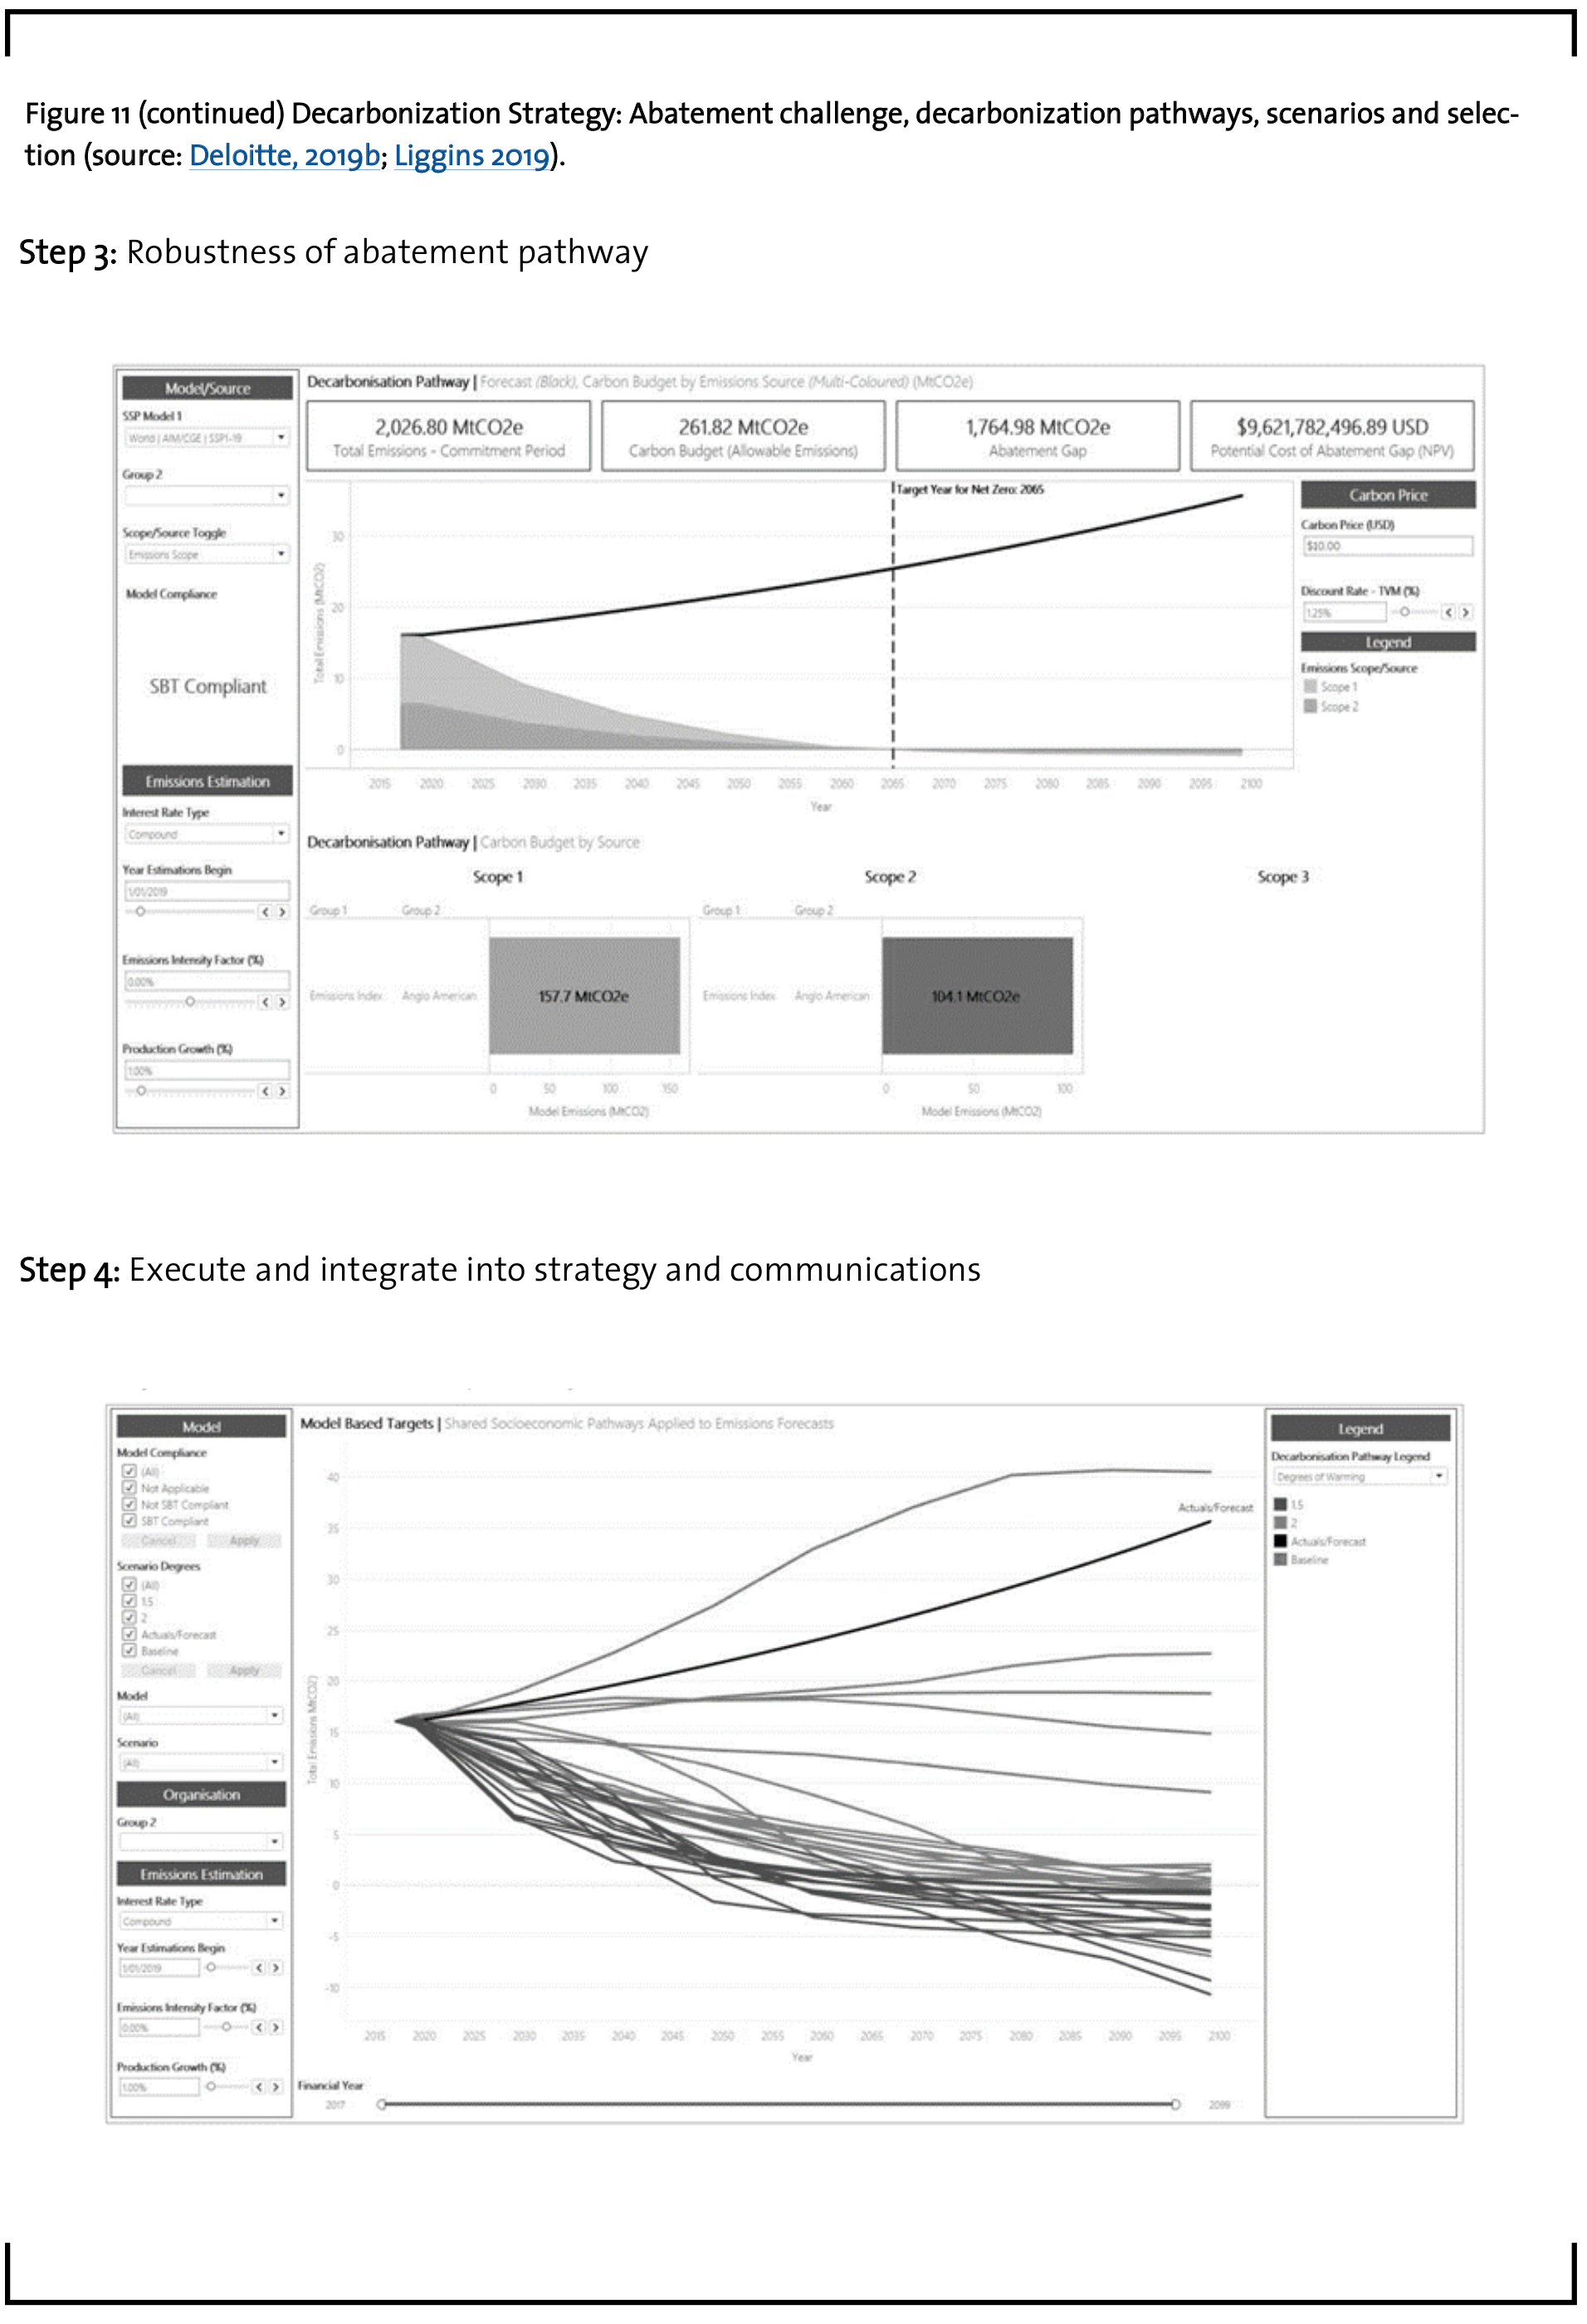
Step 3: Identify and quantify opportunities and risks to define robustness of abatement pathway
- Quantify the abatement challenge and financial impacts with an agreed pathway and define short- and long-term abatement emission targets.
- Define possible future scenarios for fossil hydrocarbon, energy, product and CO2-prices and combine in optimistic and pessimistic scenarios.
- Evaluate potential future regulatory or political actions (per country/ region or product/ product group and assumed timing) and calculate impact on emission pathways, financial model and potentially license to operate.
- Explore opportunities to obtain funding and include into optimistic scenario.
- Calculate sensitivities and determine overall robustness of abatement strategy. Define “no regret” activities, which are valid and recommended in all scenarios.
- Summarize in actionable and communicable Decarbonization Strategy, including portfolio risks, abatement delivery schedule and financial exposure.
Step 4: Execute and integrate decarbonization into strategy and communications
- Develop least cost abatement projects in order to achieve emission targets and maximum competitive differentiation.
- Define decarbonization communications strategy towards all stakeholders.
- Integrate decarbonization projects and pathway into overall corporate strategy and business/ regional strategies.
- Define responsible decarbonization project managers and overall leader, including program management office.
- Define milestones for activities, set quantitative abatement targets and restrict financial exposure.
Chemical companies need to understand that climate risk has the potential to have a material impact on finances. Whilst this is obvious if you happen to work in an emissionsintensive sector, all sectors of the economy will be impacted over the next few years. It will be critical to understand how these risks could play out for your company and how they can best be mitigated. At the same time, significant opportunities provide material upside for those who act. Decarbonization will have financial impacts across the economy and only the informed decision makers will be able to successfully navigate their companies through the risks and realize the significant opportunities.
9 Summary
Energy and resource efficiency activities, mechanical and chemical recycling and renewable bio- or waste-based feedstocks can contribute to about 40% of the decarbonization target of the chemical industry. The remaining 60% must come from the use of renewable energy and power-to-X technologies if we want to avoid CCS/CCU as much as possible.
Power-to-heat and power-to-gas (including to-liquids and to-products) require close sectoral cooperation. The existing opportunities of control power markets as well as switchable loads (on and off) need to be utilized by the chemical industry. At the same time, chemical processes should be electrified. This is only possible if renewable energy is reliably available at affordable costs. Much more renewable energy is needed at much lower costs. Governments, regulators and energy players have to provide an attractive playing field to attract more carbon neutral investments and improve both the planet and their prospects for the future. Chemical companies should develop decarbonization strategies in four steps:
- Evaluate the abatement challenge and quantify the emission gap
- Identify decarbonization projects and summarize in an abatement pathway
- Test the robustness of the abatement pathway and define no-regret actions
- Execute all “no-regret” projects and integrate into strategy and communications
References
Amara, R. C.; Institute for the Future, SRI (1978); „Amara´s Law“
Bazzanella, A. M. Dr.; Ausfelder, F. Dr.; Gesellschaft für Chemische Technik und Biotechnologie e.V., DECHEMA (2017): Low carbon energy and feedstock for the European chemical industry, Frankfurt.
BFI (2019): VDEh-Betriebsforschungsinstitut GmbH, Me2H2-Methane pyrolysis.
Bmwi (2019): Erneuerbare Energien .
BP (2019): Energy Outlook and BP Statistical Review of World Energy.
Bundesregierung (2019): Eckpunkte für das Klimaschutzprogramm 2030 der Bundesregierung zur Umsetzung des Klimaschutzplans 2050. Fassung nach Klimakabinett 10/2019, Berlin.
CEFIC (2019): Sustainable Process Industrie through Resource and Energy Efficiency, SPIRE 2050 vision towards the next generation of European process industries.
CEFIC (2020): Cefic Facts and Figures 2020, covering chemical industry growth from 2008-2018.
CNPC Economics and Technology Research Institute (2018): Energy Outlook 2050 .
Conference of the Parties (COP 21), United Nations Framework Convention on Climate Change (UNFCCC) (2015): Paris agreement on 12 December 2015 to keep a global temperature rise in this century well below 2 degrees Celsius above preindustrial levels and to pursue efforts to limit the temperature increase even further to 1.5 degrees Celsius.
Conference of the Parties (COP 25), United Nations Framework Convention on Climate Change (UNFCCC) (2019): Almost 27,000 delegates aimed at finalizing the “rulebook” for carbon markets and other forms of international cooperation under Article 6 of the COP21 Paris agreement. Ultimately, however, the talks were unable to reach consensus in many areas.
Deloitte (2019a): Future of Energy , A summary of energy supply 2018 (IEA, WEO and Statista) and data from ten publications by British Petroleum (BP), Chevron, Energy Information Administration (EIA), Det Norske Veritas (DNV GL), Equinor, ExxonMobil (XOM), International Energy Agency (IEAs World Energy Outlook (WEO); both New Policies Scenario – NPS and Sustainable Development Scenario – SDS), McKinsey and Shell.
Deloitte (2019b): CO2– and Greenhouse Gas emission models and Decarbonization Solutions , including abatement portfolio management, decarbonization scenarios, pathways and abatement impact analyses. Deloitte (2019c): Future of Fossil Hydrocarbons , Presentation of W. Falter at CEFIC annual conference, October 24, 2019.
Dickson, D.; Slaughter, A.; Mittal, A.;Deloitte Insights (2019): One Downstream – Strategic imperatives for the evolving refining and chemical sectors, Deloitte Insights .
Equinor (2018): Energy Perspectives 2018 – Long-term macro and market outlook .
EU (2019): “The European Green Deal ”, Brussels, December 11, 2019, COM(2019) 640final.
ExxonMobil (2018): 2018 Outlook for Energy: A view to 2040.
Graf, B.; Deloitte US (2019): Policy, industry trends and accounting in power and utilities, Washington D.C.
GVR, Grand View Research (2018): Hydrogen Generation Market Report , 2018-2015, June 2018
Günther, J.; Lehmann, H.; Nuss, P.; Purr, K. (2019): RESCUE – Wege in eine ressourcenschonende Treibhausgasneutralität 11/2019, UBA, Dessau-Roßlau.
IHS Markit (2018): Rivalry – IHS Market view of the energy future 2018-2050.
IHS Markit (2019): Crude Oil-to-Chemicals (COTC), A look inside our technology and economic analyses from the 2019-2014 Process and Economics Program (PEP).
Institute of Energy Economics Japan, IEEJ (2018): Outlook 2019 – Energy transition and a thorny path for 3E challenges, Tokyo.
International Energy Agency, IEA (2018): New Policies Scenario, World Energy Outlook, Paris
International Energy Agency, IEA (2018): Energy Balances of OECD and Non-OECD Countries , Paris
International Energy Agency, IEA – World Energy Outlook (WEO) and Statista (2019): Summary of world energy supply in billion tons of Oil Equivalent (BTOE) in 2018.
International Institute for Applied Systems Analysis, IIASA (2019): IAMC 1.5oC Scenario Explorer.
Intergovernmental Panel on Climate Change, IPCC (2006): Default factors and values Volume 2, Chapter 1 (Tables 1.2 and 1.3) and Volume 3, Chapter 3.
Jacob, K. (2019): Heißzeit, Bild der Wissenschaft , p. 14-21.
Konoplyanik, A., Prof. (2019): Energy Transition Forum IENE/ECE, Vienna.
Kratzsch, U., Dr. (2018): Bundesnetzagentur, Beschlusskammer 6, 10. Göttinger Energietatung.
Kyoto Protocol (1997): International treaty which extends the 1992 UNFCCC that commits 192 state parties to reduce greenhouse gas emissions, adopted in Kyoto, Japan, on 11 December 1997 and entered into force on 16 February 2005.
Lauf, T. Dr.; Memmler, M.; Schneider, S. (2019): Emissionsbilanz erneuerbarer Energien, UBA , Dessau-Roßlau.
Lazard (2019): Lazard´s Levelized Cost of Energy Analysis, version 13.0, Lazard.
Liggins, P.; O´Brien, J.; Padisetti, Kumar; Deloitte Australia (2019): Decarbonising Australia ´s gas distribution networks, Perth.
Motyka, M.; Sanborn, S.; Sullivan, K.; Nagdeo, J.; Deloitte US (2019): Moving organizational energy use toward 100 percent renewables – aspiration or destination? Parsippany.
Organization of the Petroleum Exporting Countries, OPEC (2018): World Oil Outlook
Schlaak, T.; Franke, H.; Brod, K. (2018): Power Market Study 2030 – A new outlook for the energy industry, Hamburg.
Simon, F.; Eurativ (2019): Industrial Transformation 2050, Pathways to Net-Zero Emissions from EU Heavy Industry, Material Economics .
University of Cambridge Institute for Sustainability Leadership, CISL, Stockholm.
Shell (2019): Energy Transition report; new Sky Scenario, Pathways to decarbonisation .
SMARD, Strommarktdaten; Bundesnetzagentur (2019): Stromhandel im September und Oktober, Exportüberschuss im Herbst, Bonn.
Statista (2019): Greenhouse gas and CO2-emissions by sectors and countries .
Stoy, E. (2019): EU sets target for its economy to be climate neutral by 2050 .
Sullivan, K.; Deloitte US (2019): Environments, Sustainability and Governance (ESG) in Power and Utilities , Washington D.C..
UBA, Arbeitsgruppe IK III1 (2019): Klimaschutzplan 2050 und Sektorziele.
United Nations, UN (2017): World Population Prospects: The 2017 Revision , New York.
UNFCC (2015): Paris Agreement .
Verband der Chemischen Industrie, VCI (2019a): VCI-Position zur Debatte um CO2-Bepreisungssysteme und die Erreichung nationaler Klimaschutzziele .
Verband der Chemischen Industrie, VCI (2019b): Chemie-Barometer and World Chemistry Report .
Verband der Chemischen Industrie, VCI; Gesellschaft für Chemische Technik und Biotechnologie, DECHEMA; FutureCamp (2019c): Roadmap Chemie 2050, Auf dem Weg zu einer treibhausneutralen chemischen Industrie in Deutschland.
Verband der Chemischen Industrie, VCI (2019d): Presseinformation vom 16. Dezember 2019: Die Warnlampe blinkt rot. „Mit der Anhebung des CO2-Preises von 10 auf 25 Euro blinkt die Warnlampe für die Warnlampe für die Wettbewerbsfähigkeit des Mittelstandes in der chemischen Industrie nicht mehr gelb, sondern rot. Die Politik darf Unternehmen, die im internationalen Wettbewerb stehen, nicht im Regen stehen lassen“.
Vrije Universiteit Brussel (VUB) – Institute for European Studies (IES) (2019): Real World CO2-and greenhouse gas emissions, “knowledge for policy”.
Wachsmuth, J.; Schaeffer, M; Hare; B (2018): The EU long-term strategy to reduce GHG emissions in light of the Paris Agreement and the IPC SR1.5, working paper S22/2018 Sustainability and Innovation.
WIR/ WBCSD, World Resource Institute/ World Business Council for Sustainable Development (2019): Greenhouse Gas Protocl, 10/2019 Wood Mackenzie, (2019): Energy Transition – The future for green hydrogen and Green hydrogen production: landscape, projects and costs, Report.
Wyns, T; Khandekar, G; Robson; Institute for European Studies, IES (2018): A bridge towards a carbon neutral Europe, Vrije Universiteit Brussel (VUB), Brussels.