Joint Product Analysis of Rare Earths: Economic, Market and Technological Insights
Abstract
Rare earths, classified as critical elements by the European Commission, are of high importance to the automotive, chemical, and pharmaceutical industries. They are produced simultaneously and therefore can be referred to as joint products. In this paper, an approach is presented to analyze the drivers behind supply and demand changes of joint products to reveal cross-industry relationships between rare earths. The approach is based on a techno-economic analysis and includes economic, market, and technological evaluations. The heavy rare earth Gadolinium is analyzed in detail to give insights into applications, capacities, the rare earth industry, estimated growth rates, and strategy recommendations.
1 Introduction
1.1 Joint Products
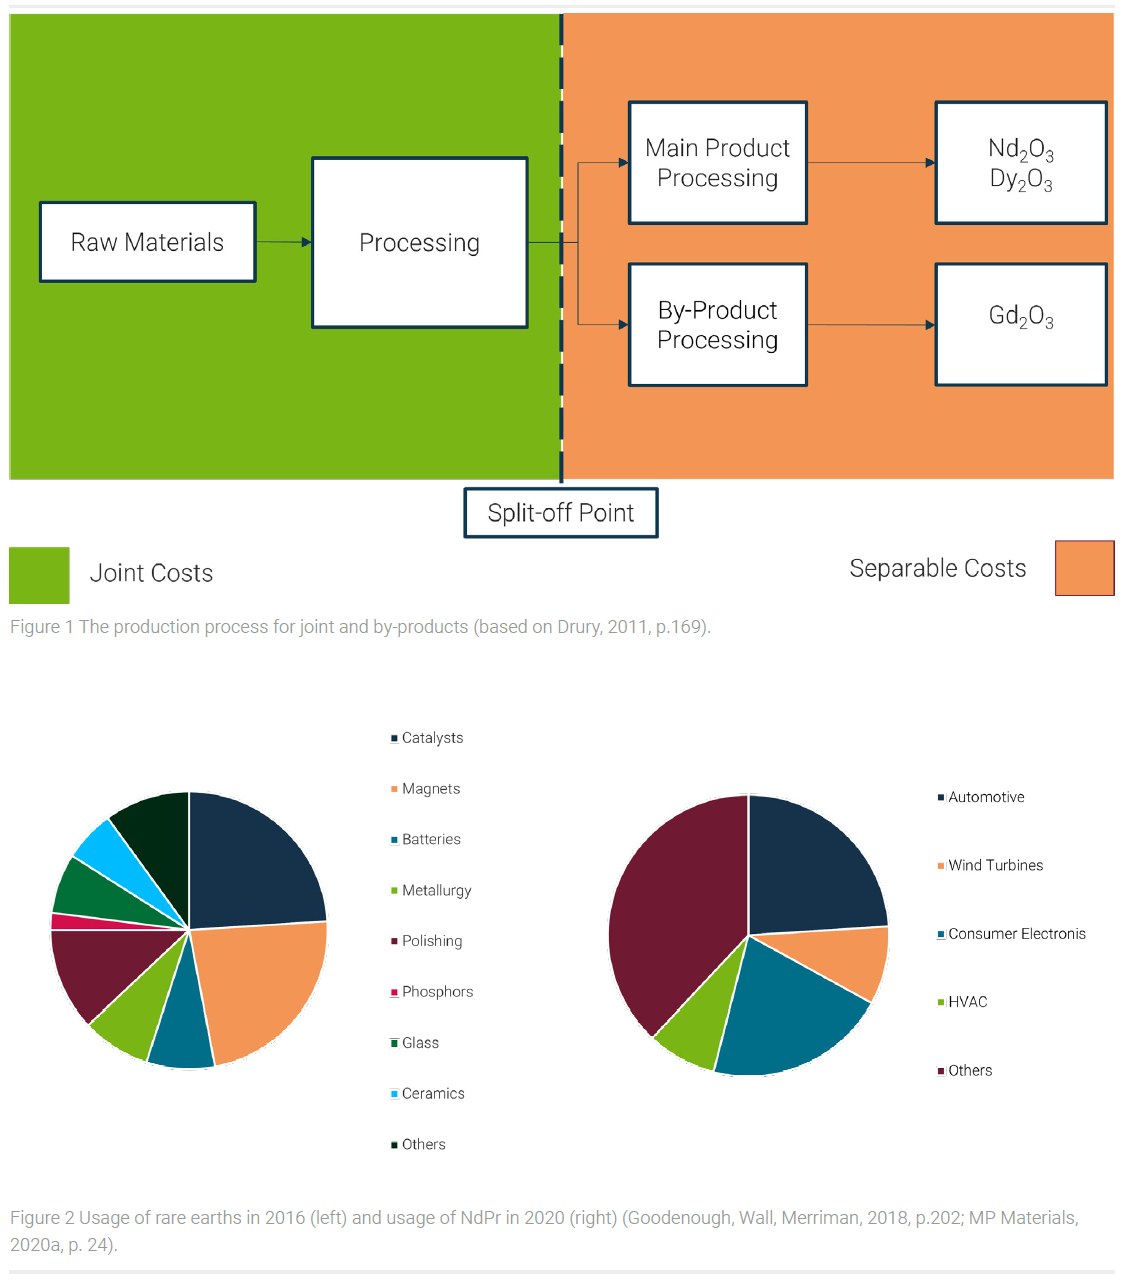
In the chemical and pharmaceutical industry, joint & by-products occur in several process steps. According to Drury (2011), they arise in production processes where the production of one product causes the simultaneous production of other products. These products are directly connected and cannot be produced separately (Drury, 2011). Various examples can be found in the industry. Traditionally, most joint products occur in the chemical industry. Joint and by-products can be distinguished by their sales value. If products are produced simultaneously and have a similar sales value, these products are called joint products. Products that have a lower sales value compared to the other products are called by-products (Drury, 2011). Figure 1 illustrates an exemplary joint production process and explains the most important terminology.
A characteristic of joint processes is that the products cannot be classified as individual products until the split-off point, depicted as a dashed line. Before that point, all occurring costs are joint costs and cannot be allocated to individual products. In general, joint costs contain the costs for labor and overhead, raw materials, and processing. The costs after the split-off point, for further processing and distribution, can be allocated to specific products and are called separable costs (Drury, 2011; Horngren, Datar, Rajan, 2012).
1.2 Rare Earth Elements & Applications
Examples of joint products are rare earth elements (REE). REEs arise together in nature and are mined simultaneously (Haque et al., 2014). According to the European Commission, rare earths are considered critical raw materials (European Commission, 2017). In the table of elements, REEs are found in the lanthanide series between lanthanum and lutetium plus the element’s scandium and yttrium. These elements are known for their interesting magnetic properties (Gupta, Krishnamurthy, 2005). Rare earths are very important elements for the catalysis of chemical reactions and are used in magnets and batteries. The major applications of all rare earths are shown in figure 2 (Goodenough, Wall, Merriman, 2018).
Of particular interest are the elements Neodymium and Praseodymium. These elements are used for permanent magnets in electric vehicles and wind turbines. Other major applications are consumer electronics and heating, ventilation, and air conditioning (HVAC) (MP Materials, 2020b). The heavy rare earth elements Dysprosium, Gadolinium, and Terbium are found in various applications, as well. Dysprosium is to 98 % used as an additive in NdFeB magnets. The applications of Gadolinium are more diversified. Gadolinium is used in magnets, alloys, luminescent material, nuclear technology, and MRI technology. Terbium is mostly used in luminescent material and as an additive in magnets (Marscheider-Weidemann et al., 2016).
1.3 Microeconomic Concepts of Joint Production
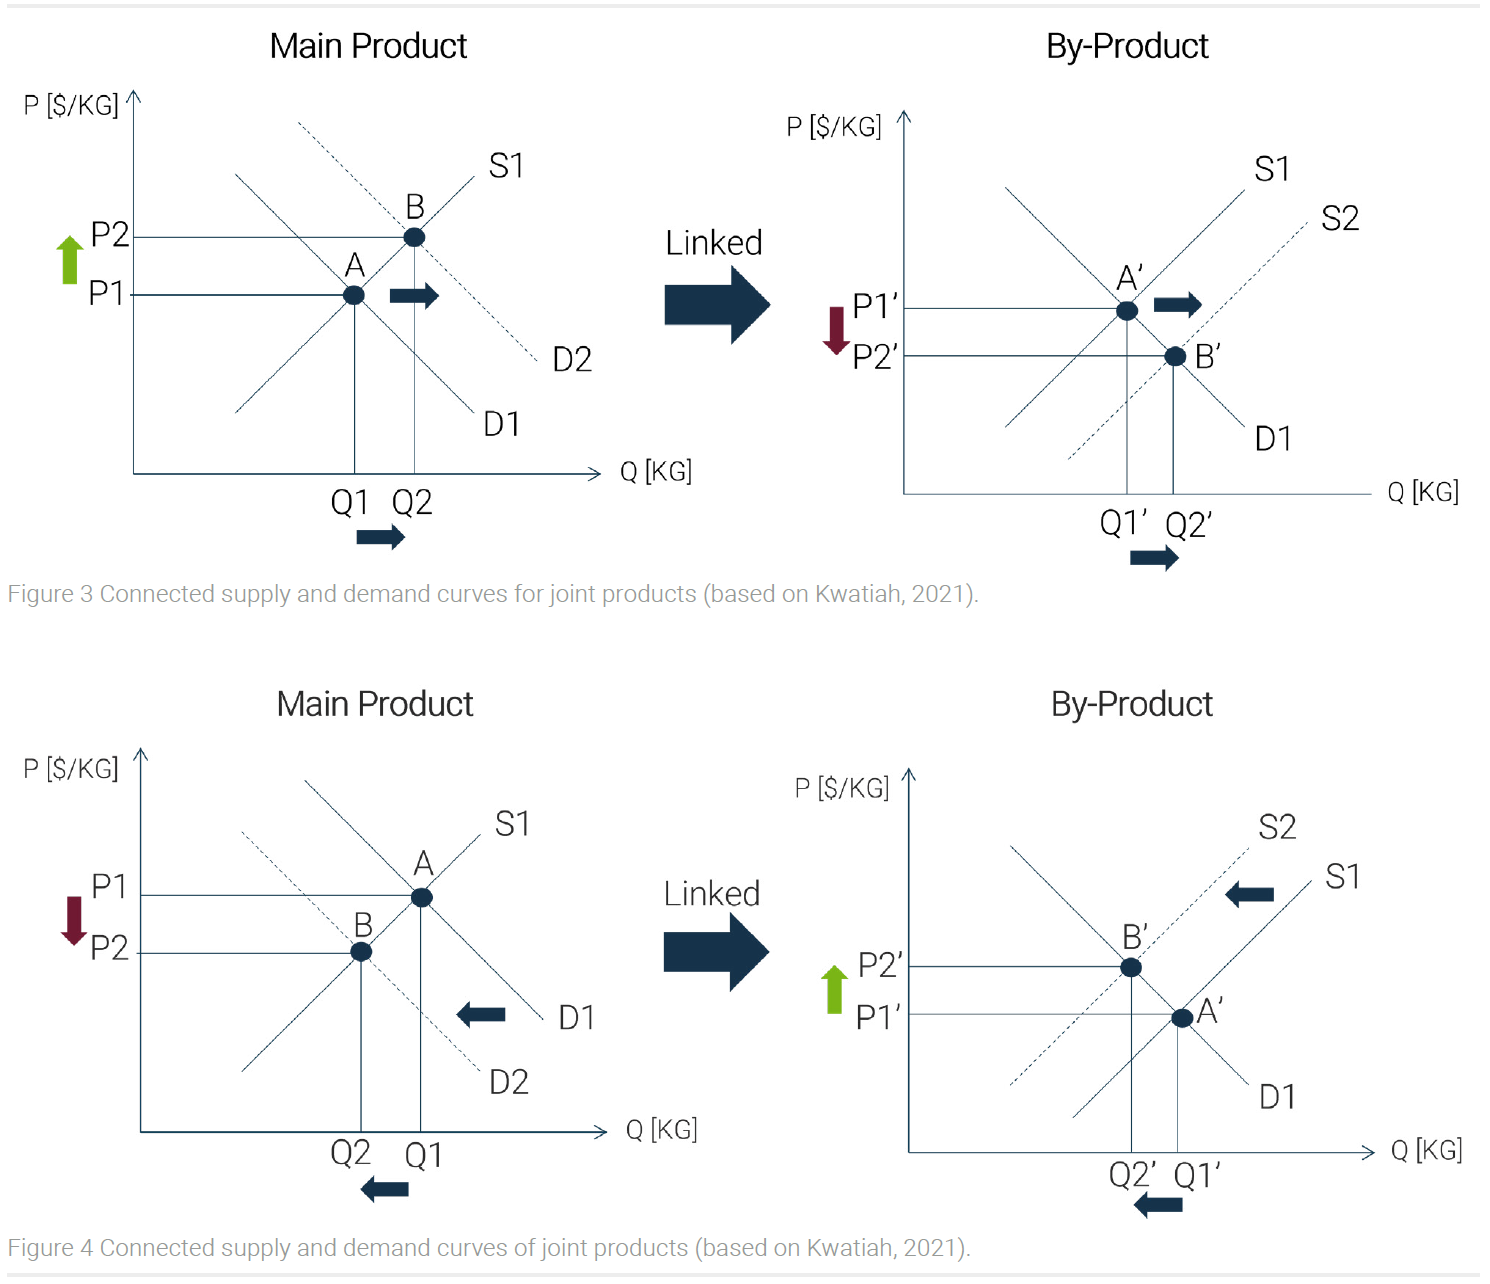
Figure 3 shows how joint products are joint in supply but not compulsory in demand. Rising demand for the main product leads to higher prices for the main product. Coupled production increases the supply of by-products. If the demand for the by-products remains the same, this leads to a price drop. An example of this scenario is the falling prices for Lanthanum and Cerium. These two elements are the by-products of rare earth mining (Kwatiah, 2020).
However, the main product Neodymium-Praseodymium (NdPr) is exposed to higher demand and therefore higher prices in the long term. This correlation of falling prices for Lanthanum and Cerium will increase if more NdPr is demanded.
However, the main product Neodymium-Praseodymium (NdPr) is exposed to higher demand and therefore higher prices in the long term. This correlation of falling prices for Lanthanum and Cerium will increase if more NdPr is demanded.
Besides, the opposite scenario of the falling demand for the main product can be found in the industry (figure 4). Reduced demand leads to a drop in the price of the main product. The coupled by-product increases in price since the reduced production volume reduced the supply while demand remained the same. If a larger amount of the by-product is required, the production costs for the main product may have to be paid as well (Kwatiah, 2021).
Several events can cause a market equilibrium disturbance. Price increases can appear during a supply shortage or a demand increase. Potential reasons for a supply shortage could be investment restraints, trade conflicts, monopoly, political crises, natural disasters, or warehouse problems. Factors that affect demand increase are economic growth, increasing resource intensity, or technology change. However, it must also be mentioned that technology change can also lead to demand decreases if products are substituted. Through changes in supply and demand, a new market equilibrium adjusts with a new market price. In general, higher market prices cause adaptation mechanisms which lead to lower market prices afterward. An increase in market prices can motivate new market players to enter a market. New production capacities are established which can lead to overcapacities. In an adjustment phase, only the most profitable companies can remain business. If demand cannot be covered by suppliers a good becomes more valuable and increases in its price. If the prices get too high the market will start to research for product substitutions or recycling which can ease price increases (Glöser-Chadhoud et al., 2016).
2 Joint Product Analysis
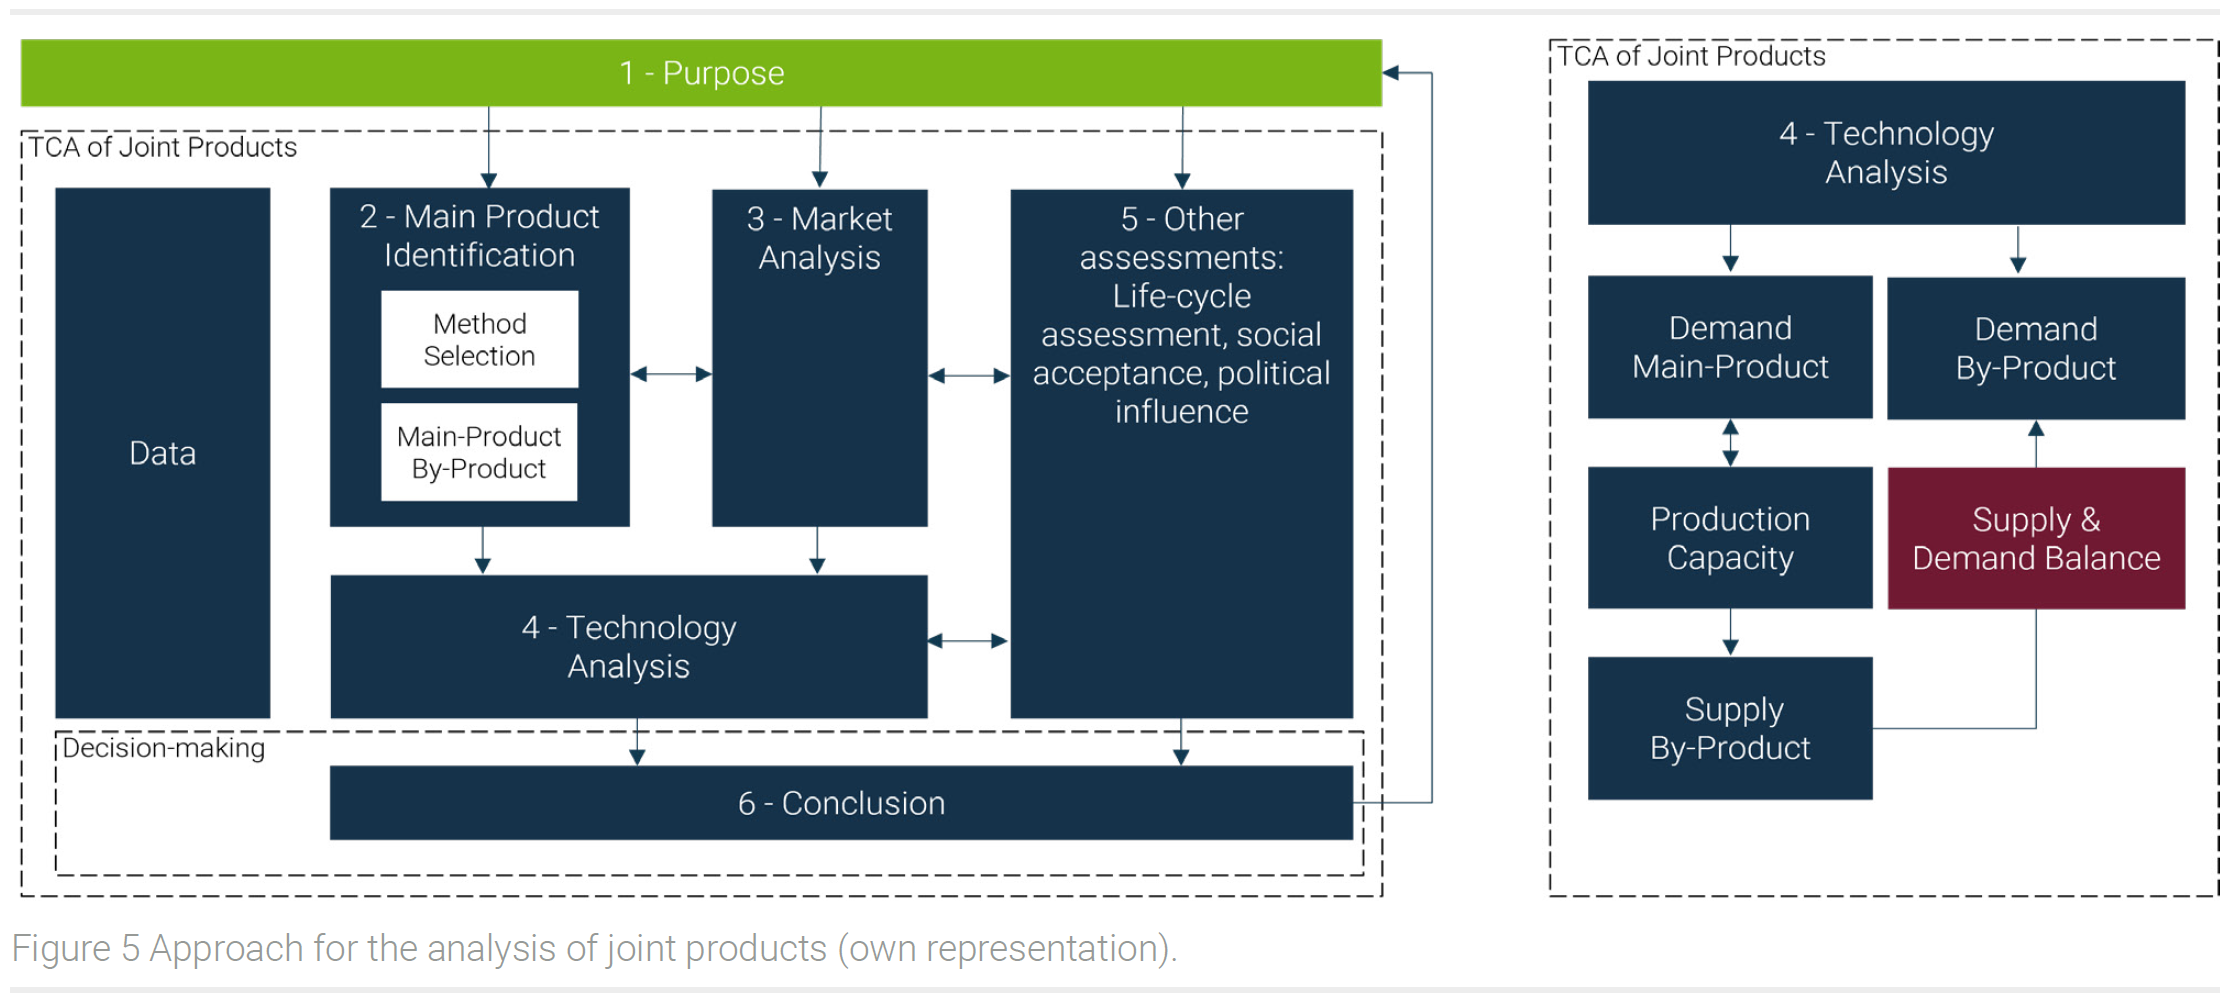
For the analysis of joint products, an approach is presented to evaluate joint products and give strategic management decisions regarding estimated production capacities and price trends, see figure 5.
The approach contains six steps to analyze joint products. Step one is about setting up a goal and the scope for the analysis, what production process, and which products should be analyzed.
Step two is about dealing with the identification of the main and by-products of the process. For that purpose, the product composition (product mix) must be evaluated and the amount of each product in the production process must be determined. In the case of rare earth processing, there are 15 elements having shares from <1 % to above 40 %. The main product is determined by using the weight, sales, or margin of each product. For that, current capacities, sale prices, and production costs are used to determine the main product. Because joint products are produced simultaneously, the main product influences the whole production process and affects the production of by-products as well.
Therefore, in steps three and four, the market and the technology of the products are analyzed. Current and expected market players, supply developments, and supply chain risks are demonstrated. Changes in the market and technology of the main product can influence the availability of the by-product. After that, the technology trends of the by-product are studied as well, and depending on the market foresight of the main product, it is estimated if the expected supply will cover the expected demand.
After analyzing the technology trends, political and societal risks are researched and evaluated. In countries with unstable governments or unpredictable law and regulation changes, the available production capacity might be affected. In step six the results of the previous analysis steps are interpreted to give a conclusion and answer the research question based on technological, economic, and political factors.
3 Methodology
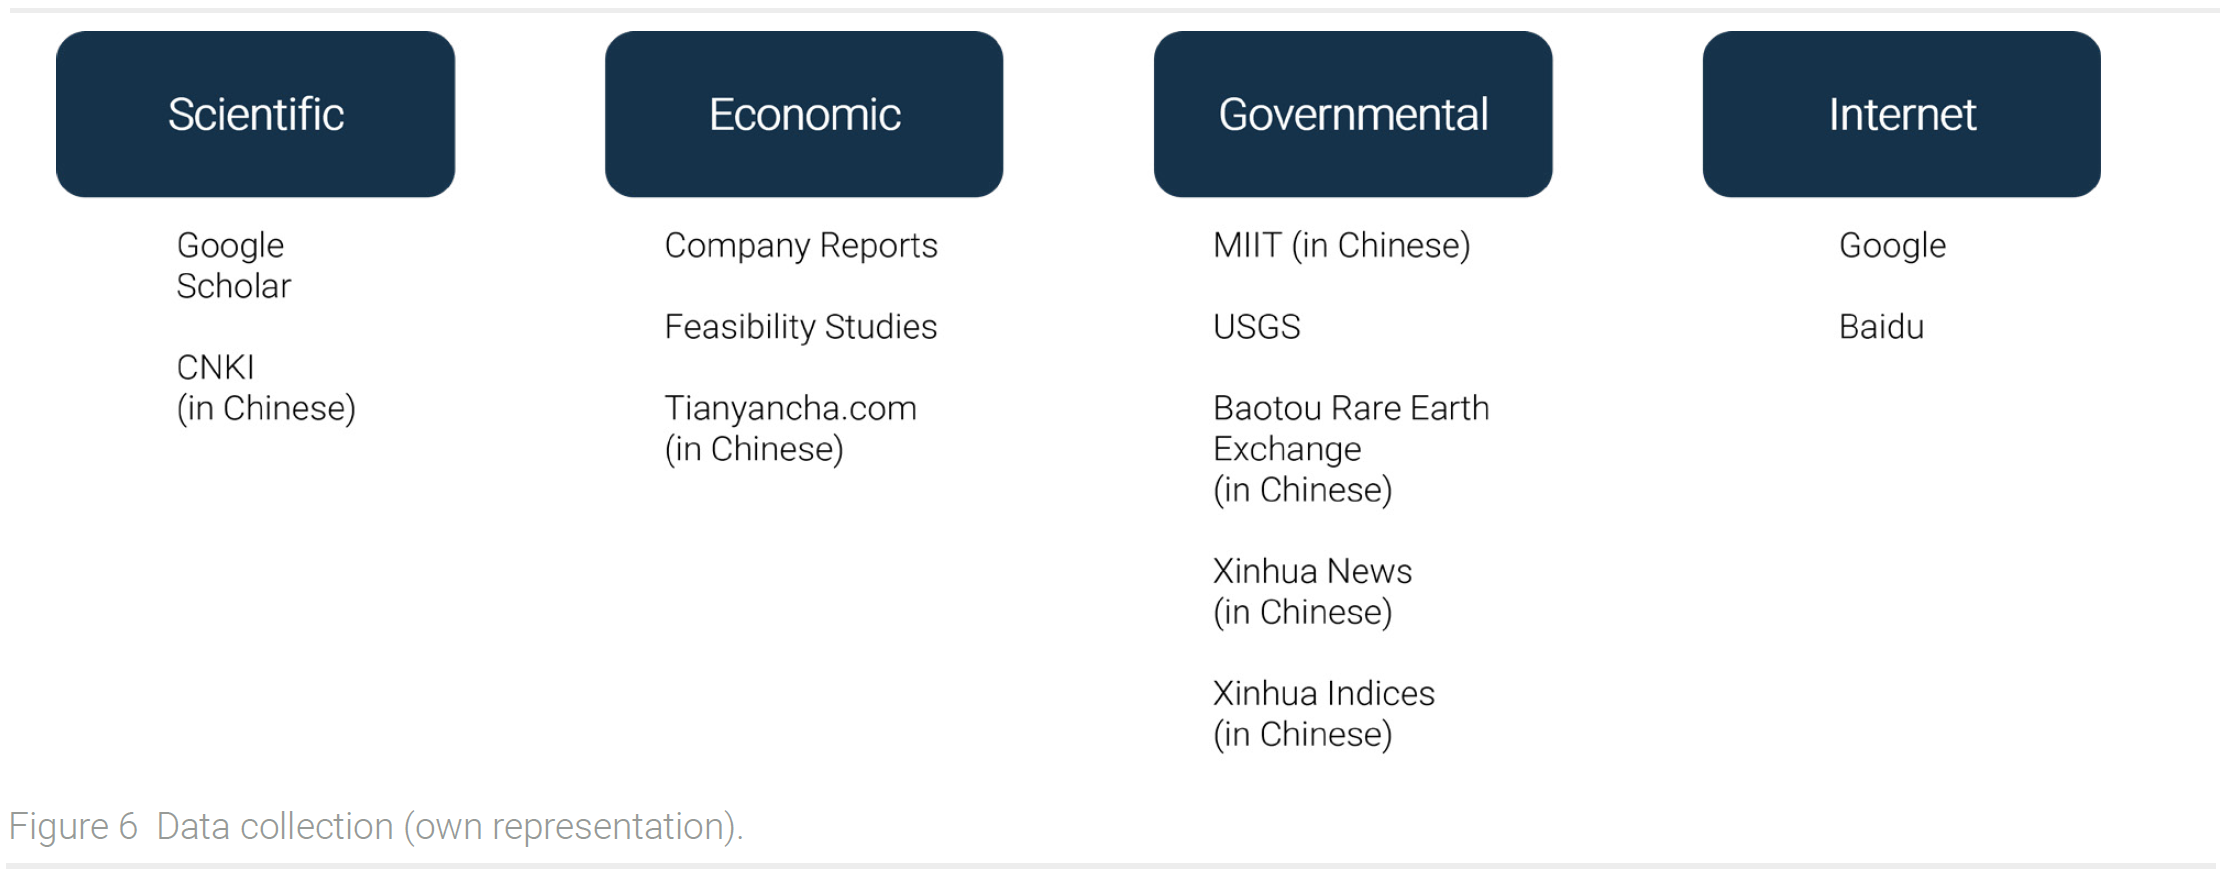
For data generation, a multi-language and open-source approach was used. Except for English literature also Chinese literature was reviewed. The data were categorized into four different categories (figure 6). Scientific, economic, governmental, and internet data. Scientific journals found on Google Scholar or Chinese National Knowledge Infrastructure (CNKI) were reviewed. Information on compa-nies was analyzed by using company websites, company presentations, and company databases. As databases for Chinese companies Tianyancha was used (in Chinese). Information about the current status of the rare earth industry feasibility studies of new rare earth projects and announcements by the Ministry of Industry and Information Technology (MIIT) (in Chinese) were used. Further information was provided by Baotou Rare Earth Exchange and Xinhua News (in Chinese). Internet data was searched with Google and Baidu (in Chinese).
4 Economic Analysis
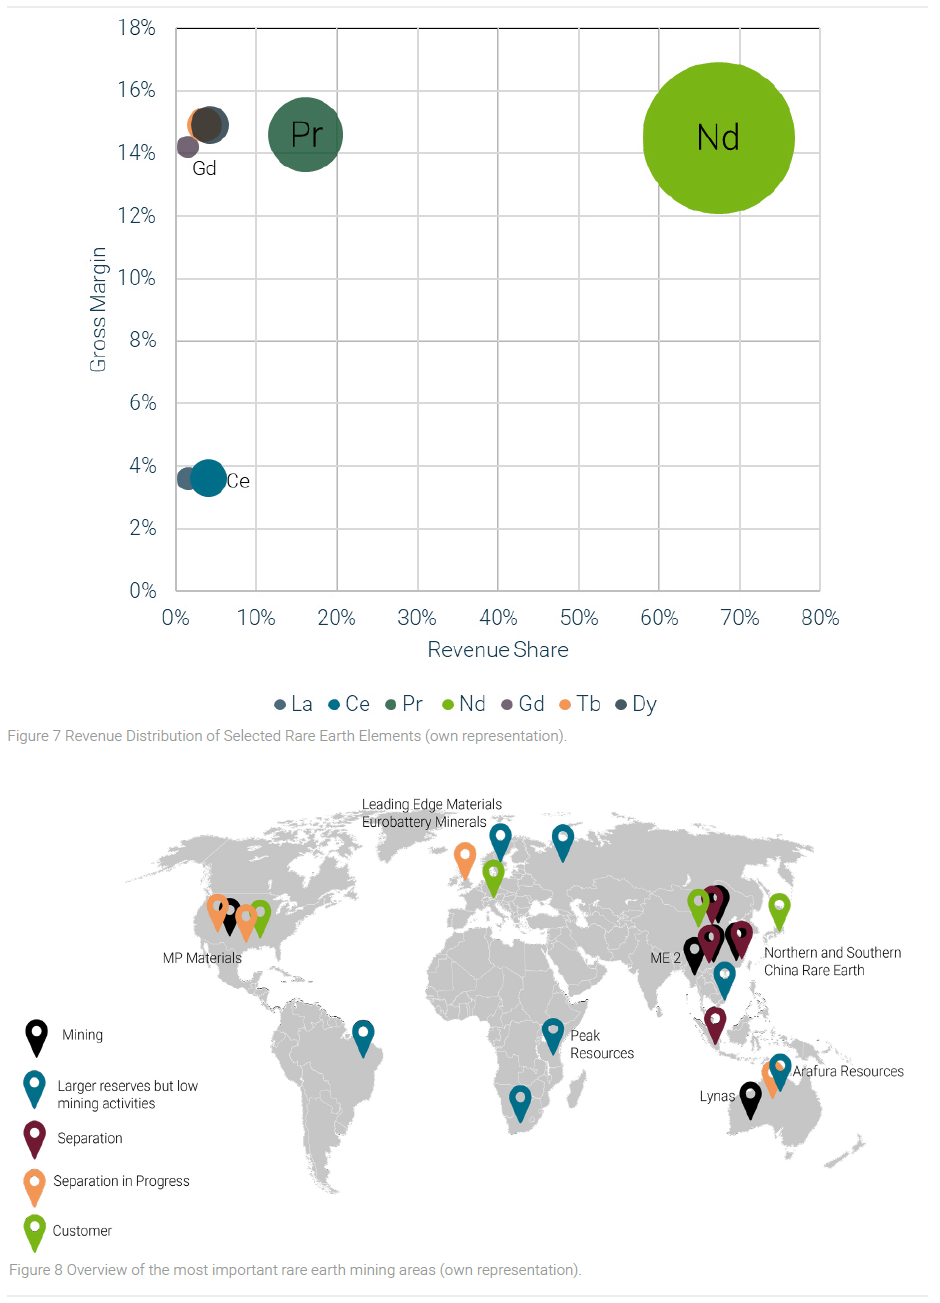
The joint production analysis starts with an evaluation of the main product of the process. The main product can be estimated by revenue and margin. For the calculation of the revenue share, the product composition and the market prices are needed. Margins are calculated by using production costs provided by Arafura Resources (Arafura Resources, 2019).
In a typical rare earth mining company, Neodymium and Praseodymium have together a revenue share of about 80 %. Gadolinium has a revenue distribution of about 2 %. It can be stated, that the main products of rare earth mining are the elements Neodymium and Praseodymium (figure 7). These products influence the expected production capacity of rare earths. Gadolinium is only a by-product of rare earth mining, with less contribution to the revenue.
5 Market Analysis
5.1 Overview
The rare earth elements are mainly mined in China. However, some other countries are also active in the mining of rare earths (figure 8). The following figure shows an overview of the most important areas for rare earth mining and what areas have larger reserves (USGS, 2021).
5.2 Countries and Capacities
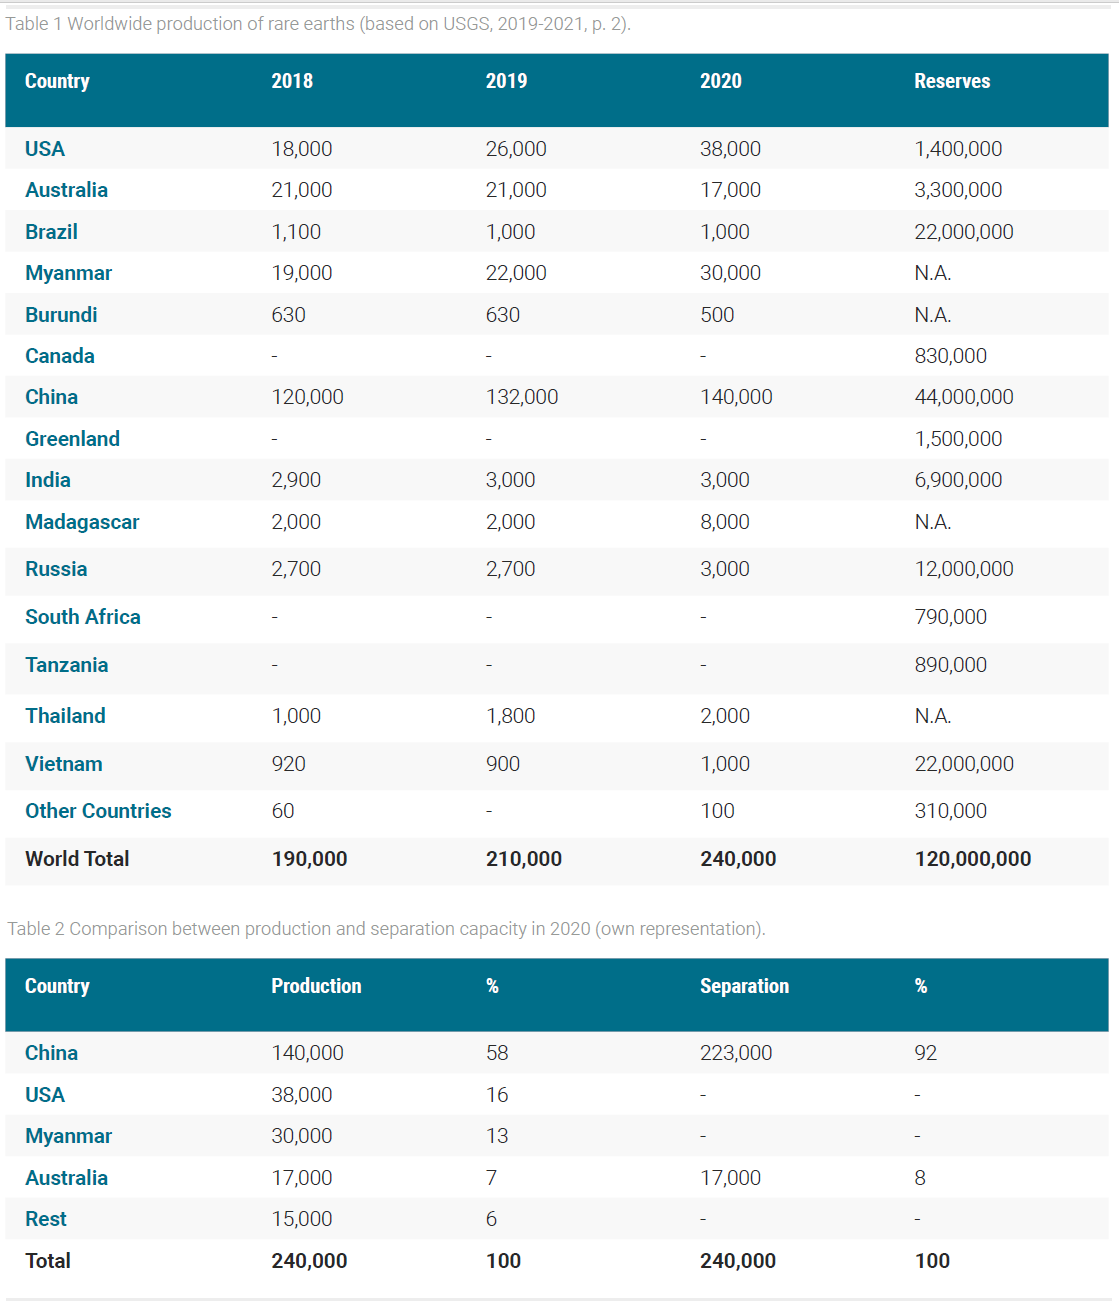
According to the U.S. Geological Survey (USGS), the worldwide production in 2020 was about 240.000 mT of rare earths (table 1). The most important countries for rare earth mining are China, the USA, Myanmar, and Australia. The most reserves are in China, Brazil, Vietnam, and Russia. In 2018 the United States restarted its rare earth mining operations and Myanmar entered the market.
About 60 % of the rare earths are mined in China. However, more than 90 percent of the separation is done in China (table 2). That’s because most countries do not have the mining capacities to process the rare earths themselves¹.
China functions as a contact point for rare earth concentrate worldwide. As we will see in the following chapter, some countries with higher resources of rare earths are planning to build their own separation facilities to be less dependent on China.
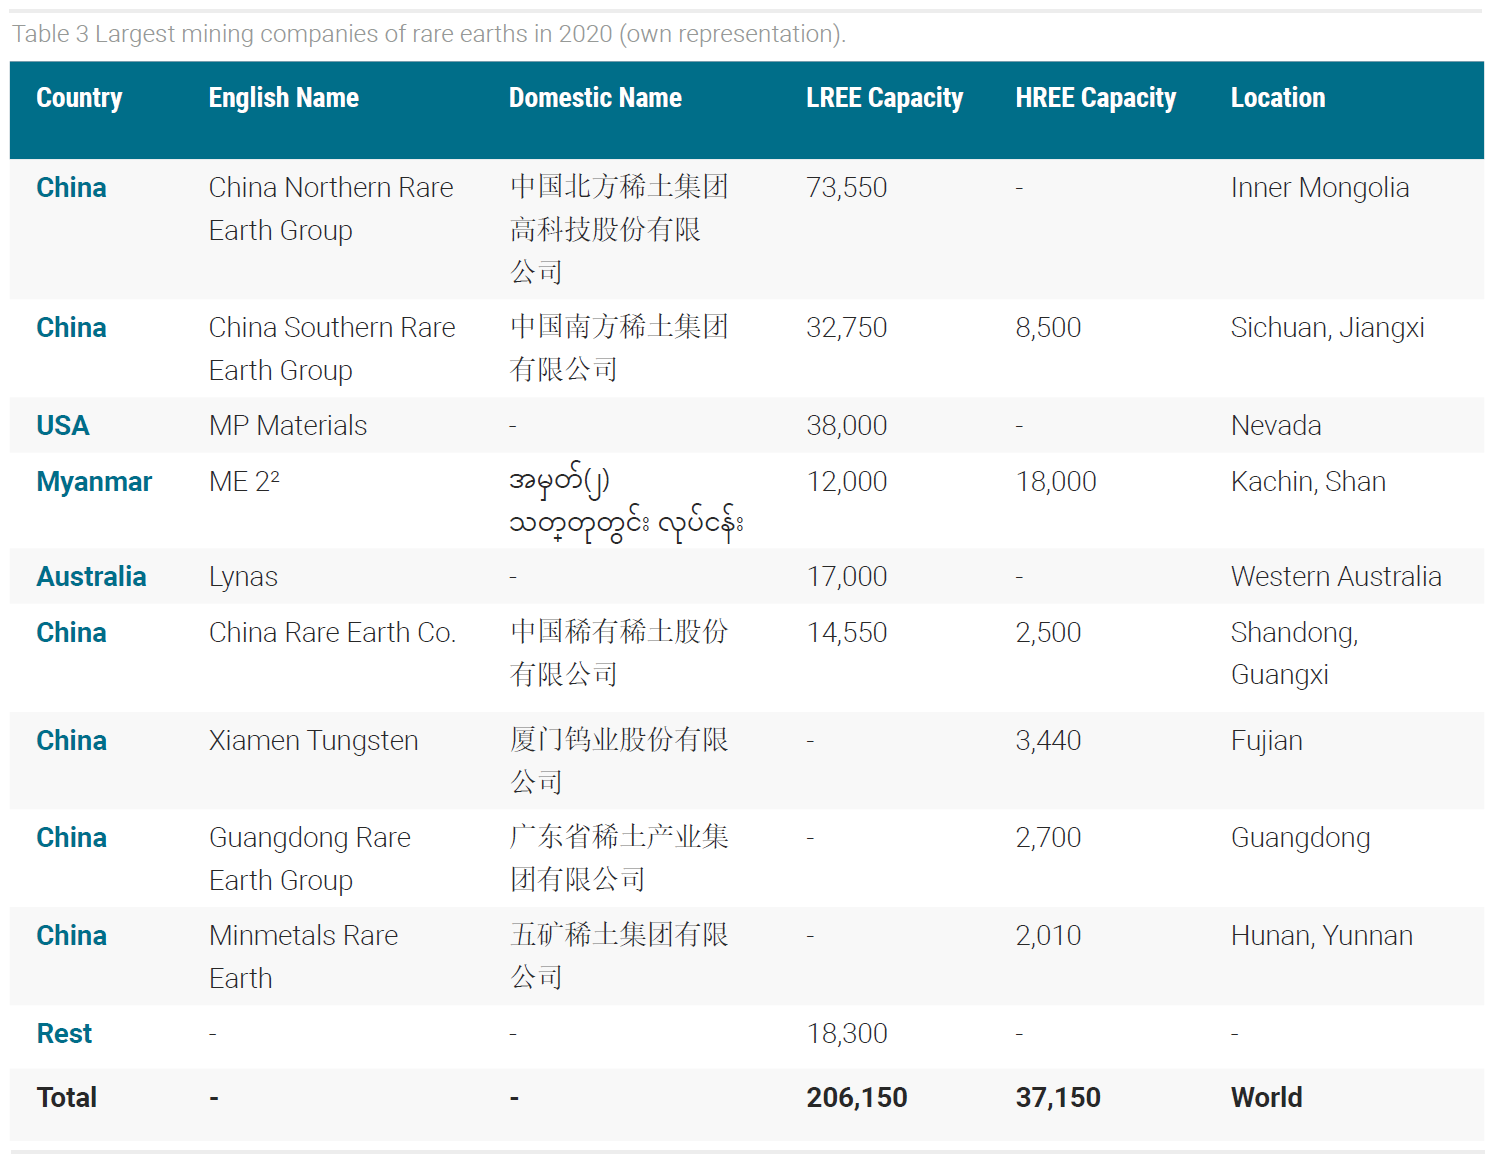
The top five players in the market dominate over 80 % of the available capacities (table 3). However, the data of the key companies in rare earth mining also shows that the smaller companies located in South China are more dominant in heavy rare earth mining (USGS, 2021; MIIT, 2019; MIIT, 2020).
5.2.1 Companies
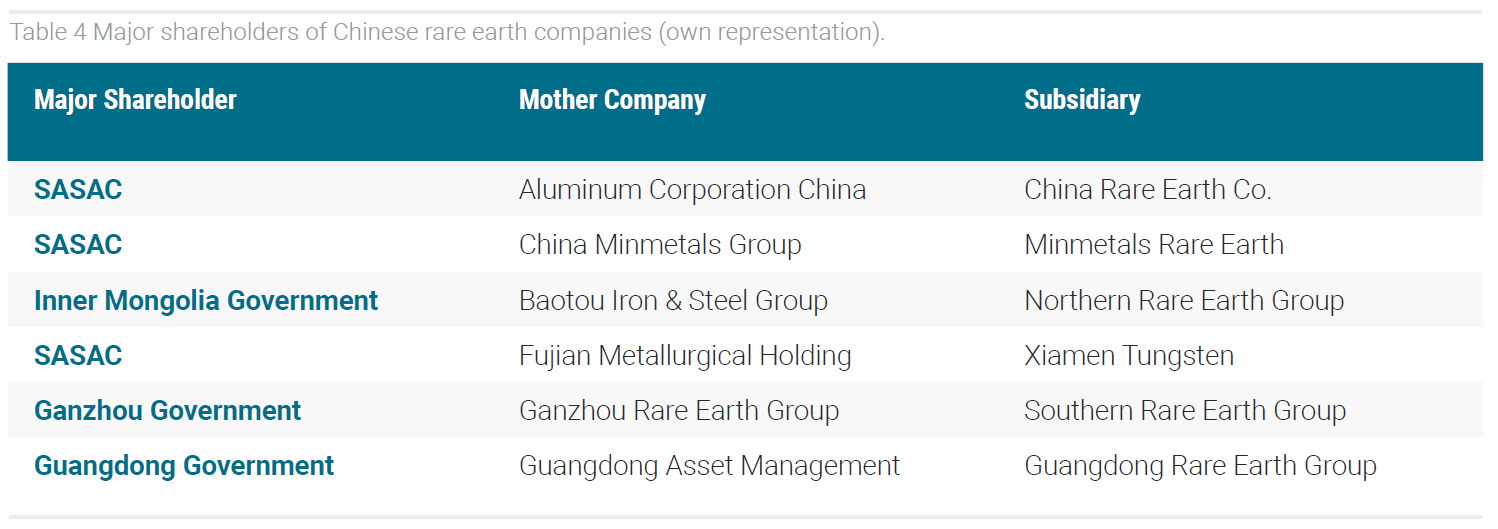
China‘s rare earth mining sector is dominated by six companies called China Minmetals Corporation, China Rare Earth Co. Ltd., China Northern Rare Earth (Group) High-Tech Co., Ltd., Xiamen Tungsten Co., Ltd., China Southern Rare Earth Group, and Guangdong Rare Earth Industry Group. Among these six companies, China Northern Rare Earth (Group) High-Tech Co., Ltd. is the biggest manufacturer of rare earth oxides. China Northern Rare Earth is operating the well-known production site in Baotou, Inner Mongolia China (China Northern Rare Earth Group, 2020). Chinese databases like Tianyancha.com give insights into the shareholder structure of Chinese rare earth companies. Table 4 shows major shareholders of Chinese rare earth companies (Tianyancha, 2021).
All six of the above-mentioned companies are state-owned. However, there are differences in their sizes and their state-owned shareholders. Three out of six companies are controlled directly by the State Council of the People’s Republic of China (SASAC). The other three are controlled by province authorities. In China, there are asset supervision authorities at the county, province, and state levels. With a market share of 53 and 27 % China Northern and China Southern Rare Earth Group are controlling 80 % of the rare earth market in China (Tianyancha, 2021). In December 2021 a merger of Southern Rare Earth Group, Minmetals Rare Earth, and China Rare Earth Co. was announced. The new company will operate as China Rare Earth Group. This new company will be the second biggest player in the rare earth industry after China Northern Rare Earth Group and the worldwide largest producer of heavy rare earth elements, accounting for 70 % of China‘s heavy rare earth production. Additionally, the Jiangxi Ganzhou Rare Metal Exchange will also be part of the newly established company (Reuters, 2021; NikkeiAsia 2021).
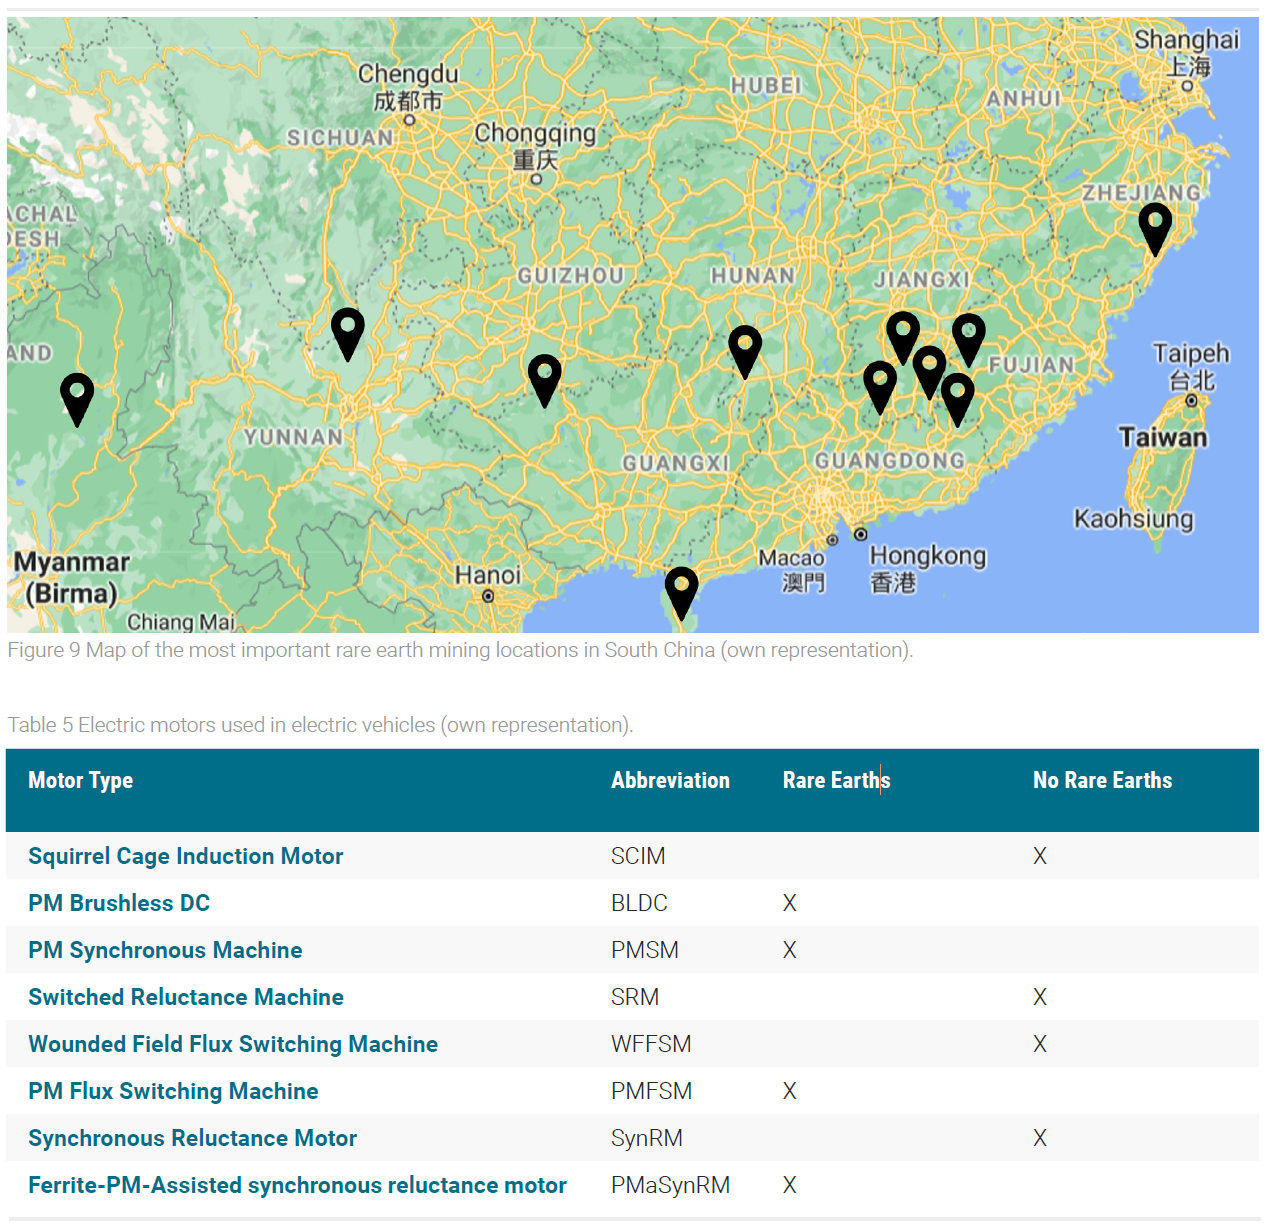
5.2.2 South China & Myanmar
Most of the heavy rare earths are mined in Southern China and Myanmar. In figure 9, the most important locations for heavy rare earth mining are shown (Zhang et al., 2016).
Most of the rare earth mines in South China are in the triangle of Jiangxi, Guangdong, and Fujian. The most important mines are in the following areas. The first name refers to the province and the second name is the city within each province: Jiangxi, Xinfeng; Jiangxi, Longnan; Jiangxi, Xunwu; Guangdong, Dapu; Fujian, Ninghua; Guangxi, Jiaoguo; Hainan, Longliu; Hunan, Jianghua; Yunnan, Chuxiong; and Zhejiang, Daxi (Zhang et al., 2016).
Attention must also be paid to Myanmar. Since 2018, Myanmar’s rare earth industry sector is growing increasingly. According to the U.S. Geological Survey, Myanmar is responsible for about 12 % of rare earth oxides which is comparable with the production capacity of Australia (USGS, 2021). Although the production capacity has increased much in the last years, still not much information about the mining companies in Myanmar is available. The rare earth mining sector is mostly controlled by a company referred to as Mining Enterprise 2 (ME2) in various industry reports (PWC, 2019). Most of the rare earths are mined in the two provinces of Kachin and Shan in Myanmar (Lynn, Oye, 2014). These two states are close to the Chinese border and are neighboring states of Yunnan Province, China. The border control point of Myanmar and China at Tengchong Houqiao Port, Yunnan, China is therefore of interest in analyzing price fluctuations of heavy rare earth elements like Dysprosium or Gadolinium (China Rare Earths Holdings, 2020). Closure of the border can lead to strong price fluctuations caused by supply decreases. This case appeared from June to August 2019 when the prices for Dysprosium, Gadolinium, and Terbium escalated (Xinhua Indices, 2021). Further developments must be evaluated regularly to keep risks within a limit.
6 Technology Analysis
6.1 Permanent Magnets
The rare earth oxides of Neodymium, Praseodymium, and Dysprosium are mostly used to manufacture Neodymium-Iron-Boron permanent magnets (Nd2Fe14B). Permanent magnets play an important role in establishing a carbon-neutral industry because permanent magnets are used in electric vehicles, wind turbines, and consumer electronics (MP Materials, 2020b). Currently, the most used permanent magnets are NdFeB and NdDyFeCoB magnets. By adding Dysprosium, the thermal resistance can be increased up to 200 °C which makes them useful for applications in electric vehicles. Another option would be SmCo magnets. However, the low concentration of Samarium makes them impractical for large-scale industrial applications. Except for NdFeB and SmCo, other permanent magnets like GdCo, PtCo, and MnAl can store less magnetic energy and are therefore weaker than currently used NdFeB magnets (McCallum et al., 2014; Cui et al., 2018).
6.2 Rare Earth Free Motors
A big threat for the rare earth industry would be the large-scale implementation of rare-earth-free electric motors. There are different kinds of electric motors available and most of them currently use permanent NdFeB magnets. Table 5 should give an overview of the different motor types
and if rare earths are used or not (Riba et al., 2016; Widmer, Martin, Kimiabeigi, 2015; Cabezuelo et al., 2018).
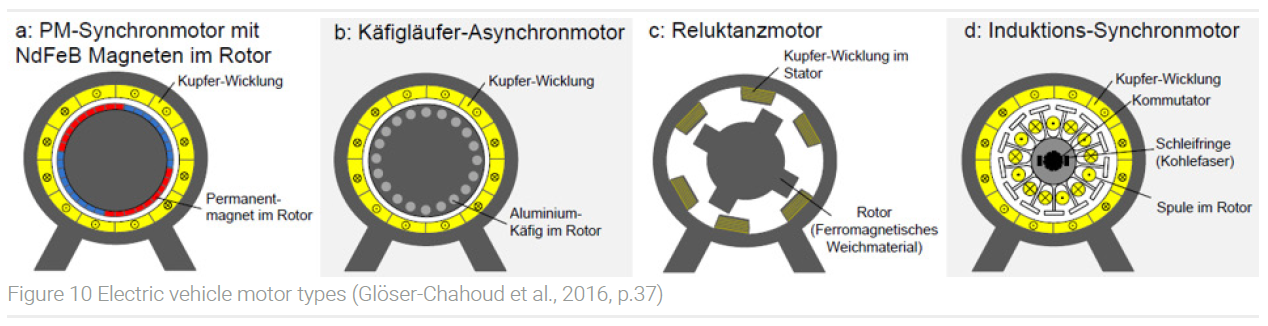
Motors that do not consist of rare earths use copper and aluminum instead. The most common motor types PM-synchronous motor, asynchronous motor, reluctance motor, and induction motor are illustrated in figure 10 (Glöser-Chadhoud et al., 2016).
The majority of manufacturers nowadays use the PMSM technology because of its features and high-power density (Cabezuelo et al., 2018). Examples of cars that are using this type of motor are VW ID.3, BMW i3, Nissan Leaf, Volkswagen e-Golf, Mitsubishi i-MiEV, Volkswagen e-UP, Citroën C-Zero, Peugeot iOn, Citroën Berlingo Electric, Ford Focus Electric, Fiat 500e, Bolloré Bluecar, Chevrolet Spark EV, and Kia Soul EV. However, cars based on permanent magnet-free induction motors are more frequently seen in the industry. Ever since Tesla introduced this type of technology with the Tesla S model in 2014, companies like Toyota and Mercedes Benz have used this technology in certain models like the RAV4 or Mercedes-Benz B-Class as well (Riba et al., 2016). In 2020, BMW announced that it will use rare-earth-free electric motors in its fifth generation of electric vehicles, which became available in 2021 (BMW, 2020).
A deeper look at the features of different motor types shows that NdFeB-PMSM motors are still the best option in terms of mechanical power (Riba et al., 2016). However, in terms of efficiency, torque density, or speed, other motor types show similar results (Cabezuelo et al., 2018). Considering costs, rare-earth-free motors are also cheaper in manufacturing (Widmer, Martin, Kimiabeigi, 2015). It is expected that both motor concepts will be used in the future. The development of motor concepts must be evaluated regularly because the Neodymium and Dysprosium content in motors is indirectly connected to the quantity of mined Gadolinium. Electric vehicles without rare earths could still be an option in the future due to the supply risk and ecological aspects. Not to mention rare earths are coming more into the focus of society and companies could use a free rare earth strategy to convince customers of buying their products. Market outlooks expect that about one-third of NdFeB magnet capacities are used in electric vehicles (Arafura Resources, 2020). If rare-earth-free motors achieve a higher market share, there could be a conflict between higher production capacity and substitution of technology, which could lead to slower increasing prices than expected.
6.3 Estimated Rare Earth Supply until 2030
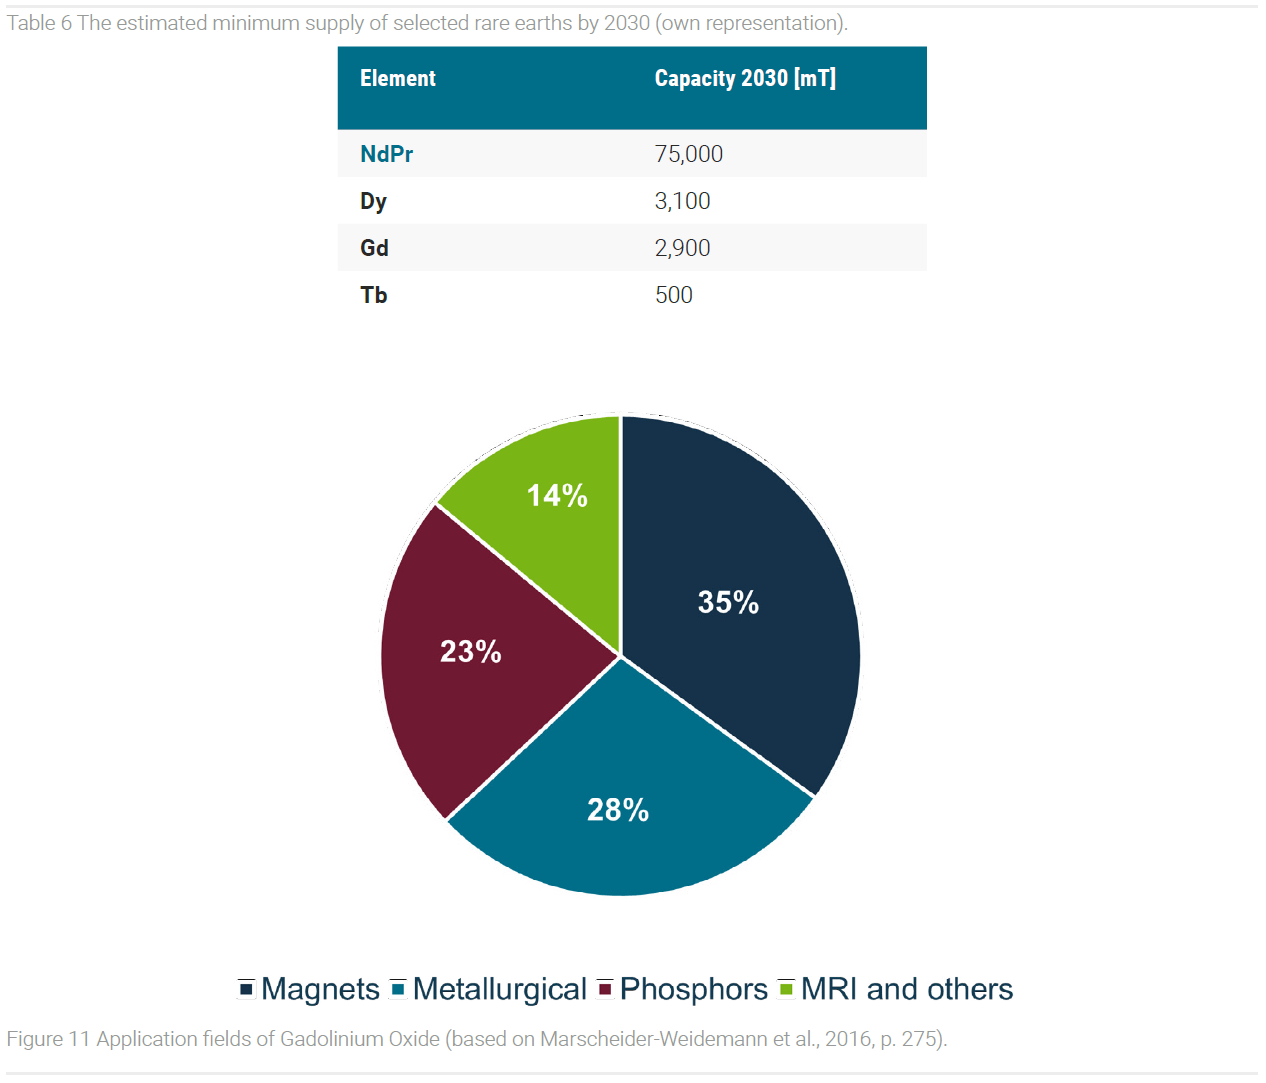
It is estimated that the global demand for NdPr will increase from 35-45.000 up to 75-98.000 mT by 2030 (MP Materials, 2020b; Arafura Resources, 2020; MP Materials, 2020a). The whole NdPr market is supposed to grow with about 8.0-8.2 % p.a. The biggest driver of this development is the automotive sector with expected growth rates of 16.2-16.5 % p.a. To cover the demand the total rare earths sup-ply must increase to 375-490.000 mT by 2030³. A minimum Total Rare Earth Oxide (TREO) supply of 375.000 mT would mean the following capacities for the most important rare earths (see table 6)4.
For the pharmaceutical industry especially, Gadolinium is of interest. The estimated supply is calculated to be around 2.900 mT by 2030. The next chapters are dealing with Gadolinium applications and estimated growth rates of the Gadolinium market to analyze if the estimated supply covers the estimated demand in the next decade.
6.4 Gadolinium Applications
In 2020 the Gadolinium Oxide demand excl. China was 1455 mT (Statista, 2021a). Assuming that China accounts for 17 % of worldwide BIP and it already has similar demand as industrial states it can be concluded that the worldwide demand for gadolinium oxide in 2020 was about 1600-1800 mT (Statista, 2021b). Compared to a supply of 1.600-1.800 mT the supply and demand of Gadolinium Oxide were in balance5. Figure 11 illustrates the major applications of Gadolinium Oxide (Pöttgen, Jüstel, Strassert, 2020; Marscheider-Weidemann et al., 2016).
Gadolinium is used in a variety of industrial applications. The most important ones are magnets, metallurgy, phosphors, and MRI contrast agents. The next chapter analyzes the expected growth rates of the major application fields.
6.4.1 Magnets
Gadolinium compounds can be used as additives in magnets to improve thermal resistance. It is assumed that the total magnets market is growing at 7.0-8.0 % per year. The main drivers are the automotive, energy, and consumer electronics industry (Arafura Resources, 2020; MP Materials, 2020b).
6.4.2 Metallurgy
Gadolinium compounds like Gadolinium Oxide or Gadolinium Nitrate are used in alloys and nuclear technology. Gadolinium used in metallurgical processes could be a big driver in the future because the world has a high demand for energy and construction. Looking at nuclear technology, nuclear technology is still a major energy source in the United States, China, and France. The capacity of nuclear energy plants in 2019 was 392 GW(e). In a low scenario, the nuclear energy capacity is declining to 362 GW(e) and in a high scenario, it is increasing to 715 GW(e) by 2050. In the low scenario, nuclear energy is declining -1.0 % p.a. until 2050. In the highest scenario, the electricity generated by using nuclear energy could double by 2050 with growth rates of about 2.8 % p.a. (IAEA, 2020; IEA, 2020). The different scenarios and the fact that besides Gadolinium Oxide also other compounds both in alloys and nuclear technology can be used makes it difficult to give precise assumptions for the future.
6.4.3 Phosphors
Gadolinium compounds are used in phosphors. The market for phosphors is saturated and is not the biggest driver for Gadolinium demand in the future. 0-2.0 % growth is estimated (Binnemans et al., 2018).
6.4.4 MRI Technology
Currently, there are three different major MRI contrast agents on the market. Gd-DOTA sold as Dotarem and Clariscan by Guerbet. Gd-DO3A-butrol sold as Gadovist and Gadavist by Bayer and Gd-HP-DO3A sold as ProHance by Bracco (Pöttgen et al., 2020). The global MRI contrast media market is expected to grow by 4 % p.a. (Guerbet, 2020).
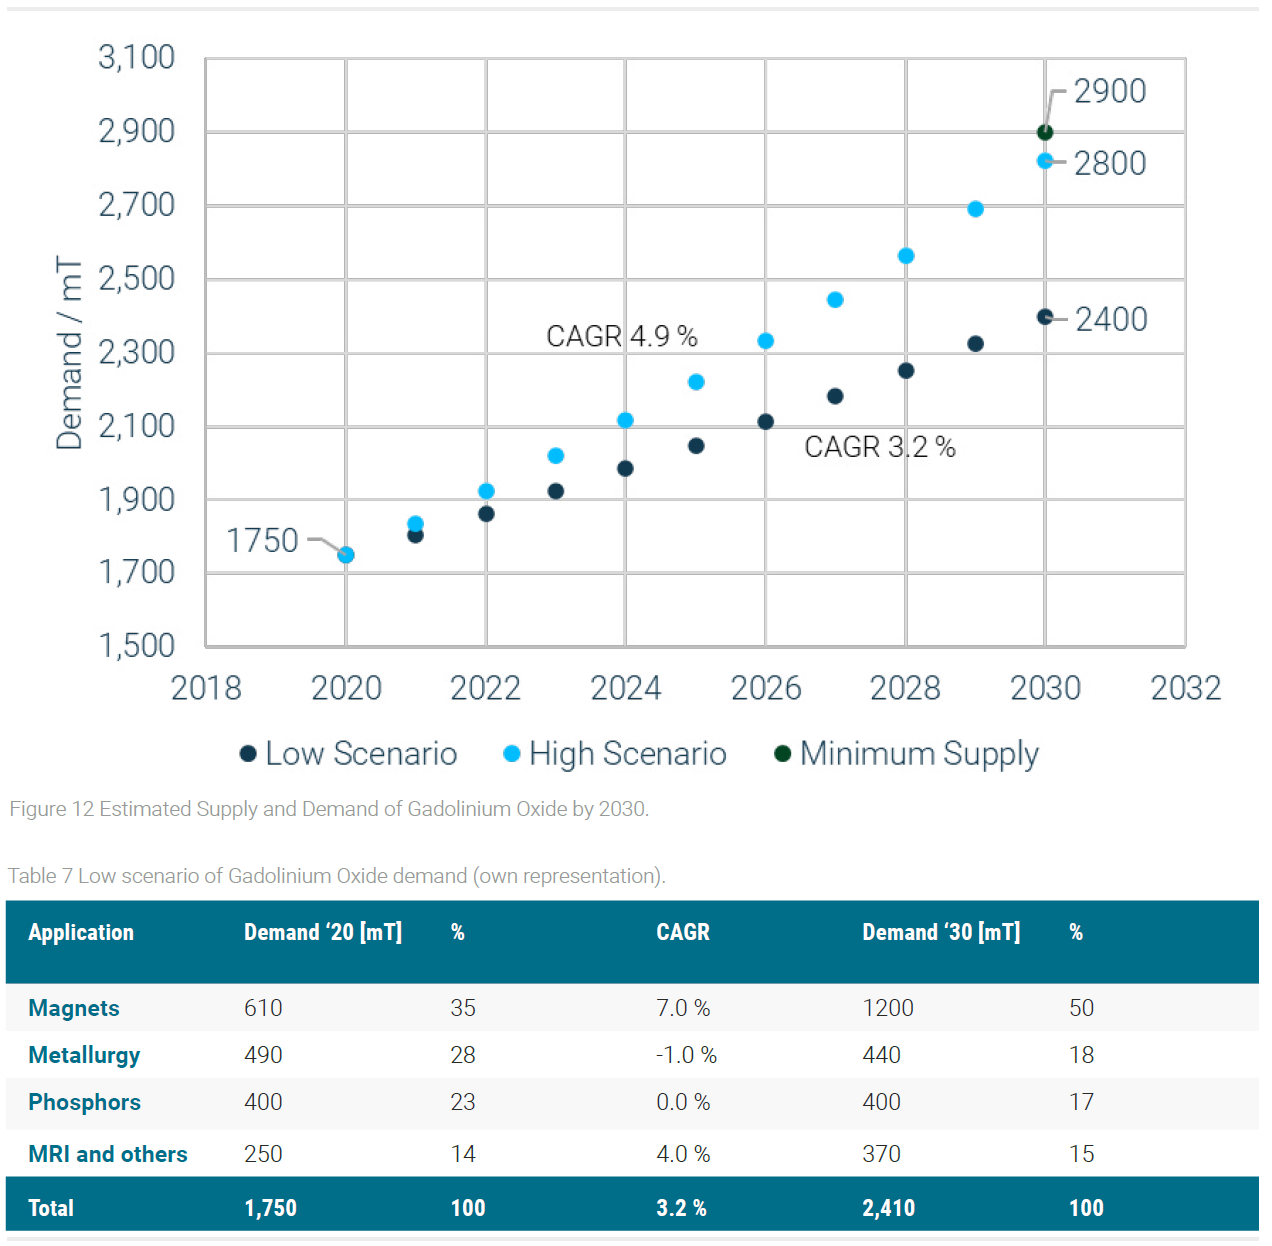
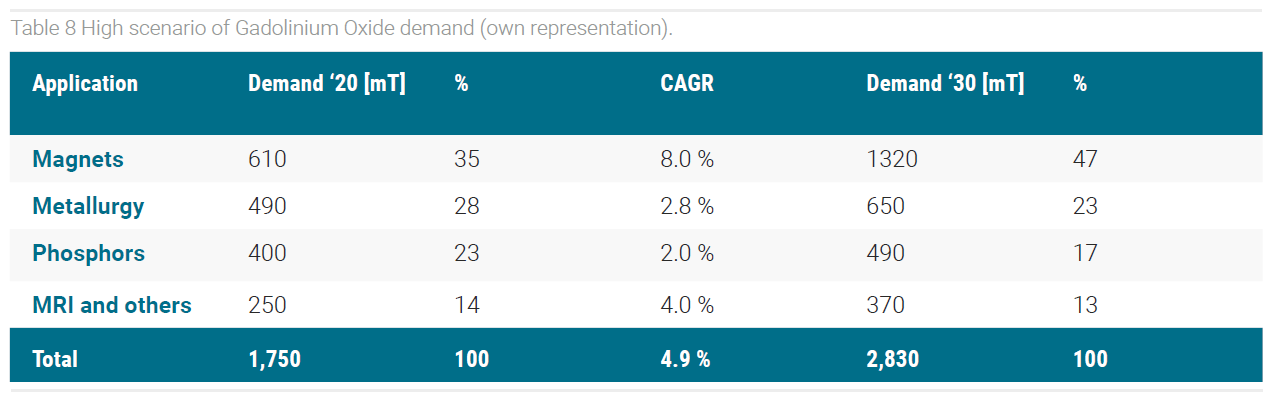
6.4.5 Estimated Gadolinium Oxide Demand by 2030
Based on the assumptions in this technology analysis the demand for Gadolinium Oxide is estimated to the future, see figure 12, table 7, and table 8. The future demand for Gadolinium Oxide should vary between 2.400 mT-2.800 mT by 2030. Based on the market and technology analysis of the main product NdPr, the estimated supply of Gadolinium Oxide, which is coupled to the production of other rare earths, should be a minimum of 2.900 mT. The estimated supply of gadolinium is based on current supply, estimated growth rates, and the rare earth ore composition. The demand for the main product NdPr is growing faster than the demand for the by-product Gadolinium. A supply and demand imbalance should not appear because of technological reasons. Binnemans et al. confirmed this estimation and expect a slight oversupply of Gadolinium Oxide, as well (Binnemans et al., 2018). However, the supply is not significantly higher than the demand and
the balance between supply and demand could turn into an imbalance if parameters like growth rates or mining activities in Southern China change in the future. A supply shortage could appear in the case of force majeure, regulations, or if supplies are suspended by the main producers.
7 Politics and Society
The market and technology analysis from previous chapters have shown that the supply and demand of rare earths will increase in the next few years. However, the market is dominated by only a few players, whereby political decisions can influence the availability of rare earths more than the potential centralization of the mining and separation in a few countries can. Chinese, Myanmarese, and German regulations which could influence the availability and trading with rare earths must be discussed and evaluated.
8 Chinese Regulation
In January 2021 the Chinese Ministry for Industry and Technology Information (MIIT) published a new draft law for the regulation of the Chinese rare earth industry. The publishing of a new draft law was a foreseeable incident because the Chinese government is trying to get more control over the domestic rare earth industry for a longer period. The whole draft law (稀土管理条例) can be read at the website of the MIIT (MIIT, 2021). The most important facts are summarized in this chapter.
The new draft law describes in 29 articles the new regulatory environment of the rare earth industry. The core is about stopping illegal rare earth mining, which is still a major problem in China (Packey, Kingsnorth, 2016). New rare earth projects must pass through an approval procedure and are only allowed to start operating once the approval is confirmed. All approved rare earth projects are forwarded to the State Council, which will publish new rare earth projects regularly (Article 7). According to Article 8, the state can restrict or stop rare earth mining and processing if it harms the ecological environment. The selling and purchasing of illegally mined rare earths will be prohibited and convicted organizations will be fined (Article 11, 20-24). Like in all industries in China, the State Council plays an important role in strategic management decisions. It decides regional economic policies and requirements for the layout of the rare earth industry, and also determines production capacity and production and operation conditions (Article 9). The most important changes for foreign companies will be articles 14-16. According to article 15, the state will control the import and export of rare earth compounds more precisely. This has to do with the aspiration of the Chinese government to increase the strategic reserves of rare earths (Article 16). Furthermore, the industry will establish a tracking information system for rare earth compounds (Article 14). It is expected that through these changes in the law, the illegal mining of rare earths will be more sanctioned in the future which could have an impact on the supply of rare earths from China. Higher prices for rare earths might be one of the consequences. However, through the tracking system, a more transparent tracing can be expected. This would justify higher rare earth prices.
9 Conclusion
A strength of heavy rare earth mining is that it is coupled to the production of NdPr. This joint production is an advantage because the demand for NdPr is increasing steadily. A weakness is a strong dependence on just two countries China and Myanmar which account for almost all heavy rare earth mining activities worldwide. However, there are also some opportunities coming up in the next years. First China became a net importer of rare earths in 2019 which should increase the number of rare earth projects outside of China (Xinhua News, 2019).
Also, the prices for rare earth separation are decreasing continuously which makes rare earth processing more economical. Last but not least, electromobility will boost the demand for rare earths much in the following years and decades. The biggest threat for heavy rare earths is the substitution of PMSM motors. By substituting NdPr through Aluminum and Cooper the mining activities of NdPr will decrease which will automatically influence the supply of heavy rare earth elements Dysprosium, Gadolinium, and Terbium. Because mining is concentrated on just two countries‘ regulations, trade wars, export restrictions, natural disasters have a strong impact on the availability of heavy rare earths on the market.
The production capacity of light rare earths is driven by electric vehicles and wind turbines. If no substitution with rare-earth-free motors appears in the market, then the production capacity will increase according to the annual growth rates of Neodymium and Praseodymium. Current market players expect a growth rate of about 8 % which is also incoherence to the annual production plan by Chinese authorities. The MIIT announced a production increase of light rare earths of 7 % in 2020 (MIIT, 2020).
The supply of heavy rare earths could decrease in the future because new laws and regulations should stop illegal mining in Southern China, which is dominated by heavy rare earths Dysprosium, Gadolinium, and Terbium. In the last three years, Myanmar has increased its heavy rare earth mining activities. The capacities developments of heavy rare earths will depend on the development of the mining business in Myanmar and how China will face the issue of illegal mining in Southern China. A possibility of how the supply of heavy rare earths should not decrease is the integration of previously illegal mining into the company structure of the six main manufacturing companies. For that purpose, the companies need to receive a mining license and have to stick to the national regulations.
In conclusion, the joint product analysis showed that the production capacity of Gadolinium Oxide which is used in the pharmaceutical industry is directly influenced by technological developments in the automotive industry. This cross-industry relationship between joint products is frequently seen in the industry and demonstrates that for a complete evaluation of production capacities, the industry of the desired product plus the industry of the main product must be examined.
References
Arafura Resources (2019): Nolans Project Definitive Feasibility Study Summary Report, Perth, Australia.
Arafura Resources (2020): Goldman Sachs Rare Earths Forum, Perth, Australia.
Binnemans, K., Jones, P.T., Müller, T., Yurramendi, L. (2018): Rare Earths and the Balance Problem: How to Deal with Changing Markets?, Journal of Sustainable Metallurgy, 4, pp. 126-146.
BMW Group (2020): BMW GROUP Investor Presentation, Munich, Germany.
Cabezuelo, D., Ibarra, E., Planas, E., Kortabarria, I., Garate, J.I. (2018): Rare-Earth Free EV and HEV Motor Drives: State of the Art,“ PCIM Europe 2018; International Exhibition and Conference for Power Electronics, Intelligent Motion, Renewable Energy and Energy Management, pp. 1-8.
China Northern Rare Earth Group (2020): 中国北方稀土 (集团)高科技股份有限公司 2019 年度报告, Baotou, Inner Mongolia, China (in Chinese).
China Rare Earth Holdings (2020): Annual Report 2019, Hong Kong.
Cui, J., Kramer, M., Zhou, L., Liu, F., Gabay, A., Hadjipanayis, G., Balasubramanian, B., Sellmyer, D. (2018): Current Progress and Future Challenges in Rare-Earth-Free Permanent Magnets, Acta Materialia, 158(2018), pp. 118-137.
Drury, C. (2011): Cost and Management Accounting – An Introduction, 7th ed., Andover, South-Western.
European Commission (2017): Study on the Review of the List of Critical Raw Materials – Executive Summary, Brussels, Belgium.
Glöser-Chadhoud, S., Andre, K., Tercero Espinoza, L. A. (2016): Globale Verwendungsstrukturen der Magnetwerkstoffe Neodym und Dysprosium: Eine szenariobasierte Analyse der Auswirkung der Diffusion der Elektromobilität auf den Bedarf an Seltenen Erden, Working Paper Sustainability and Innovation, No. S05/2016, Fraunhofer ISI, Karlsruhe, Germany.
Goodenough, K. M., Wall, F., Merriman, D. (2018): The Rare Earth Elements: Demand, Global Resources, and Challenges for Resourcing Future Generations, Natural Resources Research, 27(2), pp. 201–16.
Guerbet (2020): 2019 Full-Year Results, Villepinte, France.
Gupta, C.K, Krishnamurthy, N. (2005): Extractive Metallurgy of Rare Earths, CRC Press, Boca Raton, Florida, United States.
Haque, N., Hughes, A., Lim, S., Vernon, C. (2014): Rare Earth Elements: Overview of Mining, Mineralogy, Uses, Sustainability and Environmental Impact, Resources, 3, pp. 614–35.
Horngren, C.T., Datar, S.M., Rajan, M.V. (2012): Cost Accounting – A Managerial Emphasis, 14th ed, London, Pearson.
IAEA (2020): Energy, Electricity and Nuclear Power Estimates for the Period up to 2050, International Atomic Energy Agency, Vienna, Austria.
IEA (2020): World Energy Outlook 2020 – Executive Summary, International Energy Agency, Paris, France.
Kwatiah, N., (2021): Joint Demand and Supply, available at https://www.economicsdiscussion.net/perfect-competition/joint-demand-and-supply-with-diagram/18643, accessed: 20 October 2021.
Lynn, T.A., Oye, M. (2014): Natural Resources and Subnational Governments in Myanmar, IGC, MDRI-CESD, The Asia Foundation, London, United Kingdom.
Marscheider-Weidemann, F., Langkau, S., Hummen, T., Erdmann, L., Tercero Espinoza, L., Angerer, G., Marwede, M., Benecke, S. (2016): Rohstoffe Für Zukunftstechnologien 2016, DERA Rohstoffinformationen, 28, DERA Deutsche Rohstoffagentur, Berlin, Germany.
McCallum, R.W., Lewis, L.H., Skomski, R., Kramer, M.J., Anderson I.E. (2014): Practical Aspects of Modern and Future Permanent Magnets, Annual Review of Materials, 44, pp. 451-477.
MIIT (2019): 工业和信息化部 自然资源部关于下达 2019年度稀土开采、冶炼分离总量控制指标及钨矿开采总量控制指标的通, available at https://www.miit.gov.cn/jgsj/ycls/wjfb/art/2020/art_bdf450bdec0644eebcff9cd396ef0a3c.html, accessed: 15 October 2020 (in Chinese).
MIIT (2020): 工业和信息化部 自然资源部关于下达2020年度稀土开采、冶炼分离总量控制指标的通知., available at https://www.miit.gov.cn/jgsj/ycls/xt/art/2020/art_b0d7f1532c1f484ab9abd01c2b5c9465.html, accessed: 16 October 2020 (in Chinese).
MIIT (2021): 稀土管理条例 available at https://www.miit.gov.cn/gzcy/yjzj/art/2021/art_863f0f1671cf44b28e6ed8cb60eae7f6.html, accessed: 30 January 2021 (in Chinese).
MP Materials (2020a): Powering Progress – Investing in America’s Next-Generation Supply Chain, Las Vegas, Nevada, United States.
MP Materials (2020b): Business Overview & Third Quarter 2020 Results, Las Vegas, Nevada, United States.
NikkeiAsia (2021): China consolidates 3 rare earth miners into ‚aircraft carrier‘, available at https://asia.nikkei.com/Business/Markets/Commodities/China-consolidates-3-rare-earth-miners-into-aircraft-carrier, accessed: 6 January 2022.
Packey, D.J., Kingsnorth, D. (2016): The Impact of Unregulated Ionic Clay Rare Earth Mining in China, Resources Policy, 48(2016), pp. 112–16.
Pöttgen, R., Jüstel, T, Strassert, C.A. (2020): Rare Earth Chemistry, Berlin, Gruyter.
PWC (2019): Oil and Gas, Gems and Jade, Other Minerals and Pearl, Myanmar Extractive Industries Transparency Initiative (MEITI).
Reuters (2021): Minmetals confirms China rare earth merger, creating new giant, available at https://www.reuters.com/world/china/minmetals-unit-confirms-china-rare-earths-merger-2021-12-22/, accessed: 6 January 2022.
Riba, J.R., López-Torres, C., Romeral, L., Garcia, A. (2016): Rare-earth-free propulsion motors for electric vehicles: A technology review, Renewable and Sustainable Energy Reviews, 57(2016), pp. 367-379.
Statista.com (2021a): Total Gadolinium Oxide Demand Worldwide Excluding China from 2009 to 2025, available at https://www.statista.com/statistics/450118/global-reo-gadolinium-oxide-demand-outside-of-china-forecast/, accessed: 10 March 2021.
Statista.com (2021b): China: Anteil am kaufkraftbereinigten globalen Bruttoinlandsprodukt (BIP) von 1980 bis 2019 und Prognosen bis 2025, available at https://de.statista.com/statistik/daten/studie/167632/umfrage/anteil-chinas-am-globalen-bruttoinlandsprodukt-bip/, accessed: 10 March 2021.
Tianyancha (2020): Tianyancha Mobile App, (in Chinese).
USGS (2011-2021): Rare Earths Statistics and Information, available at https://www.usgs.gov/centers/nmic/rare-earths-statistics-and-information, accessed: 10 October 2021.
Widmer, J.D., Martin, R., Kimiabeigi, M. (2015): Electric Vehicle Traction Motors without Rare Earth Magnets, Sustainable Materials and Technologies, 3(2015), pp. 7-13.
Xinhua Indices (2021), Xinhua Rare Earth Price Index, available at http://index.xinhua08.com/jgzs/xitu.shtml, Accessed: 10 February 2021 (in Chinese).
Xinhua News (2019): 中国稀土产业 发展指数报告 2019, China Economic Information Service (in Chinese).
Zhang, Z., He, Z., Xu, Z., Yu, J., Zhang, Y., Chi, R. (2016): Rare Earth Partitioning Characteristics of China Rare Earth Ore, Chinese Rare Earths, 37(1), pp. 121–27 (in Chinese).