
Robustness Maps: A Scenario-Based Framework for Strategic Feedstock Sourcing under Uncertainty
Manufacturers sourcing bio-based, synthetic, and mineral feedstocks face growing uncertainty from regulatory change, climate impacts, and market volatility. Existing approaches, including scenario planning and quantitative optimization, remain loosely coupled and offer limited support for assessing robustness at the level of strategic performance indicators.
This study develops a scenario-based robustness diagnostics framework linking exogenous context drivers, endogenous feedstock dynamics, and Future Performance Indicators (FPIs) within a transparent, semi-quantitative analytical logic. The framework introduces robustness maps, which visualize FPIs, such as demand, availability, price, and carbon footprint, by their expected trend and scenario-dependent volatility across time horizons.
A palm kernel oil case study demonstrates the framework’s application, showing how it can identify system vulnerabilities and inform long-term sourcing strategy. By bridging qualitative foresight and performance-based diagnostics, the framework provides a transferable approach for assessing feedstock robustness and supporting resilient raw-material strategies in the chemical industry and beyond.
Keywords: Robustness diagnostics, Scenario analysis, Feedstock sourcing, Robustness mapping, Foresight analytics, Raw material strategy.
1. Introduction
The global chemical industry is undergoing a fundamental transformation to its resource base. Raw material sourcing is expanding from today’s fossil and mineral feedstocks to include bio-based, recycled, and CO2-derived supply systems (von Vacano et al., 2026). This shift coincides with a period of high uncertainty in supply chains (Roscoe et al., 2022; Kancs, 2023). The global nature of many of today’s supply chains can enable cost savings, but also exposes those involved to the risks of a global footprint. Recent geopolitical disruptions, such as the Russia-Ukraine war, crises in the Red Sea and Strait of Hormuz, and the US-China trade war are putting pressure on global supply chains, and the disruption risks extend beyond geopolitics. Evolving natural disasters and extreme weather, infrastructure disruptions, changing regulation, and pandemics create further uncertainty (WEF, 2026; OECD, 2025), compounding the inherent uncertainty of sourcing itself: e.g., in demand, yields, feedstock availability, and price (Applequist et al., 2000).
Feedstock decisions are business critical and have long-lasting implications in the chemical industry. They directly influence production costs and environmental performance, and uncertainties can lead to material shortages, production stops, and economic losses. Creation or modification of chemical production assets typically requires significant planning and capital investments, and the resulting assets have planned operational lifetimes spanning several decades (Applequist et al., 2000; Seto et al., 2016). Because established supplier networks and supply chain structures can be difficult to change due to scarcity or entrenchment, organizations tend to develop decision-making logics that reinforce existing configurations and align with those of their industry peers (Roscoe et al., 2022). As with carbon lock-in, increasing returns can prevent transitions and inhibit innovation (Janipour et al., 2020). Today’s feedstock and technology choices therefore shape strategic trajectories far into the future, requiring simultaneous consideration of economic, environmental, and supply-related objectives, where a vulnerability in one dimension can undermine overall system performance. For bio-based feedstocks such as palm kernel oil (PKO), the raw material explored in this chemical industry case study, uncertainties can manifest as volatile prices, supply disruptions, shifting environmental requirements, and resulting demand swings (Nair et al., 2024). Regulatory uncertainty is particularly acute for PKO: companies selling palm-based products in the EU must show that their supply chain is deforestation-free under the EU Deforestation Regulation (EUDR) from December 2026, an implementation timeline already twice postponed, from 2023 to 2025 to late 2026 (European Union, 2023).
In supply chain risk management literature low-frequency disruption risks are distinguished from everyday operational uncertainties (Tang, 2006) and resilience is defined as the capacity to prepare for, respond to, and recover from disruptions while maintaining continuity of operations (Ponomarov and Holcomb, 2009; Christopher and Peck, 2004). Robustness, as used in this study, is related but distinct: it describes consistent performance across a range of plausible futures, independent of any single disruption. In uncertain environments, relying on a single forecast or scenario can be akin to making a bet, as the underlying assumptions may themselves become increasingly uncertain. In the terms proposed by Courtney et al. (1997), decision-makers often face high levels of strategic uncertainty for which single-point forecasts are not reliable, warranting a broader analytical toolkit. Robustness analysis supports making better decisions by considering multiple plausible futures (Maier et al., 2016; Kancs, 2023), rather than making better predictions (Lempert, 2019). Strategies (or in this case, feedstocks) performing at least satisfactorily across scenarios are “robust”. The decision-making-under-deep-uncertainty (DMDU) literature has developed a range of formal metrics which operationalize this, including expected-value, higher-order-moment, regret-based, and satisficing metrics (Wald, 1950; Kwakkel et al., 2016; Savage, 1950; Simon, 1956). Comparative studies show that the choice of metric can itself change which alternative ranks best (Herman et al., 2015; Lempert and Collins, 2007; McPhail et al., 2018). The robustness maps developed here adopt a trend-and-dispersion approach conceptually closest to variance-based metrics, but with volatility as the primary risk signal. Section 2 develops this logic in detail.
Two dominant paradigms have emerged for managing uncertainty in strategic sourcing: strategic foresight, particularly scenario planning, and quantitative robust optimization. Strategic foresight and scenario planning should use information of strategic significance to identify emerging risks, opportunities, and potential tipping points (Rohrbeck and Kum, 2018; Wack, 1985), and provide structured narratives of plausible alternative futures and the underlying forces leading there (Schoemaker, 1995; Wilkinson and Eidinow, 2008). Scenario planning has been integrated into supply chain planning to enhance resilience and adaptability (Sardesai et al., 2021), typically structured around STEEP (societal, technological, ecological, economic, political) dimensions (Morrison and Wilson, 1996; Markley, 2011). Its central weakness, identified by Wack (1985) and still unresolved, is the interface between scenarios and decision-makers: without a rigorous link to performance metrics, scenario narratives risk being treated as plausible stories rather than actionable strategic data.
Robust optimization and stochastic programming provide a quantitative counterpart, differing from scenario planning in being heavily grounded in mathematics while serving the same purpose of supporting decisions under uncertainty (Maggioni et al., 2017). Stochastic programming assigns probabilities to scenarios and aims to identify solutions that perform best on average (Santoso et al., 2005), but for long-term horizons such as the one considered in this study (up to 2050), probability estimates become unreliable. Robust optimization instead allows parameters to vary within defined bounds, prioritizing solutions that perform satisfactorily across all futures and are less vulnerable to extreme events (Bertsimas et al., 2011; Pishvaee et al., 2011). These approaches have been applied to the chemical industry, where volatility in raw-material costs, product prices, process yields, and market demand can substantially alter the relative attractiveness of alternative sourcing configurations (Al-Qahtani et al., 2008). Both stochastic programming and robust optimization are decision-focused and mathematically rigorous, but their outputs are often difficult for non-specialists to interpret and communicate, even though well-structured decision aids matter for decision-makers’ success (Lempert, 2019). Further, they offer limited insight into the causal mechanisms driving robustness.
Although numerous methods exist for assessing uncertainty and robustness, the resulting insights are often insufficiently transparent, diagnostic, and transferable for strategic feedstock decision-making. Three limitations stand out. First, qualitative scenario narratives and quantitative assessments are often treated as loosely coupled steps, if not separate activities (Rezaei et al., 2020), giving practitioners little visibility into how qualitative drivers (e.g., supply chain stability) propagate through a feedstock system to influence quantitative indicators (e.g., PKO price). Second, existing approaches typically focus on identifying robust or optimal outcomes, but offer limited visibility into the causal mechanisms generating them, leaving decision-makers without accessible decision aids at the level of concrete key performance indicators—termed Future Performance Indicators (FPIs) in this paper—such as demand, price, availability, and CO2 footprint—even though visual tools for exploring and communicating uncertainty are increasingly recognized as important (Hadjimichael et al., 2024; Shavazipour et al., 2021). Third, existing contributions typically focus on specific sectors, modelling architectures, or decision contexts, lacking a generic, cross-sector framework that enables consistent comparison across bio-based, synthetic, and mineral feedstocks.
Guided by these considerations, the paper addresses the core research question: How can scenario-based robustness of raw material sourcing be represented and analyzed to bridge the gap between qualitative foresight and quantitative strategic indicators? Specifically, the paper develops a framework that (i) integrates qualitative external drivers and quantitative FPIs, (ii) provides practitioners with transparent, visual diagnostics of robustness for deriving actionable insights in sourcing and technology roadmapping and (iii) is widely applicable across sectors and technologies. Its primary contribution is the introduction of robustness maps, a visualization tool that translates complex system variability into an accessible common robustness language, demonstrated through a PKO case study that shows how the framework can inform diversification strategies and resilient raw material management under deep uncertainty.
Building on and extending prior work on robust supply chain optimization and scenario-based planning, the framework is designed to be methodologically neutral with respect to the underlying models while providing a common robustness “language” across sectors. Robustness maps bear a superficial resemblance to established two-dimensional risk-visualization tools, such as the probability-impact matrix in enterprise risk management standards (ISO, 2018) and portfolio-positioning tools like the growth-share matrix (Henderson, 1970), but differ in three ways. First, probability-impact matrices plot the likelihood of a risk event against its consequences, whereas robustness maps plot the expected direction of change of a performance indicator against its volatility across a scenario set, focusing on trajectory rather than occurrence. Second, portfolio matrices position business units or products relative to one another on largely static, or single-period measures, while robustness maps track a set of FPIs across multiple future time horizons. Third, each point on a robustness map is derived from the paper’s approach linking exogenous context drivers to endogenous feedstock dynamics (Section 2), giving it a traceable path back to specific scenario assumptions, which is typically not offered by conventional risk and portfolio matrices based on often unstructured expert judgement.
The remainder of this paper is organized as follows. Section 2 introduces the conceptual framework and its operational logic, with full methodological detail provided in the Methods Appendix. Section 3 applies the framework to the PKO case study, illustrating how the semi-quantitative logic handles real-world volatility in the chemical supply chain. Section 4 discusses strategic implications for Business Chemistry, the framework’s transferability to other resource-intensive sectors, its limitations, directions for future research, and closes with a concluding summary.
2. Conceptual Framework and Methodology
This section introduces the proposed framework for scenario-based robustness diagnostics. The framework is designed as a generic, feedstock-agnostic approach to support strategic decision-making under uncertainty in raw material sourcing. Rather than predicting outcomes or optimizing for a single expected future, it makes robustness transparent at the level of strategically relevant performance indicators, treating robustness as an emergent property of how key performance dimensions behave across structurally different future contexts. The framework is presented starting from its diagnostic output, robustness maps, before tracing the underlying analytical structure that produces them; full methodological detail, formulas, calibration procedures, and a worked example are provided in the Methods Appendix (Section 6).
2.1 Robustness Maps
Robustness maps are the framework’s central analytical interface, capturing uncertainty and directional trend in a single representation (Figure 1). Each Future Performance Indicator (FPI) is positioned in a two-dimensional space defined by its expected directional development (vertical axis, negative to positive trend) and the dispersion of its outcomes across scenarios (horizontal axis, low to high volatility). A boundary along the volatility axis separates robust from scenario-sensitive regions and a boundary along the x-axis separates these into positive and negative directional regions; the Methods Appendix details the available calibration approaches. In the static representation (Figure 1a), each FPI appears as a single point at the long-term horizon; the dynamic representation (Figure 1b) traces its position from a shared present-day origin (T0) at which point, by definition, no directional trend or scenario divergence has yet materialized, through a near-term (T1) to a long-term (T2) horizon, making visible whether an indicator’s robustness profile shifts over time—a strategically significant signal given the chemical industry’s long investment cycles. Robustness maps thus support strategic considerations regarding timing, emerging risks, and adaptation pathways. Importantly, robustness maps are not predictive tools. They function as diagnostic representations that make uncertainty structures visible and comparable.
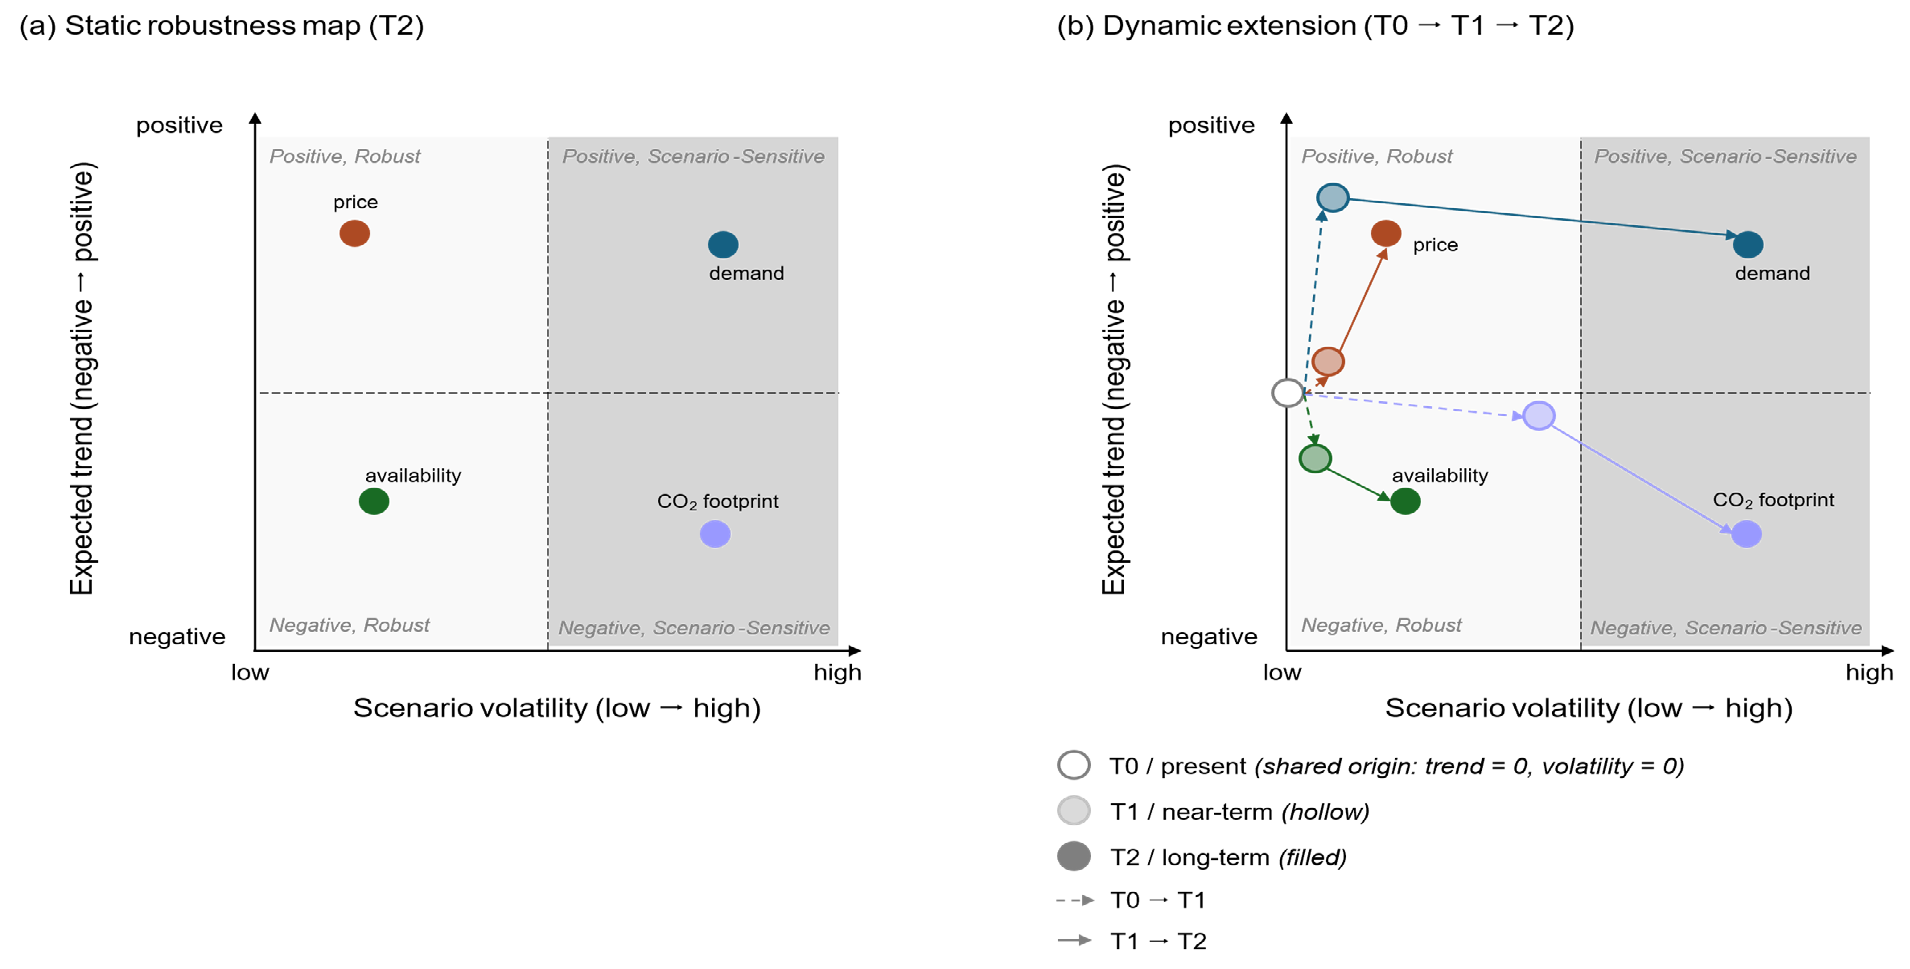
Figure 1. Stylized robustness maps (a) Static representation showing each performance indicator’s long-term (T2) position, and (b) dynamic extension tracing indicator development from a shared present-day origin (T0, trend = 0, volatility = 0) through a near-term horizon (T1) to the long-term horizon (T2, matching panel a). Positions are plotted by expected trend (vertical axis) against scenario volatility (horizontal axis, low to high). The robust/scenario-sensitive boundary is shown here as an equal partition for illustrative neutrality; in applied use, this boundary should be calibrated to the case at hand (e.g., empirically or via a substantive threshold). The figure is illustrative and does not refer to a specific feedstock system.
2.2 Future Performance Indicators (FPIs)
FPIs are strategically relevant outcome dimensions, such as demand, price, availability, or environmental performance, which are selected ex ante against three criteria: materiality for the sourcing decision, availability of reliable directional assessments across scenarios, and interpretability for non-technical audiences. While the specific selection may vary, FPIs provide a consistent reference frame for comparing robustness across alternative feedstocks and sourcing strategies. FPIs are diagnostic indicators, emphasizing directional insight over numerical precision, allowing the framework to remain applicable in contexts where detailed modeling is not feasible. FPIs are typically interdependent, as shown in Figure 3, and trade-offs remain explicit. This multi-dimensional view is particularly relevant in the chemical industry, where strategic decisions involve balancing economic, operational, and environmental objectives.
2.3 Endogenous Feedstock Drivers
Each FPI’s behavior is shaped by endogenous feedstock drivers, which represent the internal structure of a feedstock system and transmit external development context into performance outcomes. Drivers are partially controllable, interdependent, and often affect multiple FPIs simultaneously. These relationships are captured through transparent linkages rather than explicit modeling to maintain interpretability. The use of endogenous drivers provides two key benefits: (i) traceability, linking FPI outcomes to underlying system mechanisms and thereby addressing the translation-logic gap identified in the introduction, and (ii) actionability, highlighting where strategic interventions may influence robustness.
2.4 Exogenous Context Drivers and Scenarios
Exogenous context drivers define the boundary conditions under which feedstock systems operate (e.g., geopolitical dynamics, technological change, climate-related impacts). They are typically identified using a STEEP scan (societal, technological, ecological, economic, political), a structured categorization scheme widely used in strategic foresight to systematically identify weak signals and emerging risks or opportunities across an organization’s external environment (Morrison and Wilson, 1996; Markley, 2011). The exogenous context drivers are identified and assessed in each of a set of scenarios, on their directional development over the relevant time horizons. Together, exogenous context drivers and scenarios define the uncertainty space within which system behavior is explored, thereby defining the starting point for the analytical process by specifying how external conditions are expected to evolve. The framework is compatible with existing sector-specific foresight studies as a source of scenarios and does not require entire new development of scenario sets.
2.5 Operationalization and Analytical Logic
The framework proceeds bottom-up (Figure 2): exogenous context drivers are assessed per scenario and horizon on a standardized directional scale indicating whether it is expected to increase, decrease, or remain stable; these developments are translated into scenario-specific endogenous driver developments; driver developments are aggregated, using expert-informed weights; and the trend and dispersion values are calculated to position each FPI on the robustness map, illustrating expected trends and dispersion across scenarios and evolution of robustness over time. This propagation logic draws on causal loop and influence diagrams from System Dynamics (Sterman, 2000; Forrester, 1961), which has demonstrated applicability to chemical-industry disruption dynamics (Gröne et al., 2019), but deliberately omits closed feedback loops and simulation in favor of a one-pass structure that prioritizes managerial interpretability over dynamic completeness (see Section 4.3). The Methods Appendix reproduces this logic step by step, including a worked numerical example using Global PKO Availability from Section 3, showing exactly how driver scores translate into an FPI’s trend and dispersion coordinates. This stepwise propagation ensures full traceability, allowing users to understand how systems perform and why outcomes emerge. By combining scenario analysis, structured system representation, and intuitive visualization, the framework provides a practical diagnostics tool for assessing feedstock robustness under deep uncertainty.
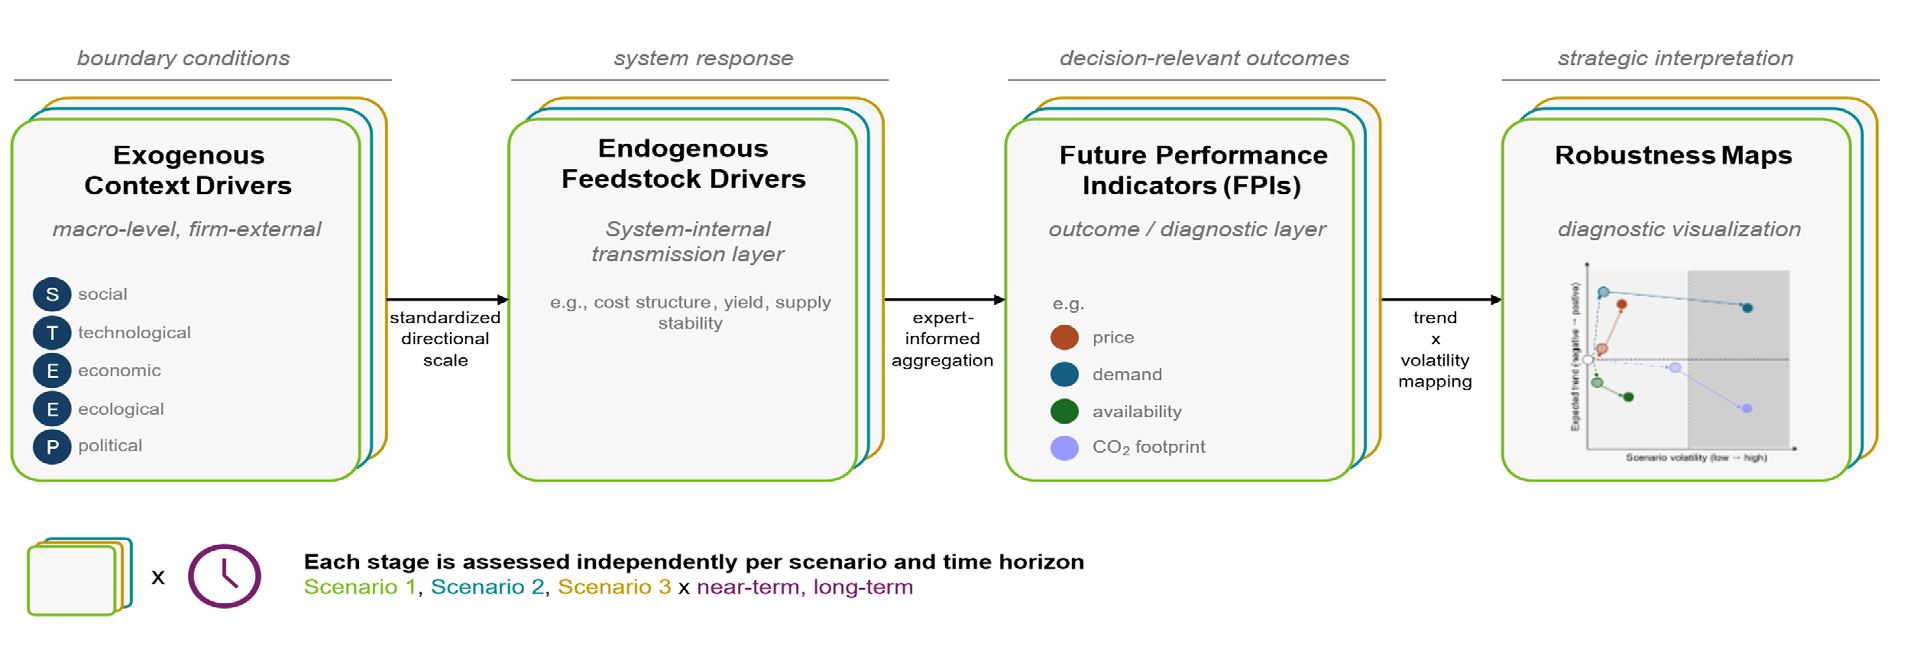
Figure 2. Schematic overview of the robustness diagnostics framework. Linking exogeneous context drivers, endogenous feedstock drivers, and Future Performance Indicators to robustness maps. Stacked outlines indicate that each stage is assessed independently across scenarios and time horizons. The figure is illustrative and does not refer to a specific feedstock system.
3. Palm Kernel Oil Case Study
To demonstrate the applicability of the proposed scenario-robustness framework, the methodology was applied to the case of global PKO sourcing as a future feedstock option for the specialty chemical industry. Bio-based feedstocks are important as substitutes for fossil-based feedstocks at the beginning of value chains or as starting points of their own value chains, as in the case of PKO (von Vacano et al., 2026). PKO and palm oil both come from the oil palm. Palm oil is produced via the fleshy mesocarp and palm kernel oil via the hard kernel of the oil palm (S&P Global, 2025a). PKO represents a strategically relevant renewable feedstock in the specialty chemical industry. Owing to its high content of lauric (C12) and myristic (C14) fatty acids, PKO is widely used to produce fatty acids, fatty alcohols, fatty methyl esters, and other oleochemical intermediates. Coconut oil is the only other natural oil with a comparable composition of lauric oils, making these two not easily substitutable in food and non-food uses (S&P Global, 2025b).
Indonesia and Malaysia are the largest producers of PKO globally, in 2025 producing 8,003,000 metric tons (S&P Global, 2025a). Production is highly geographically concentrated, with over 85% produced in Southeast Asia. Germany is the largest importer and consumer of PKO in Europe. However, exports to Europe from Southeast Asia have declined significantly in recent years. This is in part due to health trends and concern over the high levels of saturated fats in PKO, and also to do with sustainability concerns, as oil palms are linked with deforestation and indirect land use change (S&P Global, 2025a). But at the global scale, consumption is increasing with the expansion of the oleochemical industry. PKO is also highly exposed to regulatory uncertainties, such as the EU Deforestation Regulation, which prohibits import of PKO from deforested land into the EU (European Union, 2023), and the Renewable Energy Directives, which classify PKO as high indirect land-use change risk and caps their contribution to national renewable energy targets via biofuels (European Commission, 2019). PKO is also a first-generation biomass oil crop, scaled for food and feed, and bringing into question topics such as the food versus fuel debate. The future availability, demand, price, and environmental performance of PKO are shaped by the interacting pressures of demand growth, sustainability challenges, climate change impacts, regulation, supply chain stability, and food security among others.
Evonik AG is a purchaser of fatty alcohols on the basis of PKO. Fatty alcohols can be produced from renewable raw materials such as oils and fats or from petrochemical sources. Fatty alcohols, such as lauryl alcohol (C12) are used to manufacture surfactants for detergents, household cleaners, personal care products, shampoos, and cosmetics. An estimated 101,000 metric tons of fatty acids were consumed in the production of fatty alcohols in Western Europe in 2025 and this is expected to grow at a CAGR of 2% till 2029 (S&P Global, 2025b). PKO-derived lauric acid and fatty alcohols are also important building blocks for emulsifiers, lubricants, amines, quaternary ammonium compounds, and other specialty chemicals. Due to its high yield of C12-C14 carbon chains, PKO is particularly well suited for surfactant manufacture and remains one of the dominant renewable feedstocks for detergent-range oleochemicals worldwide. As a result, its long-term availability and resilience have strategic implications for multiple downstream industries, including home care, personal care, industrial cleaning, and specialty chemicals.
Due to the strategic importance of PKO in specialty chemicals, colleagues from research, development, and innovation (RDI), procurement, various business lines, and external interview partners were included in the analysis of the future PKO landscape. The case study illustrates how qualitative scenario analysis can be translated into structured robustness insights for strategic raw material sourcing by systematically linking exogenous context factors to feedstock-specific system characteristics and, ultimately, to decision-relevant performance indicators through robustness maps.
3.1 Applying the Framework to PKO
The PKO assessment follows the previously introduced robustness framework. At the most aggregated level, four FPIs were defined: global PKO demand, global PKO availability, PKO carbon footprint, and PKO purchase price. These indicators capture the central dimensions of feedstock viability for industrial users: market pull, physical accessibility, environmental pressure, and procurement cost. Similar to other robustness-oriented studies, the aim was not to identify a single “best” future (Lempert, 2019), but to assess whether PKO remains strategically robust across multiple plausible futures.
Each FPI was then decomposed into the endogenous feedstock drivers. The feedstock drivers are the internal drivers specific to the raw material system that exert major influence on the PKO system and therefore the trajectory of the FPI. For example, for global PKO availability, these included total plantation area, fresh fruit bunch yield per hectare, PKO extraction potential, and domestic supply chain stability.
Each feedstock driver was explored in a dedicated deep dive to establish its current state and its future development potential. This decomposition allowed the analysis to connect high-level FPI behavior to the operational and structural factors that shape it. Through the deep dives on the feedstock drivers, the exogenous context drivers were identified. For the example of total plantation area, this included drivers such as climate-induced land loss, land-use regulation, investment conditions for agricultural expansion, competition for land, technological innovation in breeding and cultivation, and others.
Through the FPI, endogenous feedstock driver, and exogenous context driver logic, a transparent linkage from the macro-level uncertainties to the feedstock-specific drivers was established. A systems thinking approach was adopted to synthesize these insights and illustrate the interactions and interdependencies in a comprehensive representation of the PKO system (see Figure 3).
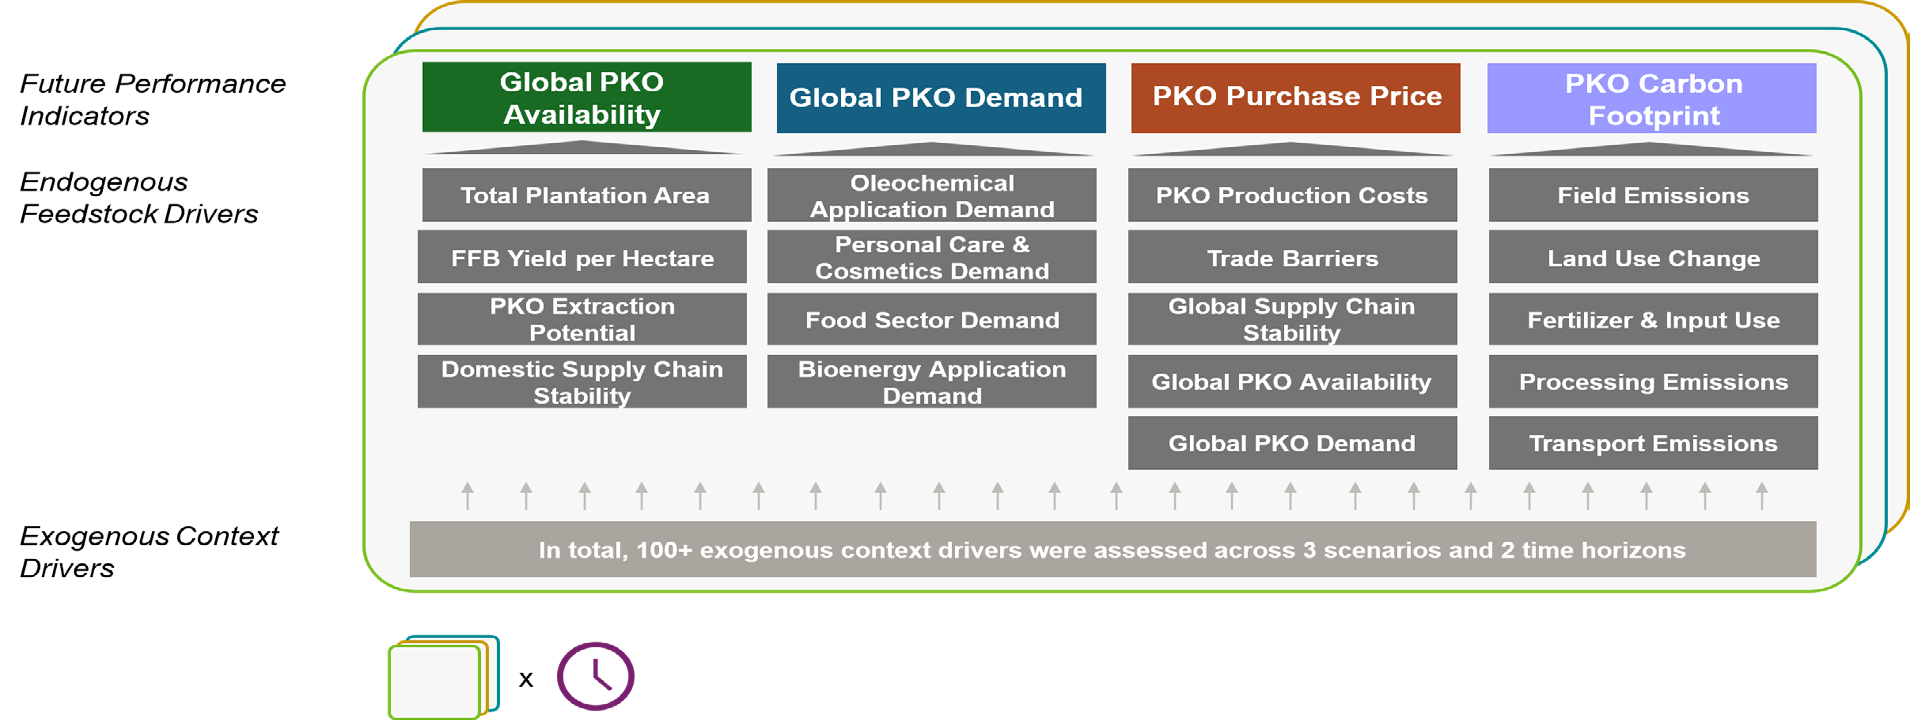
Figure 3. System overview of the palm kernel oil (PKO) feedstock case. The four Future Performance Indicators (FPIs)—global PKO availability, global PKO demand, PKO purchase price, and PKO carbon footprint—are each decomposed into their respective endogenous feedstock drivers, which in turn are shaped by more than 100 exogenous context drivers. The stacked outlines behind each column indicate that both the FPI and its underlying endogenous drivers were assessed independently for each of the three scenarios (Sustainability Paradigm, Deceptive Calm, Turbulent Times) and across both time horizons (2025-2035, 2035-2050).
3.2 Scenario Selection
Once the exogenous context drivers were established, these were evaluated against a set of three pre-existing scenarios. These scenarios are drawn from an externally published global scenario set, the Future(s) of the Specialty Chemical Industry, which describes five plausible futures for the specialty chemicals industry up to 2040 and was developed in a separate foresight exercise. Three of these five scenarios, Sustainability Paradigm, Deceptive Calm, and Turbulent Times, were selected for the present PKO analysis. Of the two scenarios not selected, Digital Champions, centered on the growing influence of digital platforms and technology-driven disruption of value chains, was excluded because its primary drivers were assessed as having comparatively limited direct bearing on the physical, regulatory, and geopolitical dynamics that most directly shape feedstock availability, price, and sourcing risk. Chinese Dream, centered on China’s trajectory toward a dominant, “eco-civilization” role in global affairs, was also excluded: its fast-evolving dynamics were judged to warrant a dedicated, deeper investigation beyond the scope of a global assessment. For this reason, the scenario was examined separately in a China-focused foresight exercise, whose findings may complement the present robustness assessment in future work. The present analysis draws on the published scenario set as its foundation; it does not represent the complete internal decision-making process, which may incorporate additional proprietary considerations not detailed here. Each of the three selected scenarios is briefly characterized below.
The Sustainability Paradigm describes a scenario where sustainability has become the guiding economic principle and driver for innovation, initiated by strong regulatory pressures. Digital technologies, breakthroughs in biotechnology, and cheap electricity from renewable sources enable the transformation into a circular bioeconomy. Companies develop a variety of sustainable solutions to meet the growing demand for green chemicals. The use of fossil raw materials is massively reduced and a circular chemical supply chain is established. Deceptive Calm describes a world that is changing, but slowly and gradually. At first this means stability, strong economic growth, and business-as-usual. The chemical industry profits from this stability, free trade, and growth. But the pressure to change business models, production processes, and raw material bases is low. The search for solutions to major global problems is postponed still further. Eventually the industry faces the consequences of its inactivity. Climate change and the radical measures to mitigate it affect the industry heavily. Turbulent Times is a scenario where globally spreading nationalism is leading to a new era of deglobalization, with global trade wars and increasing protectionism. The liberal world order has been replaced with a conflict-laden multipolar order with less international solidarity, meaning global problems such as climate change are addressed in a piecemeal fashion. The chemical industry is affected heavily by the spiral of tariffs, isolation, and global conflicts. Companies must reconfigure supply chains and localize production to survive.
3.3 Scoring Methodology
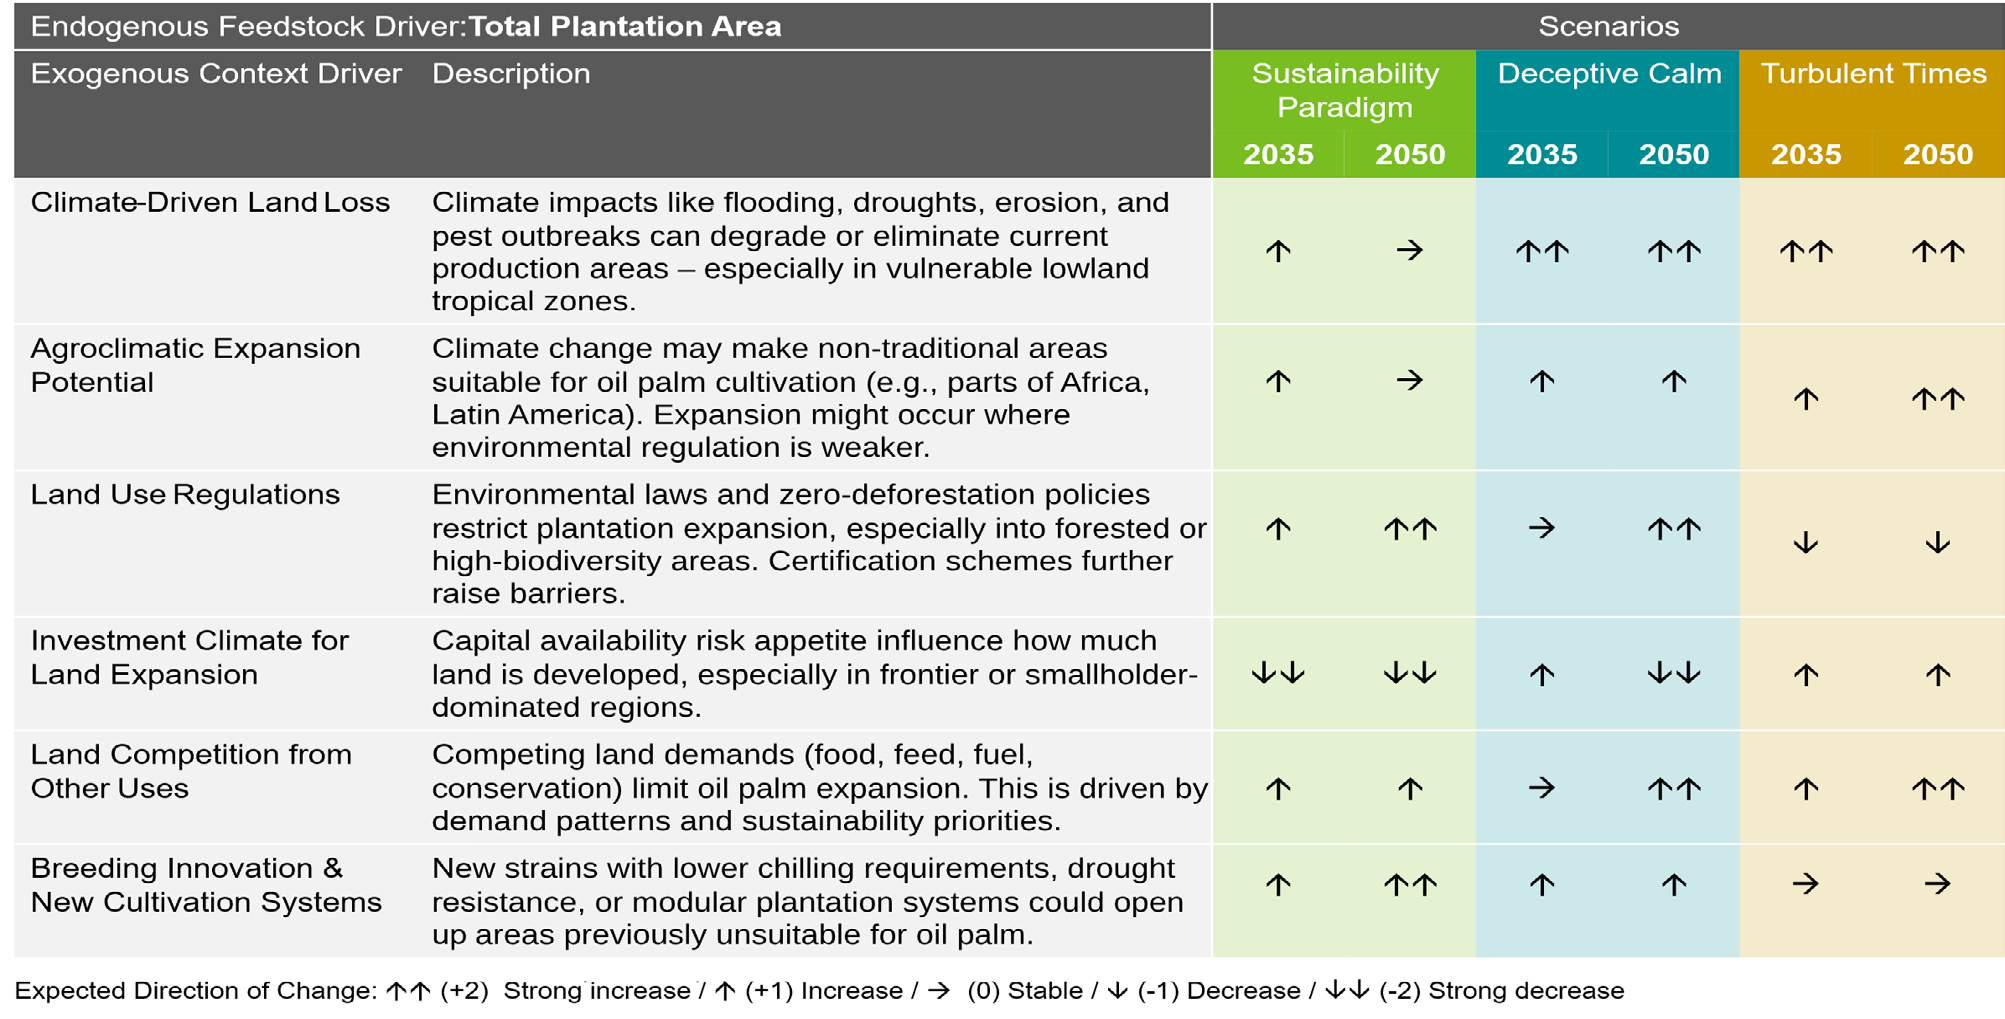
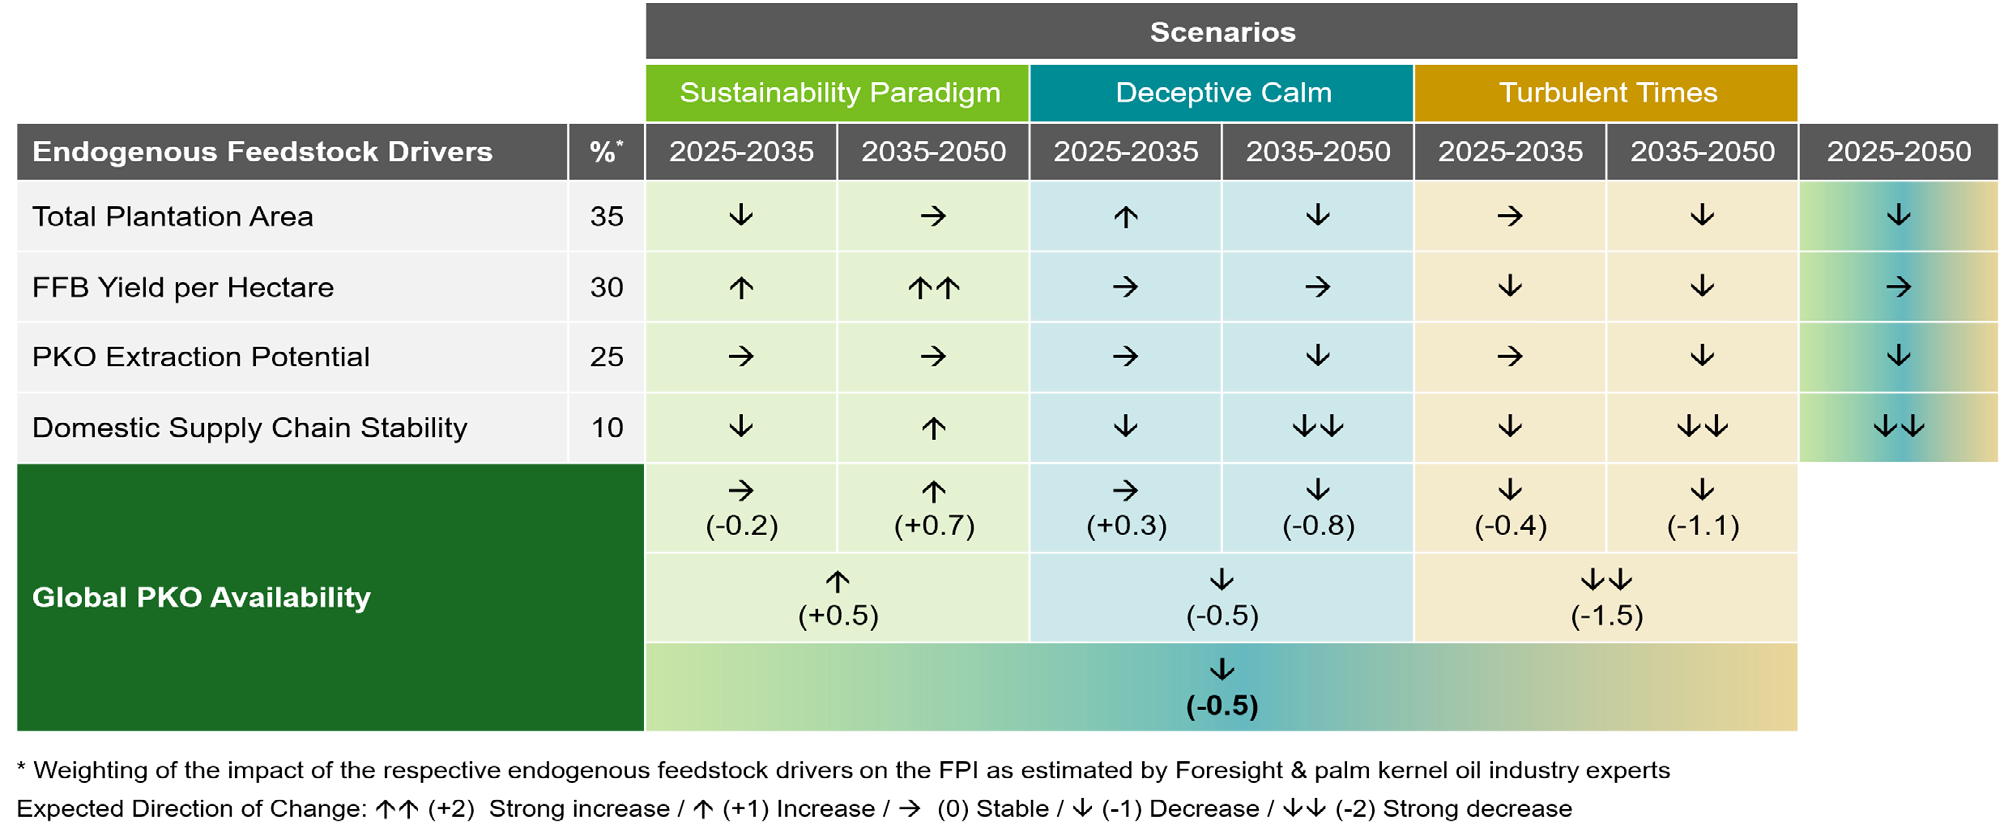
Using the given boundary conditions and developments in each scenario, each context driver was analyzed for its own development in these scenarios. The assessment was done using a qualitative scale ranging from strong decrease to strong increase denoted with arrows. Table 1 illustrates this process for the context drivers underlying total plantation area, one of the endogenous drivers of global PKO availability (see Figure 3). Because some exogenous context drivers relate inversely to the respective endogenous feedstock driver, for instance, stronger land-use regulation reduces rather than increases available plantation area, their scores are sign-adjusted prior to weighted aggregation into Table 2.
Table 1. Exogenous context drivers underlying the endogenous feedstock driver “Total Plantation Area” (see Fig. 3), with their expected directional development across scenarios and time horizons. Arrows indicate the expected direction of change per scenario and horizon, coded from strong decrease (🡓🡓) to strong increase (🡑🡑).
To enable early identification of divergence and enable transitioning pathways and actions on shorter timeframes, the time horizon of the scenario analysis was divided into two segments, 2025 to 2035 and 2035 to 2050. This division can highlight unstable or non-linear development pathways of factors towards their “end-state” in 2050. Division of the time horizon can also be used to prioritize actions in terms of their urgency, prioritizing actions addressed towards developments happening in the shorter term and planning activities for developments that will begin in the future.
For each feedstock driver, the direction of change was derived from the combined influence of its underlying context drivers. The directional assessments were then translated into a simple numerical coding scheme, with strong decrease coded as -2, decrease as -1, stable as 0, increase as +1, and strong increase as +2. The feedstock drivers were given a weight according to expert judgment, reflecting their relative importance for the respective FPI. In the PKO availability case, total plantation area carried the highest weight, followed by yield per hectare, PKO extraction potential, and domestic supply chain stability. Weighted aggregation enabled the transition from qualitative scenario interpretation to semi-quantitative robustness evaluation.
Table 2. Weighted aggregation of endogenous feedstock drivers into the Future Performance Indicator “Global PKO Availability” by scenario and time horizon. Percentages indicate the relative weight of each driver’s influence on the FPI, as estimated by foresight and palm kernel oil industry experts. Driver-level arrows show the expected direction of change; parenthetical values show the resulting weighted scenario score per time horizon, aggregated into an overall scenario score and, ultimately, a single aggregated score across all three scenarios (2025-2050).
3.4 Future Performance Indicator Results
This section presents the resulting robustness profiles for all four FPIs, beginning with global PKO availability as a detailed illustration of the aggregation logic before summarizing the remaining three FPIs and placing all within the robustness maps. Global PKO availability was defined as the total amount of PKO that can be supplied worldwide based on plantation area, yield per hectare, PKO extraction potential, and domestic supply chain stability, and therefore reflects the volume of oil that is realistically accessible in the global market. The results for Global PKO availability illustrate the analytical depth of this approach (see Table 2). In the Sustainability Paradigm scenario, improvements in agricultural practices and technological innovation are offset by structural constraints due to regulatory pressure on plantation area, leading to a stabilization in availability up to 2035, followed by a moderate increase toward 2050 as yield optimization progresses and supply chains become more stable. In contrast, the Deceptive Calm scenario is characterized by limited regulatory pressure, delayed structural adjustments, and delayed but more drastic climate impacts, resulting in stagnating and then declining availability. Under Turbulent Times, the combined effects of climate shocks, geopolitical instability, and supply chain disruptions lead to a pronounced decrease in availability across both time horizons. Despite the differences in paths, the aggregated trend indicates an overall scenario-independent gradual decline in PKO availability over the long term, highlighting structural limitations such as land scarcity and climate exposure.
The same logic was applied to all FPIs. Global PKO demand showed structural growth in market pull in two scenarios, but strong shocks to demand in the third. PKO purchase price tended toward an increase across all scenarios, suggesting persistent cost pressure and limited prospects for structural relief. PKO carbon footprint showed a mixed trajectory, with significant improvements in two of three scenarios, and significant worsening in the third. Taken together, the results suggest a system in which demand remains roughly stable, supply weakens, sustainability improves, and prices increase.
Beyond the four aggregated FPIs formally tracked in the robustness maps, the underlying scenario assessments also support a complementary regional reading, extracted qualitatively rather than mapped onto the axes of the robustness maps themselves. For each scenario, regional insights were also extracted for Asia, the primary production region, the Americas, a minor production region, and Europe, the import region of interest for this case study. Asia remained the dominant production region in all scenarios, but its production volumes became increasingly unstable under adverse futures. The Americas showed latent production potential when investment frameworks exist, but in two of three scenarios, potential was not fully realized because of uncertainty and weak investment signals. Europe remained structurally dependent on imports in all cases, implying persistent exposure to external supply disruptions. These regional patterns highlight that PKO availability is not only a global issue, but also a geographically differentiated robustness problem.
Table 3. Summary of weighted scenario scores for all four Future Performance Indicators (FPIs), by scenario and time horizon. Values are derived through the same weighted aggregation logic illustrated in Table 2 for global palm kernel oil (PKO) availability, applied consistently across demand, availability, carbon footprint, and purchase price. The rightmost column shows the aggregated score across all three scenarios per FPI, covering the full 2025-2050 time horizon.
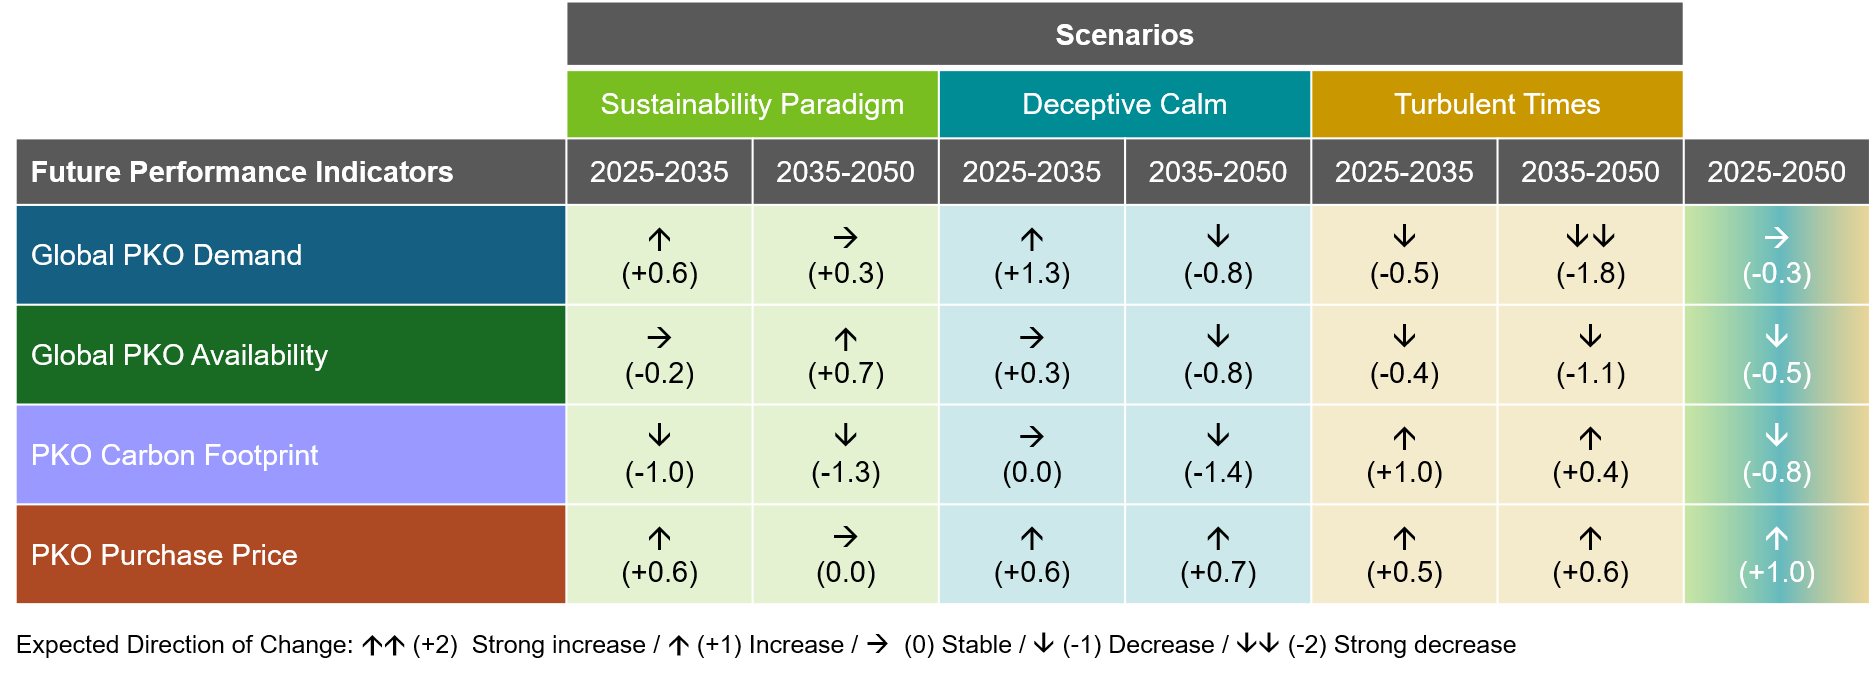
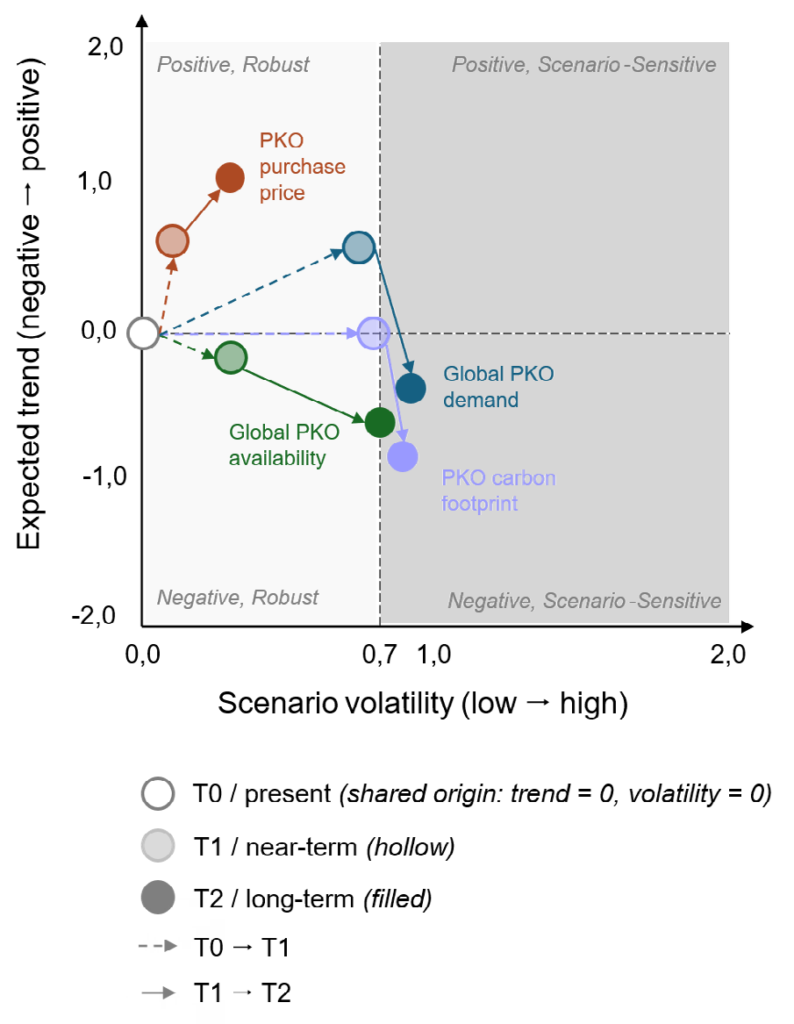
Figure 4. Dynamic robustness map for the palm kernel oil (PKO) case, showing the development of all four Future Performance Indicators (FPIs) from the shared present-day origin (T0) through the near-term horizon (T1) to the long-term horizon (T2), based on the aggregated scenario scores reported in Table 3.
All four FPIs were graphically analyzed using the robustness maps (see Figure 4). The performance indicators were plotted to show their scenario-independent direction of change for both 2035 and 2050 and the volatility, or dispersion, of the directions of change for each scenario. The combined future signal map across all FPIs showed that most indicators exhibit relatively clear directional tendencies rather than highly ambiguous outcomes, with all points either falling within the robust quadrants of the matrix or just passing into the scenario-sensitive quadrants. The robust/scenario-sensitive boundary in Figure 4 is set at a volatility of 0.7. This is a substantively defined threshold (see Methods Appendix): a volatility of 1—indicating maximal disagreement in direction across the three scenarios—was judged too high a bar for an indicator to still count as robust, so the boundary set was set below that level to reflect a more realistic standard of cross-scenario consistency.
For brevity in the discussion of Figure 4 that follows, Sustainability Paradigm, Deceptive Calm, and Turbulent Times are referred to as S1, S2, and S3, respectively. Demand showed initial robust growth, followed by a more scenario-sensitive decrease as biotech alternatives (S1), economic decline (S2 & S3) and trade shocks (S3) emerge. Availability continuously and robustly decreases until 2050 due to decreasing plantation area (all), seed optimization towards palm oil rather than PKO, and supply chain instabilities. The PKO carbon footprint decreases in the long term with stricter regulations and process and agricultural improvements (S1 & S2). The purchase price remains firmly in the robust quadrants and has a strong positive direction of change due to low availability in all scenarios, climate-change induced production disruptions (S2 & S3) and a higher regulatory burden (S1 & S2). The price continues to grow from 2035 to 2050, but weaker than in the first time horizon due to weakened demand. The future PKO landscape shows consistent directional trends across scenarios, suggesting high predictability. The diverse scenario drivers may call for differentiated strategic responses, but the converging FPIs offer a robust basis for planning.
3.5 Implications for PKO Sourcing
The overall result is a robust but unfavorable PKO landscape for future sourcing. The framework shows that PKO is becoming less robust as a feedstock over time because declining availability, rising prices, and growing climate and land-use pressure are not offset by sufficient productivity or technology gains. For strategic decision-makers, this means that PKO should not be treated as a stable long-term anchor material without active risk management. Instead, it should be considered a feedstock that requires diversification, supplier portfolio adjustment, and close monitoring of regional sourcing risks.
At the same time, the case study demonstrates the value of the proposed framework as a decision-support tool. The layered structure makes it possible to trace a FPI outcome back to underlying drivers and context factors, while the robustness maps provide an intuitive visualization of expected trend and volatility. This combination is particularly useful where strategic raw material choices must integrate technical feasibility, supply security, and sustainability constraints across different organizational levels.
From an application perspective, the PKO results can support sourcing strategy, supplier base redesign, and the evaluation of production locations for natural fatty alcohols and other PKO-derived value chains. The framework is especially useful where managers need to compare alternatives not only on current cost or availability, but also on their ability to remain viable under multiple future conditions. The case study displays how scenario analysis and robustness maps can be used as an operational tool for resilient feedstock management in the chemical industry.
4. Conclusion
4.1 Strategic Implications for Business Chemistry
The proposed framework provides a structured approach to assessing feedstock robustness that is directly applicable to strategic decision-making in the chemical industry. The PKO case illustrates this concretely: a single robustness map revealed that availability and price move consistently in an unfavorable direction across all three scenarios, while demand shifts from a robust to a scenario-sensitive signal over time. This is a pattern that would be difficult to communicate from qualitative scenario narratives alone, but is immediately visible once translated into a robustness map.
One key implication lies in feedstock portfolio management. Rather than evaluating raw materials in isolation, robustness maps allow companies to compare multiple feedstocks or sourcing strategies based on their robustness profiles, echoing the logic of diversification as a hedge against uncorrelated risk (Markowitz, 1952). In the PKO case, this logic points toward a concrete action: since availability and price are robustly unfavorable rather than merely uncertain, diversification away from PKO is a more defensible strategy than waiting for the uncertainty to resolve.
The framework also provides valuable insights for procurement and supply chain strategy. By linking external developments to internal system drivers and performance indicators, it becomes possible to identify key sources of vulnerability within supply chains, such as supplier concentration, geopolitical exposure, or dependencies on specific production regions. In the PKO case, this surfaced Europe’s structural import dependence across all three scenarios. This vulnerability persists regardless of which future materializes, and qualitative scenario narratives alone had not made this explicit.
A further area of application concerns technology and innovation management. Decisions regarding the adoption of alternative feedstocks, new processing technologies, or bio-based and synthetic substitutes are often characterized by high uncertainty and long investment horizons. The framework supports these decisions by making explicit how different technological pathways affect performance indicators such as cost, availability, and environmental impact under varying future conditions, providing a basis for robust technology roadmapping (Phaal et al., 2004).
In the context of increasing sustainability requirements, the framework also contributes to integrating environmental considerations into strategic decision-making. The PKO case again illustrates this directly: carbon footprint was the one FPI that improved across most scenarios, even as availability and price worsened—a divergence between economic and environmental trajectories that a single, undifferentiated robustness assessment would have obscured.
Finally, the dynamic extension of the robustness map (Section 2.1, Figure 1b) adds a further strategic dimension: because it distinguishes indicators that merely strengthen within a quadrant from those that cross from robust into scenario-sensitive territory, it can draw attention to emerging vulnerabilities, such as PKO demand’s shift toward scenario sensitivity, before they become acute, supporting earlier and more anticipatory strategic responses than a static assessment alone would allow.
4.2 Transferability to Other Feedstocks and Industries
Although the framework is illustrated using a specific feedstock case, its conceptual structure is designed to be fully transferable across different raw material systems and industry contexts. The key components—exogenous context drivers, endogenous system drivers, FPIs, and robustness maps—are defined at a level of abstraction that allows adaptation to a wide range of applications.
Transferability is primarily ensured through the modular nature of the framework. While the overall analytical logic remains constant, individual elements can be adapted to reflect the specific characteristics of different feedstocks. This includes the selection of relevant FPIs, the identification of system-specific endogenous drivers, and the definition of appropriate context drivers and scenarios. As a result, the framework can be applied to bio-based, fossil-based, or synthetic feedstocks, as well as hybrid systems.
Beyond feedstock sourcing, the approach can also be extended to other domains within business chemistry where uncertainty plays a critical role. Examples include technology portfolio decisions, investment planning, or the assessment of regulatory scenarios. In each case, the framework can be used to structure uncertainty, make system responses transparent, and support strategic decision-making through robustness-based diagnostics.
At the same time, effective application requires context-specific adaptation. The relevance of individual drivers, the structure of scenarios, and the interpretation of FPIs depend on the industry setting and decision context. The framework should therefore be understood as a generalizable analytical approach rather than a fixed model.
4.3 Limitations, Future Research, and Conclusion
Despite its advantages, the proposed framework has several limitations that should be acknowledged.
First, the framework relies on expert-based qualitative assessments, particularly in the evaluation of scenario developments and endogenous driver dynamics. While the use of a standardized directional scale enhances consistency, the results remain dependent on expert judgment and may be influenced by cognitive biases or limited information. This introduces a degree of subjectivity that should be considered when interpreting results.
Second, the framework adopts a semi-quantitative representation rather than a fully dynamic or simulation-based modeling approach. While this enhances transparency and usability, it limits the ability to capture complex feedback loops, nonlinear system behavior, or time-dependent interactions in detail. Dedicated System Dynamics simulations can represent feedback loops, nonlinearities, and time delays more explicitly, as shown in applied quantitative work by Gröne et al. (2019), Glöser et al. (2014) and Glöser-Chahoud et al. (2016); however, developing and calibrating such models is considerably more time-and resource-intensive, and was not feasible within the scope of this study. As a result, the framework is best understood as a diagnostic tool that captures broad directional and relative-magnitude patterns rather than a predictive model capable of precise quantitative forecasting.
Third, the robustness maps are based on relative trends and dispersion, rather than absolute performance levels. While this is consistent with the objective of robustness assessment, it means that the framework does not provide direct guidance on optimal decision choices or precise performance outcomes. Instead, it supports comparative and exploratory analysis.
Fourth, the placement of the robust/scenario-sensitive boundary, set at a volatility of 0.7 in the PKO case (see Section 3, Fig. 4), is itself a judgement call: it was set substantively rather than derived from the data, reflecting the author’s judgment that volatility of 1—full disagreement in direction across scenario—would be too high a bar for an indicator to still count as robust. Although the Methods Appendix outlines several calibration approaches, none is free of subjectivity, and a different threshold, or a different substantive criterion, could shift which indicators are classified as robust. This sensitivity should be kept in mind when interpreting the quadrant assignments in Section 3.
Finally, the quality of results depends on the definition of scenarios and system boundaries. If relevant drivers are omitted or scenarios do not sufficiently capture the range of plausible futures, robustness assessments may be incomplete. Careful scenario design and system mapping are therefore critical for meaningful application.
The presented framework offers several avenues for further development, several of which follow directly from the limitations discussed above.
First, the subjectivity inherent in expert-based directional assessments could be addressed through structured elicitation techniques, such as Delphi-based scoring or inter-rater reliability checks across multiple independent expert panels, to make the degree of assessor agreement transparent and, where possible, reduce subjective bias.
Second, the trade-off between the framework’s semi-quantitative approach and the higher precision of full System Dynamics simulations points toward a hybrid research direction: rather than replacing one approach with the other, future work could explore combining the two: using the present framework for rapid, broad-based screening across many feedstocks, and reserving resource-intensive System Dynamics modeling for the small subset of indicators or drivers flagged as most critical or most scenario-sensitive.
Third, the sensitivity of quadrant classification to the placement of the robust/scenario-sensitive boundary, noted above, warrants systematic investigation. Future work could conduct sensitivity analyses across the three calibration approaches detailed in the Methods Appendix, testing how robustly the strategic conclusions of a given case hold up under alternative boundary placements.
Fourth, while the framework was co-developed with practitioners within the applying organization, it has not yet been applied independently at other companies or tested with decision-makers who were not part of the original assessment team. Future research should include applications at additional organizations, as well as structured feedback from downstream users, i.e., procurement or strategy staff who receive a finished robustness map without having been involved in its construction, to assess whether the diagnosis is interpreted and acted upon as intended.
This study develops and demonstrates a scenario-based framework for the assessment of feedstock robustness under conditions of deep uncertainty. By linking exogenous context drivers, endogenous system dynamics, and FPIs within a structured, semi-quantitative analytical logic, the framework makes robustness observable and comparable at the level of concrete decision-relevant indicators—closing the gap between qualitative scenario narratives and quantitative strategic diagnostics that motivated this study.
Applied to the case of PKO sourcing, the framework surfaces a finding that is not obvious from either qualitative scenario narratives or single-point forecasts alone: PKO emerges as a robust but unfavorable feedstock. Declining availability and rising prices hold consistently across all three scenarios, while only carbon footprint improves; demand, meanwhile, shifts from a robust near-term signal to a scenario-sensitive one further out. This combination of high predictability and unfavorable direction is precisely the kind of insight the framework is designed to reveal, and one that a single-scenario forecast would likely have obscured.
From a business chemistry perspective, the framework offers a practical diagnostics tool that supports the comparison of sourcing options and the identification of system vulnerabilities without requiring specialist modeling expertise. While demonstrated through the PKO case, its modular structure is designed to be transferable to other bio-based, fossil-based, and hybrid feedstocks, as well as to broader strategic questions beyond sourcing.
These contributions should be read alongside the framework’s limitations: its reliance on expert judgment, its semi-quantitative rather than fully dynamic treatment of system behavior, the sensitivity of its robust/scenario-sensitive boundary to calibration choices, and the fact that it has so far been applied and evaluated only within the originating organization. Future research, including structured expert-elicitation methods, sensitivity analysis of the robustness boundary, hybrid approaches combining the framework with dedicated System Dynamics modeling, and application by external organizations and downstream users, can address these limitations directly.
In summary, the framework provides a structured and interpretable way to assess feedstock robustness under deep uncertainty, offering both a generalizable diagnostic tool and, in the PKO case, a concrete example of the kind of counter-intuitive strategic insight it is designed to surface.
Statement of AI Usage
During the preparation of this work the authors used generative AI to support language editing, improve readability, and review the manuscript for inconsistencies. After using these tools, the authors reviewed and edited the content as needed and take full responsibility for the final manuscript. All scientific content, analyses, interpretations, and conclusions were developed and reviewed by the authors.
5. References
Al-Qahtani, K., Elkamel, A., Ponnambalam, K. (2008): Robust optimization for petrochemical network design under uncertainty, Industrial & engineering chemistry research, 47(11), pp. 3912-3919.
Applequist, G. E., Pekny, J. F., Reklaitis, G. V. (2000): Risk and Uncertainty in Managing Chemical Manufacturing Supply Chains, Computers & Chemical Engineering, 24 (9-10), pp. 2211-2222.
Ben-Tal, A., Nemirovski, A., El Ghaoui, L. (2009): Robust Optimization, Princeton University Press, Princeton and Oxford.
Bertsimas, D., Brown, D. B., Caramanis, C. (2011): Theory and Applications of Robust Optimization, SIAM Review, 53 (3), pp. 464-501.
Christopher, M., Peck, H. (2004): Building the Resilient Supply Chain, International Journal of Logistics Management, 15 (2), pp. 1-14.
Courtney, H., Kirkland, J., Viguerie, P. (1997): Strategy Under Uncertainty, Harvard Business Review, 75 (6), pp. 67-79.
European Commission (2019): Commission Delegated Regulation (EU) 2019/807 of 13 March 2019 Supplementing Directive (EU) 2018/2001 as Regards the Determination of High Indirect Land-Use Change-Risk Feedstock, available at https://eur-lex.europa.eu/eli/reg_del/2019/807/oj/eng, accessed 8 August 2026.
European Union (2023): Regulation (EU) 2023/1115 on the Making Available on the Union Market and Export from the Union of Certain Commodities and Products Associated with Deforestation and Forest Degradation, available at https://eur-lex.europa.eu/legal-content/EN/TXT/?uri=CELEX%3A02023R1115-20251226, accessed 8 August 2026.
Forrester, J. W. (1961): Industrial Dynamics, MIT Press, Cambridge, MA.
Glöser, S., Soulier, M., Tercero Espinoza, L., Faulstich, M., & Goldmann, D. (2014): Dynamische Stoffstrommodellierung von Industriemetallen am Beispiel eines globalen und europäischen Kupfermodells. Rohstoffeffizienz und Rohstoffinnovationen, pp. 252-263.
Glöser-Chahoud, S., Pfaff, M., Tercero Espinoza, L. A., & Faulstich, M. (2016): Dynamische Materialfluss-analyse der Magnetwerkstoffe Neodym und Dysprosium in Deutschland. In Proceedings of the 4th Symposium Rohstoffeffizienz und Rohstoffeinnovationen, Tutzing, Germany, pp. 17-18.
Gröne, S., Förster, S., & Hiete, M. (2019): Long-term impact of environmental regulations and eco-conscious customers in the chemical industry: A system dynamics approach to analyze the effect of multiple disruptions. Journal of Cleaner Production, 227, pp. 825-834.
Hadjimichael, A., Schlumberger, J., Haasnoot, M. (2024): Data visualisation for decision making under deep uncertainty: current challenges and opportunities, Environmental Research Letters, 19 (11), art. 11011.
Henderson, B. D. (1970): The Product Portfolio, Boston Consulting Group, available at https://www.bcg.com/publications/1970/strategy-the-product-portfolio, accessed 8 August 2026.
Herman, J. D., Reed, P. M., Zeff, H. B., Characklis, G. W. (2015): How Should Robustness Be Defined for Water Systems Planning Under Change?, Journal of Water Resources Planning and Management, 141 (10), art. 04015012.
International Organization for Standardization (2018): ISO 31000:2018 Risk Management – Guidelines, available at https://www.iso.org, accessed 8 August 2026.
Janipour, Z., de Nooij, R., Scholten, P., Huijbregts, M. A. J., de Coninck, H. (2020): What Are Sources of Carbon Lock-In in Energy-Intensive Industry? A Case Study into Dutch Chemicals Production, Energy Research & Social Science, 60, art. 101320.
Kancs, d’A. (2023): Uncertainty of Supply Chains: Risk and Ambiguity, The World Economy, 47 (5), pp. 2009-2033.
Klibi, W., Martel, A., Guitouni, A. (2010): The Design of Robust Value-Creating Supply Chain Networks: A Critical Review, European Journal of Operational Research, 203 (2), pp. 283-293.
Kwakkel, J. H., Eker, S., Pruyt, E. (2016): How Robust Is a Robust Policy? Comparing Alternative Robustness Metrics for Robust Decision-Making, in: Doumpos, M., Zopounidis, C., Grigoroudis, E.(ed.), Robustness Analysis in Decision Aiding, Optimization, and Analytics, Springer, Cham, Singapore, pp. 221-237.
Lempert, R. J. (2019): Robust Decision Making (RDM), in: Marchau, V., Walker, W., Bloemen, P., Popper, S. (eds.), Decision Making Under Deep Uncertainty, Springer, Cham, pp. 23-51.
Lempert, R. J., Collins, M. T. (2007): Managing the Risk of Uncertain Threshold Responses: Comparison of Robust, Optimum, and Precautionary Approaches, Risk Analysis, 27 (4), pp. 1009-1026.
Maggioni, F., Potra, F. A., Bertocchi, M. (2017): A Scenario-Based Framework for Supply Planning Under Uncertainty: Stochastic Programming Versus Robust Optimization Approaches, Computational Management Science, 14 (1), pp. 5-44.
Maier, H. R., Guillaume, J. H. A., van Delden, H., Riddell, G. A., Haasnoot, M., Kwakkel, J. H. (2016): An Uncertain Future, Deep Uncertainty, Scenarios, Robustness and Adaptation: How Do They Fit Together?, Environmental Modelling & Software, 81, pp. 154-164.
Markley, O. (2011): A new methodology for anticipating STEEP surprises. Technological Forecasting and Social Change, 78 (6), pp. 1078-1092.
McPhail, C., Maier, H. R., Kwakkel, J. H., Giuliani, M., Castelletti, A., Westra, S. (2018): Robustness Metrics: How Are They Calculated, When Should They Be Used and Why Do They Give Different Results?, Earth’s Future, 6, pp. 169-191.
Morrison, J., Wilson, I.(1996): The strategic management response to the challenge of global change. Future vision, ideas, insights, and strategies.
Nair, S. K., Emerson, R. M., Solomon, J. R. (2024): Biomass Supply Chain Risk: Towards a Better Understanding of Feedstock Availability, Cost, Variability, and Uncertainty to Catalyze and De-Risk Biobased Investment, in: Bisaria, V. (ed.), Handbook of Biorefinery Research and Technology: Biomass Logistics to Saccharification, Springer, Dordrecht, pp. 285-312.
OECD (2025): OECD Supply Chain Resilience Review, available at https://www.oecd.org/en/publications/2025/06/oecd-supply-chain-resilience-review_9930d256.html, accessed 8 August 2026.
Pishvaee, M. S., Rabbani, M., Torabi, S. A. (2011): A Robust Optimization Approach to Closed-Loop Supply Chain Network Design Under Uncertainty, Applied Mathematical Modelling, 35 (2), pp. 637-649.
Ponomarov, S. Y., Holcomb, M. C. (2009): Understanding the Concept of Supply Chain Resilience, International Journal of Logistics Management, 20 (1), pp. 124-143.
Rezaei, M., Chaharsooghi, S. K., Husseinzadeh Kashan, A., Babazadeh, R. (2020): Optimal design and planning of biodiesel supply chain network: a scenario-based robust optimization approach, International Journal of Energy and Environmental Engineering, 11(1), pp. 111-128.
Rohrbeck, R., Kum, M. E. (2018): Corporate foresight and its impact on firm performance: A longitudinal analysis, Technological Forecasting and social change, 129, pp. 105-116.
Roscoe, S., Aktas, E., Petersen, K., Skipworth, H., Handfield, R., Habib, F. (2022): Redesigning Global Supply Chains During Compounding Geopolitical Disruptions: The Role of Supply Chain Logics, International Journal of Operations and Production Management, 42 (9), pp. 1407-1434.
Santoso, T., Ahmed, S., Goetschalckx, M., Shapiro, A. (2005): A Stochastic Programming Approach for Supply Chain Network Design Under Uncertainty, European Journal of Operational Research, 167 (1), pp. 96-115.
Sardesai, S., Stute, M., Kamphues, J. (2021): A Methodology for Future Scenario Planning, in: López-Paredes, A. (ed.), Next Generation Supply Chains: A Roadmap for Research and Innovation, Springer International Publishing, Cham, pp. 35-59.
Savage, L. J. (1951): The Theory of Statistical Decision, Journal of the American Statistical Association, 46 (253), pp. 55-67.
Schoemaker, P. J. H. (1995): Scenario Planning: A Tool for Strategic Thinking, Sloan Management Review, 36 (2), pp. 25-40.
Seto, K. C., Davis, S. J., Mitchell, R. B., Stokes, E. C., Unruh, G., Ürge-Vorsatz, D. (2016): Carbon Lock-In: Types, Causes, and Policy Implications, Annual Review of Environment and Resources, 41, pp. 425-452.
Shavazipour, B., López-Ibáñez, M., Miettinen, K. (2021): Visualizations for decision support in scenario-based multiobjective optimization, Information Sciences, 578, pp.1-21.
Simon, H. A. (1956): Rational Choice and the Structure of the Environment, Psychological Review, 63 (2), pp. 129-138.
Sterman, J.D. (2000): Business Dynamics: Systems Thinking and Modeling for a Complex World. Irwin/McGraw-Hill, Boston, MA.
S&P Global (2025a): Fats and Oils Industry Overview, Chemical Economics Handbook, available at spglobal.com/commodityinsights, accessed 8 August 2026.
S&P Global (2025b): Natural Fatty Acids, Chemical Economics Handbook, available at spglobal.com/commodityinsights, accessed 8 August 2026.
Tang, C. S. (2006): Perspectives in Supply Chain Risk Management, International Journal of Production Economics, 103 (2), pp. 451-488.
von Vacano, B., Hübinger, W., Muganda, W., Kolios, G., Schaffrannek, T., Kindler, A., Ehrhard, K., Weber, M. (2026): Transforming the Chemical Industry: A BASF Perspective on Net-Zero and Circularity, RSC Sustainability, 4 (3), pp. 1304-1326.
Wack, P. (1985): Scenarios: Shooting the Rapids, Harvard Business Review, 63 (6), pp. 139-150.
Wald, A. (1950): Statistical decision functions,in: Kotz, S., Johnson, N.L. (ed), Breakthroughs in Statistics: Foundations and Basic Theory, Springer New York, New York, pp. 342-357.
WEF (2026): Global Risks Report 2026, available at https://www.weforum.org/publications/global-risks-report-2026/, accessed 8 August 2026.
Wilkinson, A., Eidinow, E. (2008): Evolving Practices in Environmental Scenarios: A New Scenario Typology, Environmental Research Letters, 3 (4), art. 045017.
6. Methods Appendix
This appendix provides the methodological detail summarized in Section 2: the selection criteria for Future Performance Indicators (FPIs), the role of endogenous and exogenous drivers, the available approaches for calibrating the robustness/scenario-sensitivity boundary, and a full worked example of how robustness-map coordinates are derived.
FPI selection criteria.
FPIs are defined ex ante based on their strategic relevance. Relevance is assessed against three criteria: materiality for the sourcing decision at hand (i.e., whether the indicator meaningfully influences procurement, investment, or technology choices), availability of sufficiently reliable directional assessments across scenarios, and interpretability for non-technical stakeholders, so that the resulting robustness map remains accessible to cross-functional audiences rather than requiring specialist modeling expertise. In the context of chemical feedstock sourcing, typical FPIs include demand, availability, price, and environmental performance (e.g., carbon footprint). FPIs are typically interdependent rather than reducible to a single metric—for example, PKO Purchase Price’s drivers include Global PKO Availability and Global PKO Demand (see Figure 3)—so that trade-offs between cost, availability, and sustainability remain explicit rather than being aggregated away.
Endogenous and exogenous drivers.
Endogenous feedstock drivers represent the internal structure of a feedstock system and act as the transmission layer between external context and FPI outcomes. They can be grouped into recurring categories—sourcing structures, technological performance, cost structures, supply chain stability, and environmental characteristics—operationalized differently depending on the feedstock (e.g., through production costs, yield levels, supply resilience, land use, or emissions). Drivers are neither fully controllable nor entirely exogenous: some can be influenced through strategic decisions such as diversification or technological investment, while others are largely constrained by system characteristics. Drivers are also interdependent, with individual drivers often affecting multiple FPIs simultaneously; rather than explicitly modeling all interactions, the framework captures these relationships through transparent, expert-informed linkages that preserve interpretability.
Exogenous context drivers define the boundary conditions under which these internal dynamics unfold. They are typically identified using a STEEP scan, societal, technological, ecological, economic, and political dimensions (Morrison and Wilson, 1996; Markley, 2011), and, in feedstock sourcing, include regulatory developments, global demand trends, climate-related impacts, geopolitical dynamics, and technological change. Scenario development does not necessarily require the creation of new scenario sets: the framework is compatible with existing, sector-specific foresight studies (e.g., explorative industry foresight scenarios on the future of specialty chemicals, or national-level scenario studies on the chemical, pharmaceutical, and biotechnology sectors), which can be adopted as structured inputs to enhance both the credibility and efficiency of the analysis. For each scenario, exogenous context drivers are assessed for their directional development over the relevant time horizons, grounding scenario narratives in a traceable, semi-quantitative structure rather than leaving them as free-standing qualitative stories. They do not determine outcomes directly but provide the structured inputs that are propagated through endogenous feedstock drivers and ultimately reflected in the development of FPIs.
Boundary calibration approaches.
The plane of a robustness map is divided into four regions—positive/robust, positive/scenario-sensitive, negative/robust, negative/scenario-sensitive—by a boundary along the volatility axis. In the stylized illustration in Figure 1, this boundary is set as an equal partition of the axis, so that low- and high-dispersion regions receive equal visual weight; this keeps the illustration neutral but does not reflect the empirical distribution of any specific case. In an applied setting, the boundary should instead be calibrated to the case at hand. Possible calibration approaches include: (i) a symmetric split, as exampled in Figure 1, which is the most transparent default but arbitrary with respect to the actual data; (ii) a data-driven threshold, for example placed at the median or mean dispersion observed across all assessed FPIs or drivers, so that the boundary reflects the empirical spread of the specific case; or (iii) a substantively defined threshold, tied to a concrete interpretive criterion—for instance, that volatility below the threshold corresponds to less than one coding step of directional disagreement across scenarios (this is the approach used for the PKO case, see Section 3.4). Regardless of approach, the placement of the boundary should be reported explicitly, as it directly determines which indicators are classified as robust (see the Limitations in Section 4.3).
Deriving robustness-map coordinates.
Robustness-map coordinates are derived bottom-up in three steps.
Step 1: Directional scoring. For each scenario and time horizon, every exogenous context driver and endogenous feedstock driver is assessed on a standardized five-point directional scale: strong decrease (−2), decrease (−1), stable (0), increase (+1), strong increase (+2). Where a context driver relates inversely to the endogenous feedstock driver it feeds into (e.g., stronger land-use regulation reduces rather than increases available plantation area), its score is sign-adjusted before aggregation.
Step 2: Weighted aggregation to the FPI trend (vertical axis). Each endogenous feedstock driver is assigned a weight, based on expert judgment, reflecting its relative importance for the FPI it feeds into. An FPI’s trend value for a given scenario and time horizon is the weighted sum of its drivers’ directional scores.
Worked example: Global PKO Availability (Section 3). Global PKO availability is decomposed into four endogenous drivers: total plantation area (weight 35%), fresh fruit bunch (FFB) yield per hectare (30%), PKO extraction potential (25%), and domestic supply chain stability (10%) (Table 2). For the Sustainability Paradigm scenario, 2035–2050: total plantation area is stable (0), FFB yield shows strong increase (+2), PKO extraction potential is stable (0), and domestic supply chain stability shows increase (+1). The weighted trend value is:
(0.35 × 0) + (0.30 × (+2)) + (0.25 × 0) + (0.10 × (+1)) = 0 + 0.60 + 0 + 0.10 = +0.70
which matches the value reported in Table 2. The same calculation applied to the 2025–2035 period, and summed across both periods, yields each scenario’s long-term (2025–2050) trend value: +0.5 for Sustainability Paradigm, −0.5 for Deceptive Calm, and −1.5 for Turbulent Times. Averaging across the three scenarios gives the vertical-axis (trend) position plotted in Figure 4: −0.5, reflecting a scenario-independent gradual decline in availability over the long term.
Step 3: Deriving dispersion (horizontal axis). The horizontal-axis value for an FPI at a given time horizon is the population standard deviation (SD) of its three scenario-specific weighted trend values from Step 2 — that is, how differently the scenarios develop, rather than how strongly or in which direction the FPI moves. SD is calculated as √(Σ(xi − x)² / n) where xi is each scenario’s weighted trend value from Step 2, x is the mean of those three values, and n is the number of scenarios (n = 3). For Global PKO Availability, 2035–2050, the three scenario values from Table 2 are +0.7 (Sustainability Paradigm), −0.8 (Deceptive Calm), and −1.1 (Turbulent Times):
x = (+0.7 + (−0.8) + (−1.1)) / 3 = −0.4
SD(+0.7, −0.8, −1.1) = √[((0.7 − (−0.4))² + ((−0.8) − (−0.4))² + ((−1.1) − (−0.4))²) / 3] ≈ 0.79
This is the value plotted on the horizontal axis in Figure 4. Because dispersion reflects divergence between scenarios rather than the direction or magnitude of change, two FPIs can share the same negative trend yet fall into different quadrants—one robust, one scenario-sensitive—depending on how consistently the scenarios agree on that direction. Global PKO Availability is used here only to illustrate the calculation; the same two-step procedure (Steps 2–3) is applied identically to each of the other three FPIs (Global PKO Demand, PKO Purchase Price, PKO Carbon Footprint). The resulting trend and dispersion values for all four FPIs are summarized in Table 3 and plotted together in Figure 4.