“Sensory Fit Panel” – Development of a new Advertising Claim Support method to assess aesthetic diaper fit performance in an objective, reliable and reproducible way.
Abstract: For the product design of diapers, the fit on the baby plays a significant role. In particular, innovation in the areas of fit and freedom of movement have become increasingly important as lower order needs like leakage are sufficiently met by most products. Today’s methods to measure diaper fit focus on technical measurements (engineering and technical fit) and parents’ subjective perceptions. While these methods are useful tools for product development purposes, they are not seen as sufficient for Advertising Claim Support needs. However, when a new fit innovation should be advertised, particularly when this is done in a competitive way, a robust technical support is needed to defend this claim in case of challenges by competitors or regulatory bodies. For this purpose, methods need to be objective and technically sound in order to be acceptable to advertising regulatory bodies. Independent, objective ratings would substantiate claims on a more reliable and reproducible base. To meet this need, the diaper fit sensory panel method was developed. This test reapplies the established sensory methodology used, e.g. to assess taste or smell in food and beverages.
Introduction
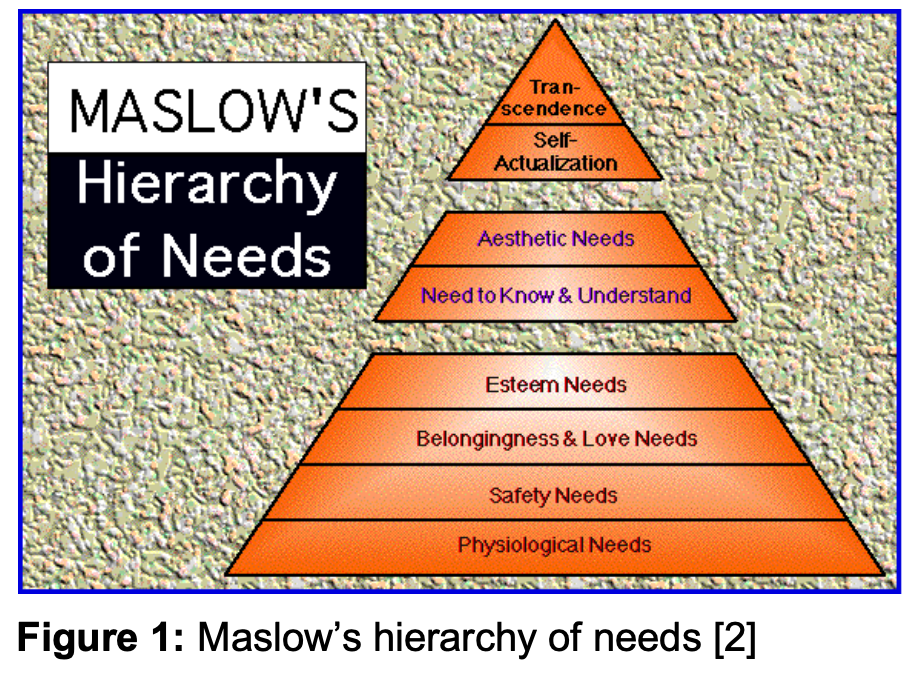
Nowadays, unlike in the past, most consumer goods are fully developed technically and consumers no longer buy a product based only on its leading position concerning technical attributes. Related to Maslow’s hierarchy of needs, the basic concept depends on two groups: deficiency needs and growth needs. That means that the deficiency need in a lower hierarchy level must be satisfied, before the deficiency need of the next level is detected [1]. In the case of diapers it means, that all basic needs (the first five levels in fig.1) are today satisfied and hereby the new level of aesthetic needs is reached.
Because of this fact, branded products are no longer only created on a technical basis. The design and the aesthetics are what make a product unique and unmistakable. Therefore, one marketing strategy for brands in the mature state of the product life cycle is the “strategy of a better styling”[3].
In case of “Pampers,” the “product life cycle” started with the product introduction in the German market in 1973 [4], followed by a big growth phase that reached maturity; on the one hand, this caused the biggest turnover, but on the other hand, Pampers suffered as competitors copied their product and came up with their replicas [5]. This means that with the “strategy of a better styling,” the advertising of a consumer good like “Pampers” is focused on superior aesthetics and design related factors such as thickness of a diaper.
This advertising needs to be supported by technical data delivered via a robust Advertising Claim Support strategy. A claim is considered as any communication by an advertiser about a product, that consumers are likely to understand to be a representation of fact. This is related to any type of external communication about products independent from the media. External requirements (laws, regulations) as well as company guidelines (e. g. Procter & Gamble’s Advertising guidelines) require that claims need to be supported by sound technical and scientific data, and that this support is properly documented. This documentation conforms to legal and regulatory requirements, defined in most countries’ marketing laws and controlled often by regulatory bodies. False claims can lead to civil fines or even criminal convictions. In addition, false claims are a significant public relations risk, as claims detected as false and misleading can create negative media coverage, which can damage relationships to governmental bodies and competitors and can even destroy consumers’ trust in a brand. Therefore, advertising claim support is an essential part of any advertising development.
To support a claim in a subjective area, like taste or wearing comfort, still an objective and reproducible method is required to support the claim. In the case of diaper fit performance, a method was developed, which measures the subjective impression of aesthetics in an objective, reliable and reproducible way. This method is called “Sensory Fit Panel” and it is building on the established method of sensory testing known, for instance, from food and beverages. The aims which go beside the initialization of such a new objective method are the knowledge if all test instruments are necessary and whether the questionnaire can be abbreviated.
In this paper the first outcomes of this new assessment method are presented, structured as followed. In the first part, background information about Advertising Claim Support, the different definitions of fit and sensory testing are given. In the second part, the idea, realization and accomplishment of “Sensory Fit Panel” is explained, followed by the results of this pilot study. In the final part, we confirm that the first results of the new method meets the requirements for Advertising Claim Support; a comparison with commonly used consumer panels is presented to relate the test to reality.
2. Background and Current Situation
In the diaper industry claims concerning fit have become more frequent in recent years. This is a reaction to the evolution of consumer needs towards higher order needs.
In general diaper fit can be split into three areas: engineering fit, technical fit and aesthetic fit.
2.1 Fit
2.1.1 Engineering fit (fit elements related to the mechanics of a diaper)
Engineering fit is the mechanics of the interaction between the diaper and the child. Therefore, measuring the strength and location of diaper pressure on the body, as well as force distribution throughout the diaper is necessary.
2.1.2 Technical fit (fit elements related to the sizing)
Sizing includes two aspects. The first one is the range, a product’s geometry can accommodate technically, for example via it’s dimensions and elastic parts. The second aspect is the consumers’ perception of size, which does vary between regions because of cultural differences and different habits.
2.1.3 Aesthetic fit
Aesthetic fit is difficult to quantify in terms of chassis attributes and properties. It can be driven by colour, style, cut, softness, etc. Also regional bias, like chassis design, plays in this case an important role. All these items are difficult to measure and quantify.
These definitions were achieved by fit studies, which generate qualitative and quantitative learnings. Fit studies are used for various reasons such as: issue resolution, screening of multiple design options, collection of baby measurements to develop design criteria, development of a technical fit model, test or confirmation of a hypothesis and generation of consumer and technical data.
To achieve these two kinds of data three different methodologies exist, which are technical/lab methods, consumer studies and on- baby tests. The first area creates technical data by using objective methods, for example material properties regarding stretch performance of elastics. In contrast to this, the consumer studies use subjective measurements. Hereby panels are placed with consumers to compare diapers under real conditions. Diapers are given to a representative number of parents with children that use the same diaper size. During the usage period, the parents are asked to fill in a questionnaire to assess the product performance
On-baby tests are currently the best test method to support the reliability of the claims on diapers, because it simulates real life conditions in a controlled environment. In these methods usually a combination of subjective and objective measurements are used. Part of this is, for instance, skin dryness measurements using standardized bio-engineering methods on real babies.
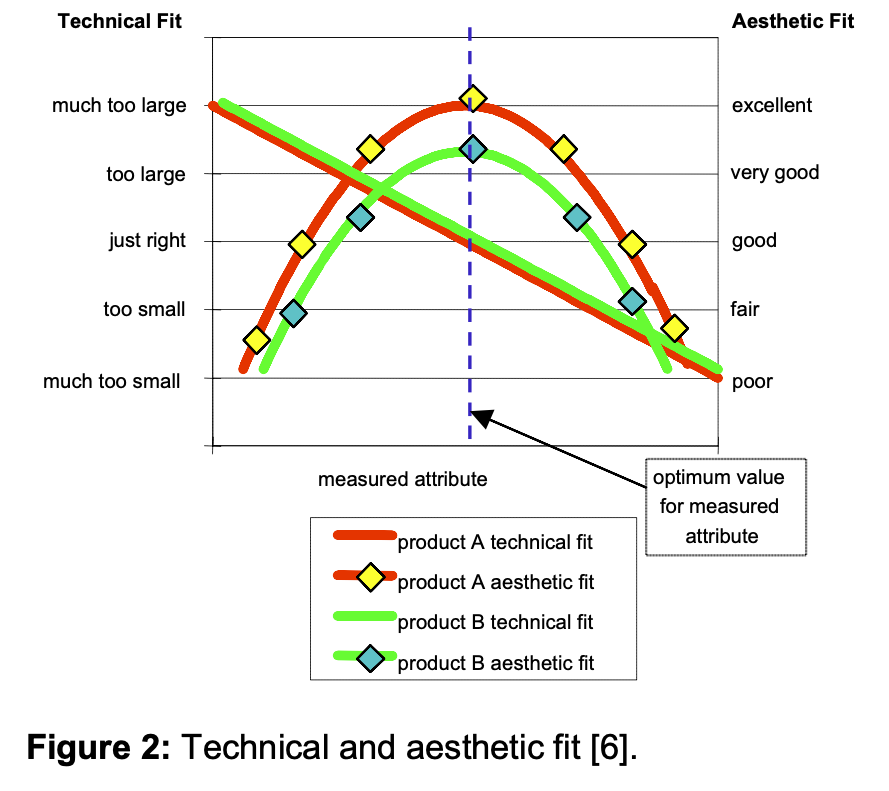
If fit is measured with these different kinds of data generations, the differences between the various types of fit get visible (fig. 2). For engineering and technical fit accurate models can be constructed. By the use of these models, product geometry has been optimized to deliver “just right” regarding technical fit over a selected range of babies. At any rate, there is a big gap between engineering, technical and the unknown features of aesthetic fit. Looking at fig. 2, two different products have the same progression for technical fit, but not for aesthetic fit. Thus, it appears that if technical fit is evaluated with “just right”, there is no guarantee that aesthetic fit is rated in the same way with “excellent”. The widely unexplored factor of aesthetic fit influences the fit perception of mothers in a strong way.
To introduce standardized methods to assess the influence of aesthetic fit, where so far only experimental approaches have been made, the “Sensory Fit Panel” was developed. The idea was to build this method on the methodology of sensory testing, an established approach in assessing properties in the food and beverages industries for example (e. g wine tasting).
2.3 Sensory Testing
“Sensory Test is an examination of some or all aspects of products that are perceived by the five senses” [7]. Sensations, such as vision, hearing, smell, taste and touch, are a functional basis for life and survival. The human sense organs are very specific, very sensitive and easily available. Since these are the best conditions of a measuring instrument, the idea of sensory methods is to use the human senses as measuring instruments.
Human and physical instruments work in a comparable manner: each of them detects a stimulus, for instance, a noise. The physical measuring instrument uses a detector and the raw data is sent via an amplifier to the computer that processes the data and hands the result out to the printer, which makes it visible for other people. The process is the same as for a human measuring instrument. For example, noise is detected with sense cells in the ear and the raw data is transmitted via the nervous system to the brain. There the raw data is processed into the results and turned into action, e. g. sent to the hand, which writes them down.
However, there are also a lot of differences between those two instruments. The single components of a physical measuring instrument can be freely chosen and combined in a way concerning the solution of the problem. Furthermore it can be specifically programmed. This is in contrast to the human measuring instrument, which works as a unit and is already programmed from life experience. However, humans can also be chosen, motivated and trained. To achieve the best results in sensory testing, the panelists must be trained and calibrated, because “an observer must be put in the frame of mind to understand the characteristics and what he should measure” [8]. This is the most important thing to achieve good results [9]. Human measuring instruments are mostly used in areas where there is no other way to measure properties in an objective way, for example the design of a product.
3. Sensory Fit Panel
The fundamental idea of the “Sensory Fit Panel” is to apply sensory testing to evaluate the appearance of a product, in this case the appearance of a diaper while it is used by a baby . The test objective was to allow an objective comparison on the fit of different diapers and an analysis of the attributes influencing this difference. The initial set-up was based on earlier global studies [10] done to explore the attributes of aesthetic diaper fit.
3.1 Realization of the Sensory Fit Panel pilot test
3.1.1 Brain writing
The first step for building up a panel is the recruitment of the right panelists.
3.1.1.1 Panelists
The demands on the panelists are the accuracy of discrimination, the interest to work with their own sensations, the ability to think analytically in complex situations, and a strong personality to achieve a reproducibility of the results without bias. Furthermore, they must have good availability, be communicative and have a good relationship to the panel leader. Additional requirements in the case of the “Sensory Fit Panel” are that the panelists must be female, because they normally have a stronger look on details as well as a stronger observation. As a last requirement, they have to have children in aged approximately five years. Thus it is guaranteed that they have experience with the basic technology of modern diapers, but also that they are not involved in the current diaper market.
3.1.1.2 Brain writing session
To select panelists meeting these requirements a brain writing session was initialized.
Brain writing is similar to brain storming, but the people write down for themselves what comes spontaneously to mind. They were looking at four completely different types of diapers, which were presented on a torso as well as on babies. The different babies, regarding weight and size, represent the large variety of baby dimensions and make the brain writing more reliable and credible. The babies wore each diaper first 15 minutes unloaded and afterwards 15 minutes loaded with 180ml warm saline solution. The diapers were completely different regarding chassis and core design.
As a result we found, that the 15 panelists all found consistently the same design attributes important for diaper fit. Due to the fact that these attributes could only be detected by persons who meet the required and above mentioned characteristics, this brain writing confirmed that comparable (and consistent) panelists had been chosen.
3.2 Questionnaire Development
To measure the subjective perception of aesthetic fit in an objective way a questionnaire was developed. It is based on the design attributes worked out by the panelists. The questionnaire consists of two parts. The first part was called “subjective” and is composed of hedonic questions, for instance “How well do you like the fit in general?” or “How well do you like the fit at crotch?”. The panelists have to rate on an eight point rating scale, going from poor to excellent.
In the second part, the panelists compare different attributes of the diaper with the images of a morphing scale. The morphing scale is used as reference and allows an objective assessment of the individual impressions. For example, for the objective question “Please, assess the height at waist,” the panelists compared the images with the diaper on the test instrument and rated for instance, image number five, which means she rated also point five of the rating scale.(fig.3)
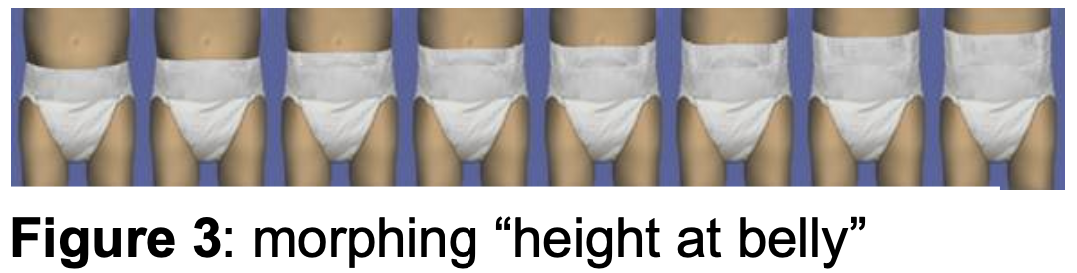
Further examples of questions regarding this part of the questionnaire are: height and thickness of the diaper concerning the different fit attributes, like crotch, belly, bottom, etc.. The two anchor points of the objective questionnaire represent two extremes. For example for “height at belly” these two points are “low” and “high”. The left side represents the lower distinctive attribute and the right side the higher distinctive one.
For both parts of the questionnaire a rating scale with an even number of points is used instead of the common rating scale with uneven numbers (typically 5, 7 or 9), because it was desired that the panelists decide between the two halves of the scale to get distinctive results. The two parts of the questionnaire were linked together via a factor regression analysis.
3.3 Test Instruments
In this pilot study, the samples were presented with three different test instruments–baby, picture and torso–to allow for the best presentation of the test products. One part of the following analysis focused on finding out whether all three instruments were really necessary.
3.3.1 Baby
The first test instrument is the baby, where aesthetic fit can be rated under realistic, dynamic conditions. This means, that it is for instance possible that the diaper slips during movement. While this test instrument represents the reality in the best way, the acting baby can cause deflection of the panelists. For enabling the reproducibility of the test, all babies must have the same stage of development. With the different stages of development the baby shape change. For example a lying baby usually has a big abdomen and chubby legs, while walking babies tend to have thinner abdomen as well as thin legs. For this test only babies that could already walk were chosen. But even between walking babies are usually big differences, a baby could be small and thick or tall and thin.
In previous work within Procter & Gamble it was found, that babies can be divided into 9 groups all representing different shapes and weight/height relationships. In the case of this pilot study only the average group of babies were taken–those with middle height and middle weight.
In a future study, the results of the pilot study will need to be confirmed for the remaining groups.
3.3.2 Picture
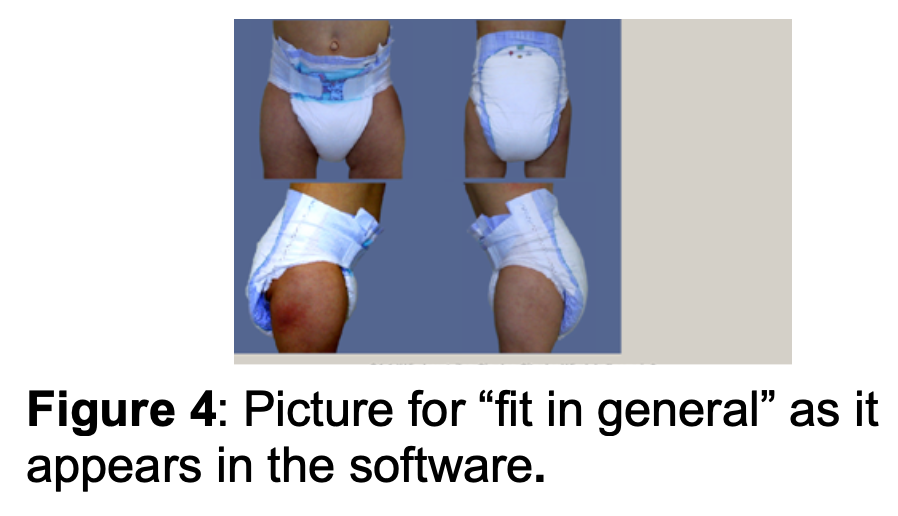
Pictures of diapers on babies make the evaluation perfectly reproducible over the years if consistent lighting on all pictures ensures the comparability of the pictures. For each of the different questions of the questionnaire, another combination of pictures was shown. For instance, regarding the attribute “fit in general,” the subjective part of the questionnaire showcased four pictures; front-, back-, left- and right side (fig. 4). The pictures were presented to the panelists via special software that allows the panelists to watch the pictures and input their rating to the different questions at the same time.
3.3.3 Torso
The torso represents only the body area from thigh to belly, which is important for a diaper. To achieve comparability with the other test instruments only torsos sized for the average diaper were used. In the context of on-baby testing, it is important not to stress the babies. Therefore torsos are a useful tool, because panelists can have a closer look on them without fazing the babies, which could cause stress. Furthermore some details are easier to assess on the static torso, than on a moving baby.
3.4 Training Session Design
The training was designed to sensitize and calibrate the panelists best, concerning objective diaper fit assessment, without overloading them. For this reason, it was split into three training sessions. Through short tests (cut-outs of the questionnaire) the panelists grew accustomed to the questionnaire, the rating scale and the general assessment. A complete test followed with usage of all three test instruments in the order picture, torso and baby. To prevent negative impacts in terms of e.g. misunderstanding of questions and lack of motivation, a single- and group evaluation took place after each test. The training session sequence was as follows:
First Training Session
- short explanation of a diaper
- ranking of three most important attributes concerning diaper fit performance
- familiarization with questionnaire
- mini- test via torso and pictures including single- and group evaluation
Second Training Session
- assessment of diaper fit attribute via pictures and whole questionnaire (each panelist on her own) and afterwards single- and group evaluation
- assessment of diaper fit attributes via torsos and whole questionnaire (again each panelist on her own) and afterwards single- and group evaluation
Third Training Session
- use of software
- assessment of diaper fit attributes on torsos
- familiarization and complete test with babies as last test instrument
3.5 Sensory Fit Panel Test-Accomplishment
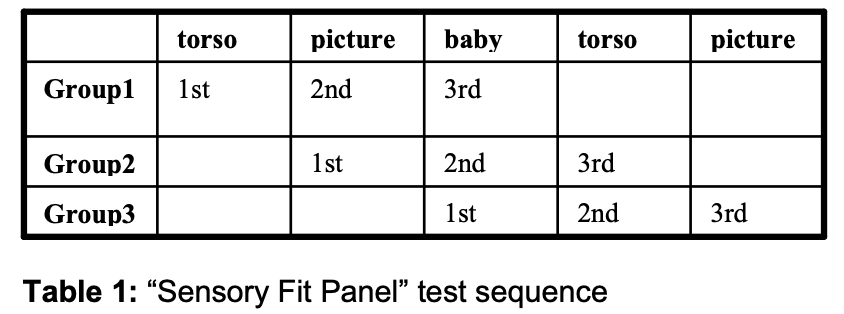
The Sensory Fit Panel pilot test was composed of three parts regarding the three test instruments. Each part took place on one day. The test room requirements for the third test instruments, the babies, were completely different from the others. To allow all panelists to watch the baby at the same time, the room had to be big enough that fit all panelists, babies, and mothers. To meet the claim of reliability, the test had to be randomized. The available nine out of 15 experts were split into three groups. The following figure (table 1) shows the order the groups evaluated the diapers on the different instruments . The test was applied with two competitive products.
As controls underwear (Golden Standard = positive control) and a cloth diaper (Worst Case Standard = negative control) were added, The Golden Standard is an unreachable good anchor point, which shows where the best ratings of the attributes can be this is cryptic at best. The cloth diaper represents the opposite anchor point. The panelists rated the subjective part only with wet diapers and the objective one with dry and wet diapers
This was done to exclude the panelists who were swamped with too many questions and therefore the concentration, which would lead to wrong results.
Regarding the on-baby testing, all nine panelists had to assess the diaper performance on the babies at the same time, because a diaper on a baby looks never similar, even with the same baby and the same diaper. These panelists were split into two groups, five experts rated one baby and four the other one. The products on the babies were labeled with two different colors. One baby used products with yellow labels and the other one products marked blue. To allow best possible randomization concerning the order of the diapers, two on-baby tests took place. Five experts rated the aesthetic fit of a diaper on baby blue in the first on-baby test; in the second on-baby test, they rated the diaper fit performance on the yellow baby. For the remainder of the panelists, it was the other way around. Herewith, it was guaranteed that every expert (=panelist) could assess the products on both babies.
4. Results
The test was designed for Advertising Claim Support needs.
To satisfy those needs a reproducible, reliable and objective method had to be created. Successful criteria for fulfilling this were that the test instruments must be able to distinguish between different products in a comprehensible order.
The second objective was to prove if all three test instruments are necessary.
The third aim was to clarify how the objective questions relate to the subjective ones and to what extent.
Also, any unnecessary questions should be discovered and eliminated in the following tests. As a final part of the analysis, a comparison with consumer data was made.
4.1 Does the method work?
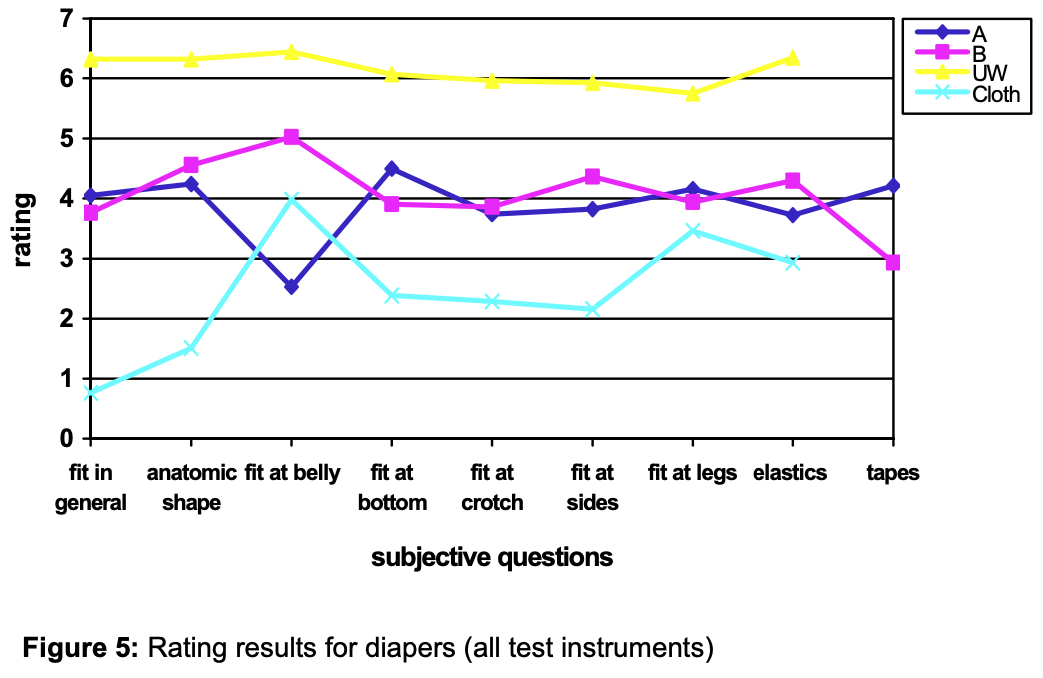
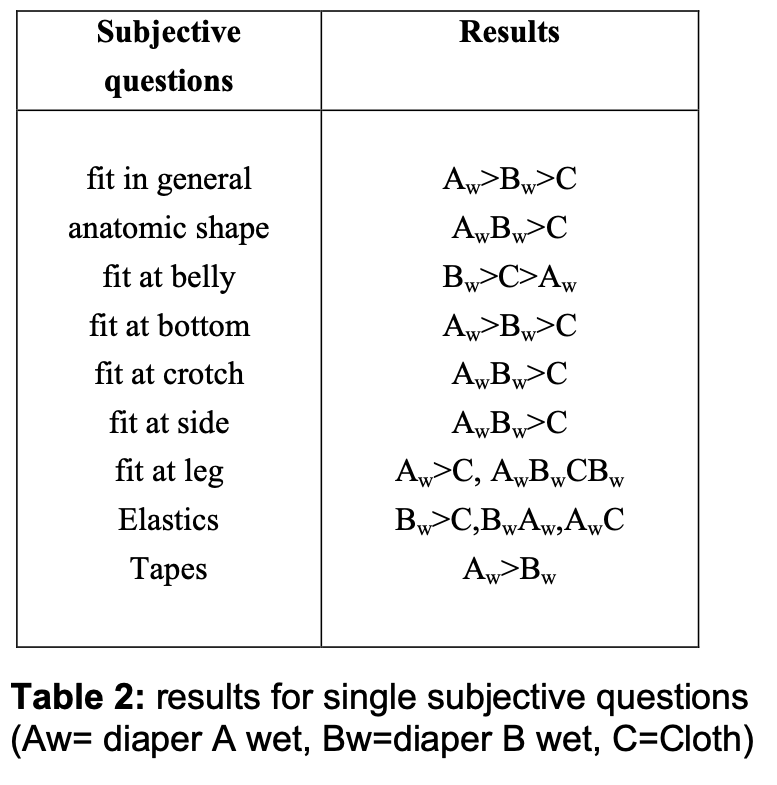
For a simple answer: yes, it does. This question is answered by calculating the average of all three test instruments regarding the single diapers for the subjective part of the questionnaire. Hereby it becomes visible that the diapers A and B are clearly different from the controls (figure 5, table 2), except for the question “fit at belly”. For this attribute, the cloth diaper is rated surprisingly well, which is explainable by the cloth diaper’s covering with an elasticated pant to prevent leakage. The elastication of the pant lead to the good rating for “fit at belly”.
The variance method, a statistical method to identify outliers, was used to look at the results in more detail. No outlying panelists nor a lack of concentration among the panelists was detected. This was analysed by the variance method, which examined consistency of ratings during the whole test period.
4.1.1 Comparison of the test instruments
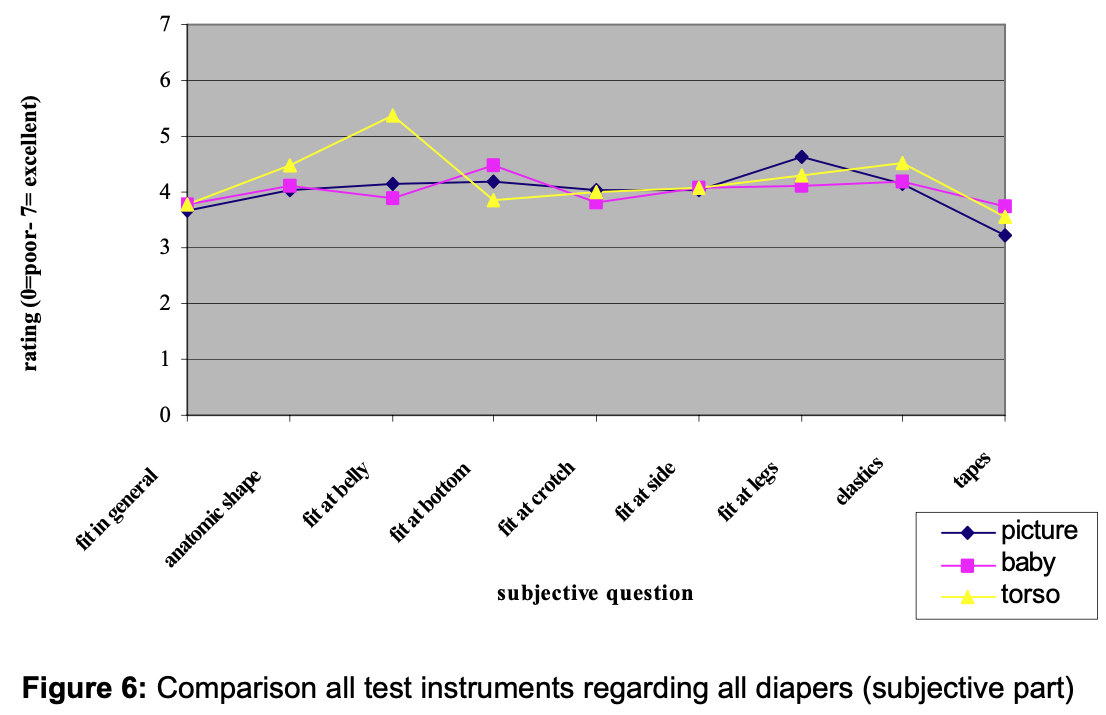
To compare all combinations of test instruments two analyses were done: 1.) a chart comparing the single test instruments for the two parts of the questionnaire and 2.) an analysis of the results via the variance method. To get an overall impression of whether one test instrument differed from the others or if all three were not in line, the average of all diapers for the different test instrument were calculated. The subjective part’s results revealed that all test instruments lie overall in one area (fig.6).
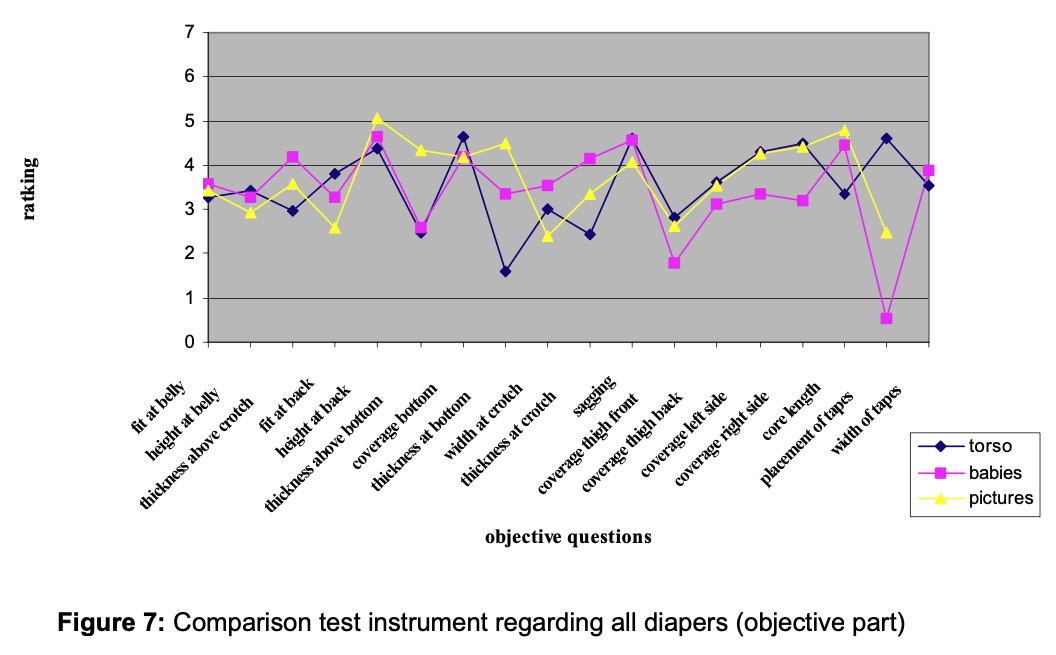
This is in contrast to the average of diapers in the objective part (fig. 7), where the test instruments were overall not in line. This can be explained by people’s closer scrutiny of details in the objective method, so that the different pros and cons of each test instrument are more emphasized. The same results were found by using the variance method.
4.1.2 Checking panelists and test instruments together
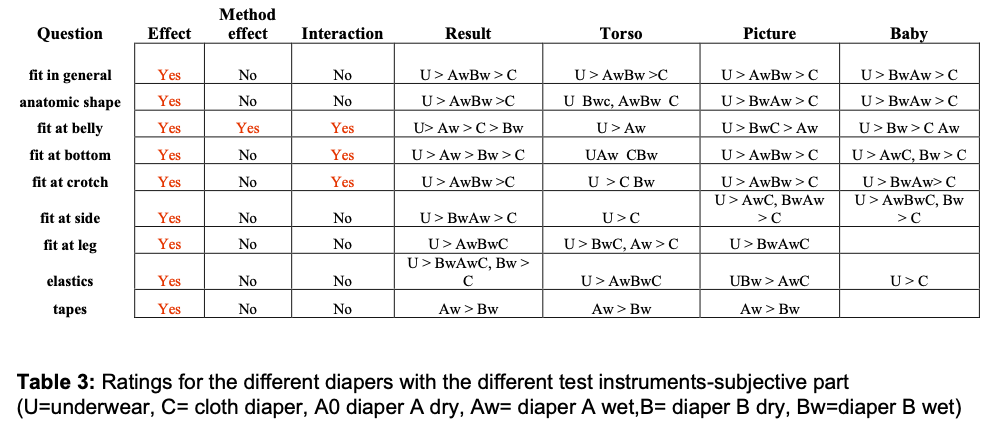
As a method to check both panelists and test instruments together, the dry and wet stage of one type of diaper were compared for each test instrument (one example is given in table 3). The results are as expected. For example, for the attribute “height at belly,” the wet diaper was lower than the dry one, showing the slipping of the heavier product. On the other hand, for attributes not related to the diaper load, like core length, the results for the dry and wet diaper were the same. Only a few deviations from the predictions were found, but all of them were explainable by properties of the used test instrument.
4.1.3 Need for all Test Instruments
To decide which test instruments work and whether all are important, it is necessary to know their behaviour regarding the different questions.
The baby reflects reality in the best way and therefore the torso and pictures were compared with the baby. Before this could happen, the results achieved using the two babies had to be compared by the “variance method”. Hence, the results for similar questions concerning the two babies were compared: the result of question one from baby blue was compared with the result of question one from baby yellow.
The conclusion was that the babies gave the impression of the same body dimension for the panelists, as predicted in the study from B. Seitz (P&G fit expert). Based on this fact, the average of the two babies were taken and handled in the whole study as one baby. In general, in the subjective part, there are no large differences between the assessment methods (table 4). Regarding the similarity of the test instruments in the subjective and objective parts of the test, it could be assumed that pictures could be most likely left out.
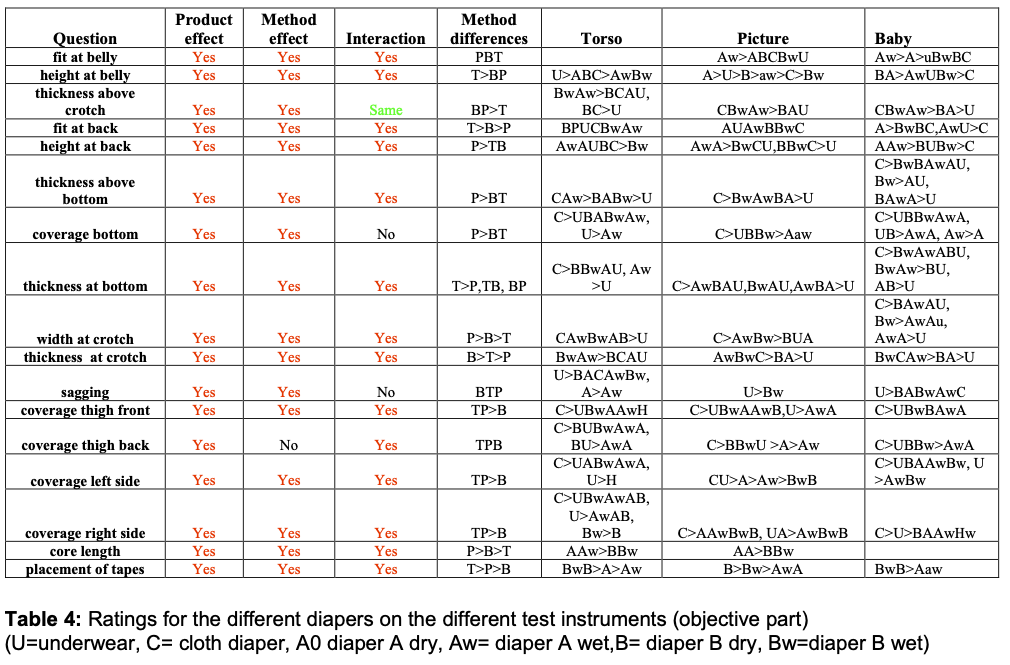
On the contrary, results differ in the objective part (table 5). This has to do with panelists’ closer look to detail. In the objective part, the variance method helped to determine that the test instrument picture is significantly closer to the baby than the torso. Because the different objective questions influence each test instrument differently (which also plays a role for the subjective part), it became clear that for the moment, no test instrument can be left out.
4.2. Connection between subjective and objective part of the questionnaire
The subjective and objective parts were linked together to know which objective factors, in detail, influence the subjective perception of attributes.
In principle, a “regression analysis” can link these two parts. However, the correlated nature of the objective questions leads to multicolinearity problems. To solve this problem, a factor analysis was performed on the objective questions, leading to a set of non-correlated factors.
A factor analysis is a statistical method where similar questions are summarized to one factor.
In the analysis of the Sensory Fit Panel, these factors were regressed against the subjective questions; this mathematical method is called “factor regression analysis”. This analysis was applied on each test instrument.
4.2.1.Factor analysis
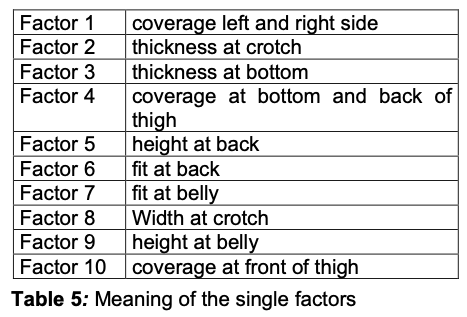
95.53% of the original 14 objective questions were explained by 10 factors (table 5).
These factors were regressed against the subjective questions. The probability that the subjective questions are explainable by the suitable factors is represented through a so called R2. A reliable R2 for a pilot study should be > 50%, and the maximum expected R2 is about 75%. Additionally, a stepwise regression analysis for each test instrument was applied to split the important factors from the unimportant ones.
Torso
After splitting the R2 of the subjective questions concerning the test instrument torso, the following subjective questions could be best explained by the following objective factors: “fit in general” (R2=66.9%), “fit at bottom” (R2=66.5%) and “fit at legs” (R2=54.7%). See for example figure 8.
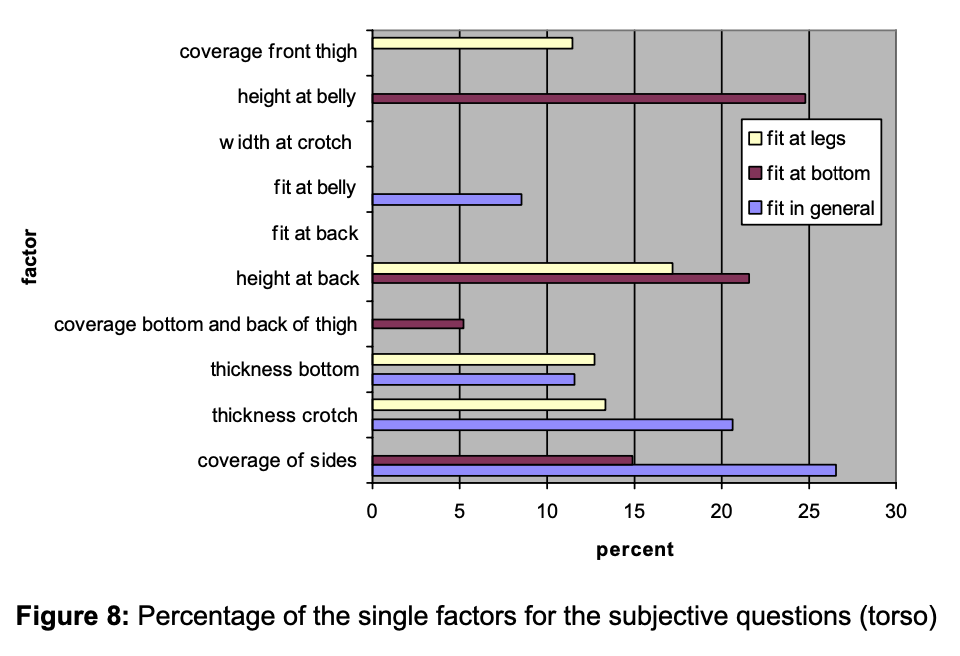
The subjective questions were split into their describing objective factors considering the percentage of each component. For example, the subjective question “fit in general” is composed of the objective factors “coverage at side”, “thickness at crotch”, “thickness at bottom” and “fit at belly”. The ratings from the expert panelists showed directional differences between products in the subjective part (table 4). For one question, “fit at bottom”, not only a trend, but a significant difference was found.
The following step was to compare these results to the objective part of the questionnaire. Regarding the first component “coverage of side”, product A has the trend to cover more than product B. For “fit at belly,” B has the trend to fit narrower at belly than A (figure 9).
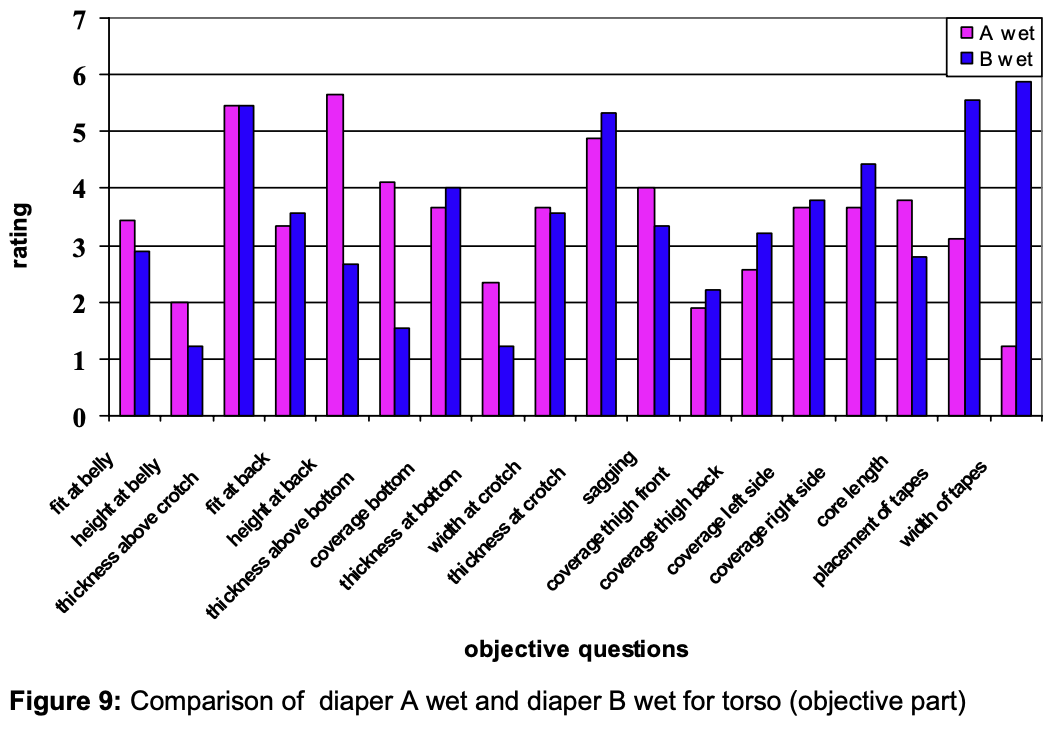
Furthermore, B has the trend to be thicker at crotch and regarding the last component “thickness at bottom”, diaper A has a strong trend, leading to a probably statistical significance if more data points were used. The second subjective attribute “fit at bottom” is predictable up to 66.5 %. It is composed of the objective factors in the following percentages: “coverage of side” (14.9%), “coverage bottom and back of thigh” (5.2%), “height at back” (21.6%) and “height at belly” (24.8%). The first factors are already described in the subjective part “fit in general”. Regarding “coverage at bottom and back of thigh”, again the two ratings of the diapers were compared and the result is that product B has the trend to cover more than product A. A has the trend to be higher at belly than B, and looking at “height at back,” there is even a significant difference. The last subjective attribute with a R2 over 50% is “fit at legs”, which is composed to 13.3% of “thickness at crotch” to 12.7% “thickness at bottom”(12.7%),to 17.2% of “height at back” and to 11.5% of “coverage front of thigh”. Concerning “coverage at front of thigh,” product B has the trend to cover more than product A.
Summarizing the test instrument torso it can be said that concerning the three relevant subjective questions–“fit in general”, “fit at bottom” and “fit at legs”–only for “fit at bottom” does a significant difference between the two diapers appear. For Copy Claim Support, only the significant similarities or differences are important. Therefore, concerning the torso, the subjective question “fit at bottom” is essential, revealing that product A fits better than product B. The objective factor “height at back” is also significant, showing A higher than B. The same procedure was used to determine the significant results on picture and baby.
Picture
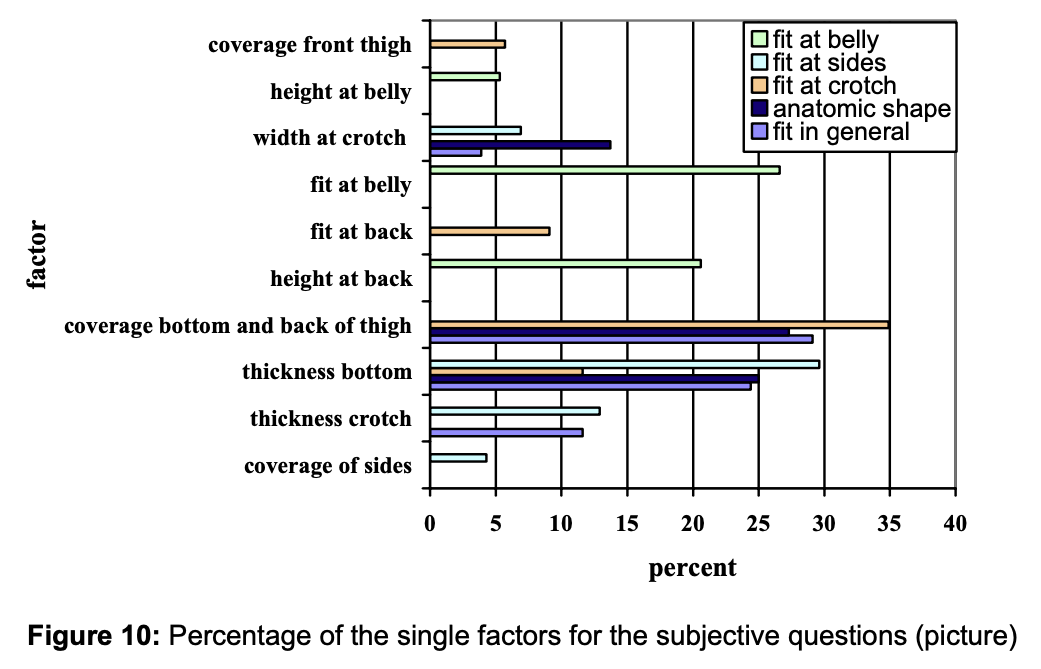
Each test instrument receives good correlations on different subjective questions. For pictures, the subjective questions with an acceptable R2 are “fit in general”(69%), “anatomic shape” (66%), “fit at belly” (52.5%), “fit at crotch” (61.3%) and “fit at side” (53.7%). See figure 10.
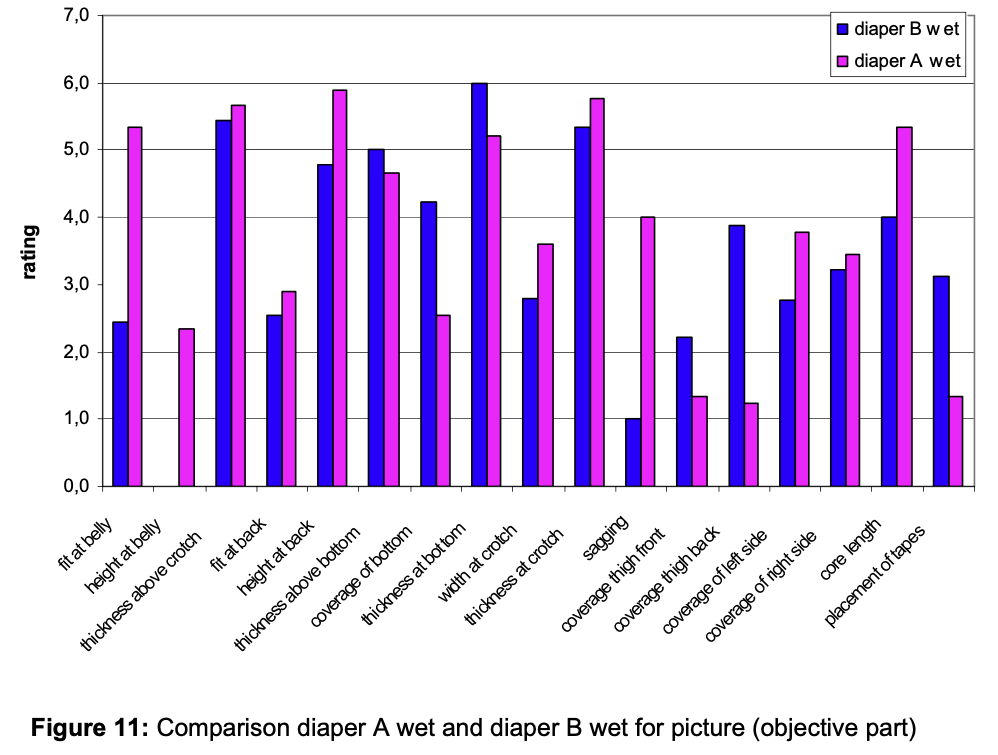
Regarding “fit in general”, “anatomic shape” and “fit at crotch”, B and A show few trends. This means that with a higher base size of panelists, these points could reveal real trends. Regarding “fit at sides,” there is already the trend that product B fits better than product A (figure 11). The only significance appears at “fit at belly”, where B fits significantly better than A. Looking at the describing objective factors, product A is also significantly higher at the back than product B.
Baby
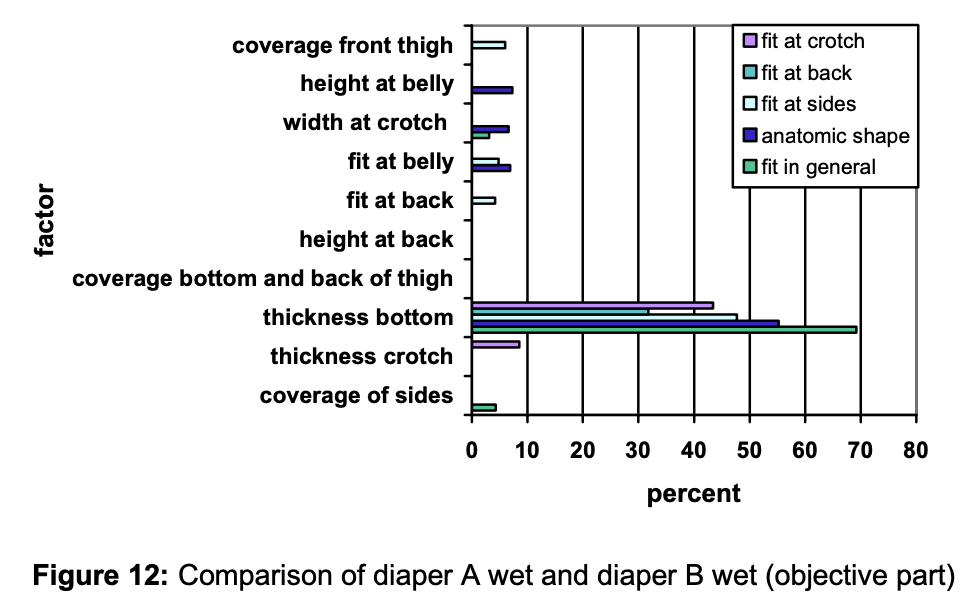
The meaningful and best explainable subjective attributes on babies are “fit in general” (76.6%), “anatomic shape”(76%), “fit at bottom” (61.6%), “fit at crotch” (51.9%) and“fit at sides” (62.7%). See figure 12.
Regarding these attributes, only low to moderate trends are visible that B fits better than A, which could change with a higher base size of panelists.
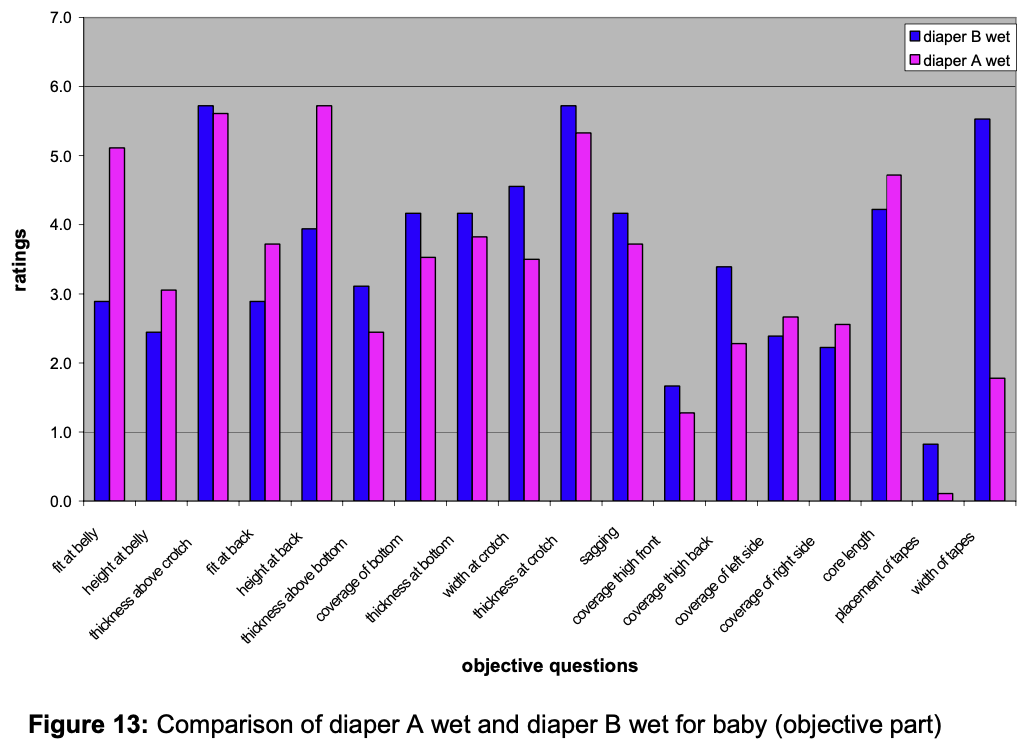
This summary shows that at the moment all test instruments are needed and further studies will evaluate up whether different test instruments should be used for different attributes, because some attributes are better visible on a static body and others need movement for good assessment (see also figure 13).
4.3. Important questions
Another aim of the “Sensory Fit Panel” pilot study was to find out which questions are important and whether some could be left out. Therefore, only the unexplainable subjective questions with a R2 under 40 percent were considered. This limit was set because with more panelists producing a higher amount of data , the questions around and over 40 percent can reach the 50 percent limit and herewith they would become explainable.
The conclusion was that the subjective attributes “elastics” and “tapes” were irrelevant.
4.4. Confirmation of results
4.4.1. Comparison with consumer test
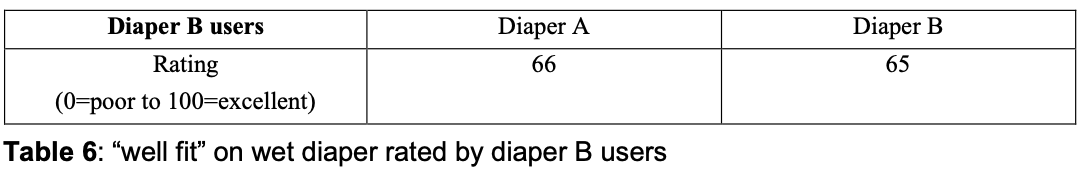
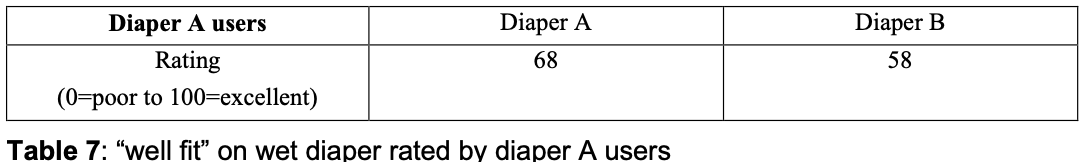
As a final confirmation for this method, we compared the results to data from a so called Concept & Single Product Identified Test (C&SPITs) conducted by P&G in the U.K. [12]. This country was chosen because both tested products are marketed there. A C&SPITs is a test using panelists with children wearing the same size of diapers. These mothers receive diapers for a certain period and then are asked for their opinion about these products afterwards.
In this C&SPIT, two test groups tested each one of the products used in the pilot study (table 6, 7).
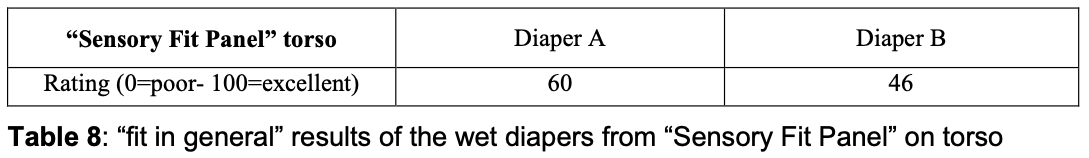
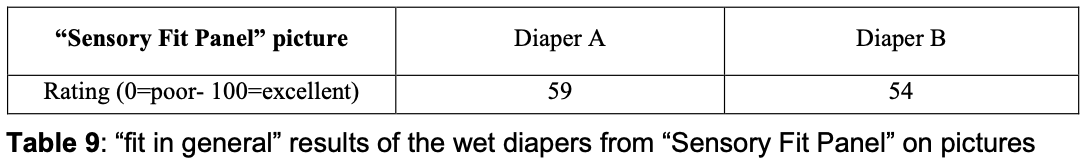
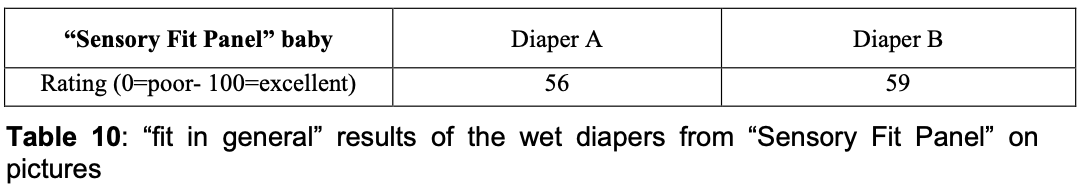
The voluntary comments of the panelists about these products were compared to the results of this pilot study. In contrast to the “Sensory Fit Panel” ratings, which were given only in wet stages, these comments are given for diapers in dry and wet stages. The results are separated in the different test instruments. The ratings of the “Sensory Fit Panel” pilot test question “fit in general” was compared to the similar question in the C&SPIT study. The ratings were also translated into a 100 point rating scale (table 8-10)
For the subjective part, there is a good correlation with the “Sensory Fit Panel” results regarding the test instruments torso and pictures, but not with the test instrument babies. The reason for this could depend on the low amount of panelists, which can influence the results. Therefore, the objective questions were also considered.
In table 11 an overview is given, with results regarding each test instrument; they agree with the results from the C&SPIT.
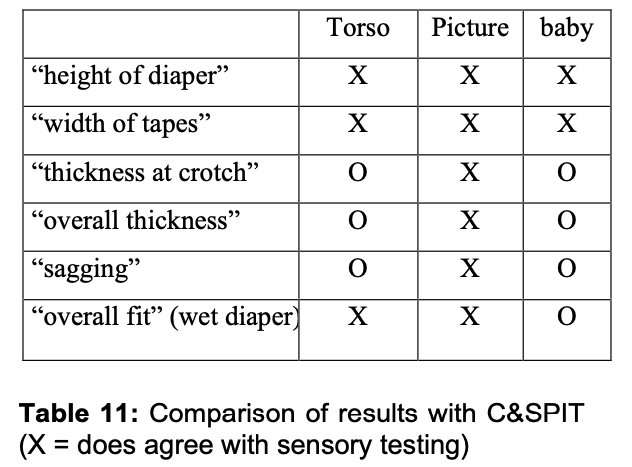
The results from the test instrument “pictures” agree in all objective points with the results of the voluntary comments. Results from “torso” are in line with three points and “baby” in two points. “Does not agree” means that the two results are approximately similar. “Does agree” means the test instruments have the same trends. To understand the results for the different test instruments, the following points must be considered. These results were achieved by the low base size as well as the different kinds of questions (trained panelists vs. consumers). Another point is that the voluntary comments of the consumers are for dry and wet diapers instead of the “Sensory Fit Panel” results, which were only generated for the dry diapers.
Considering these points, it becomes clear that the method works, but a higher base size is needed to change the hints from this pilot study into sound facts.
5. Conclusions
Looking at the results of the “Sensory Fit Panel” it becomes clear that a subjective impression can be measured in an objective, reliable and reproducible way. However, more studies have to follow to consolidate the basis of the pilot study. The base size of the panel must be raised to 15 experts. These experts have to rate dry and wet diapers in the subjective part on all three test instruments, and these results have to be compared with the results from the C&SPIT again. Additionally, the test has to be compared with all kinds of boundary babies and different types of diapers, because it could then become clearer, which test instrument is useful for which attribute.
Acknowledgements
Thanks to Prof. Dr. Rieger and Dr. Höhne from the University of Ulm, who made this diploma thesis possible, to P. Bowtell and W. Schöler for their statistical support, and to U. Podbielski for the sensory benefit of this project. Also thanks to N. Rauch and B. Seitz who created the morphings and helped to see the project from a fit point of view.
References
[1] A. Maslow, 1987, Motivation and Personality, 3 rd ed., Hapercollins College Div., New York