Assessment of thermal-stable polymer nanocomposite techniques by patent citation network analysis
Nanocomposite material with new functions or properties superior to traditional composite materials opens a door to transform the way that material is currently applied. This study aims to provide 1) a systematic and quantitative method for obtaining global patent overview, 2) a global patent-citation overview on thermalstable polymer nanocomposite patents retrieved from the United States Patent and Trademark Office (USPTO). The systematic method provided in this paper is integration of basic patent statistics, technology-function classification, standard industrial classification, patent citation and network properties calculation. All of these contribute not only to a systematic approach for obtaining a quantitative overview of large amount of selected patents, but also bridge the gap between patented techniques and business management activities, e.g. R&D resource allocation, performance evaluation, patent map visualization, patent valuation, in business and industry.
Introduction
Intellectual property has become more and more important for competitive advantage in modern society and it is generally believed that intellectual property is a critical and fundamental factor for future business success. Companies which try to ensure their intellectual properties file patents to protect their inventions in order to define technical areas from where they are able to generate profits. Companies or industries which try to optimize and manage their patent portfolios (Friese et at., 2006) which can substantially lead to benefits such as market monopoly position, revenue from licensing the intellectual property, and innovation strategies advanced by patents. However, patent management, particular for managing large number of patents, not only leads to monetary benefits but also provides way of implementing development strategy by positioning patents in a patent map. The patent map allows evaluation of patent value, search for potential collaboration partners and benchmarking comparison, etc. A question raised here is-How to manage a large number of patents and obtain a quick overview of a large number of patents?
In order to answer this question, this research proposes a systematic process beyond conventional patent statistics for patent trend analysis (Suárez et al., 2005) and allows business and industry to analyze and evaluate patented techniques by integrating basic patent statistics, technology-function classification, standard industrial classification, patent citation and network properties calculation. All of these contribute to a systematic approach for obtaining an overview of large amount of selected patents. More importantly, this paper provides a quantitative way of evaluating patents and thus a computerized calculation is possible for potential quantitative applications such as R&D resource allocation, research performance evaluation, patent map visualization, patent valuation, etc.
Mapping knowledge evolution by bibliometric analysis
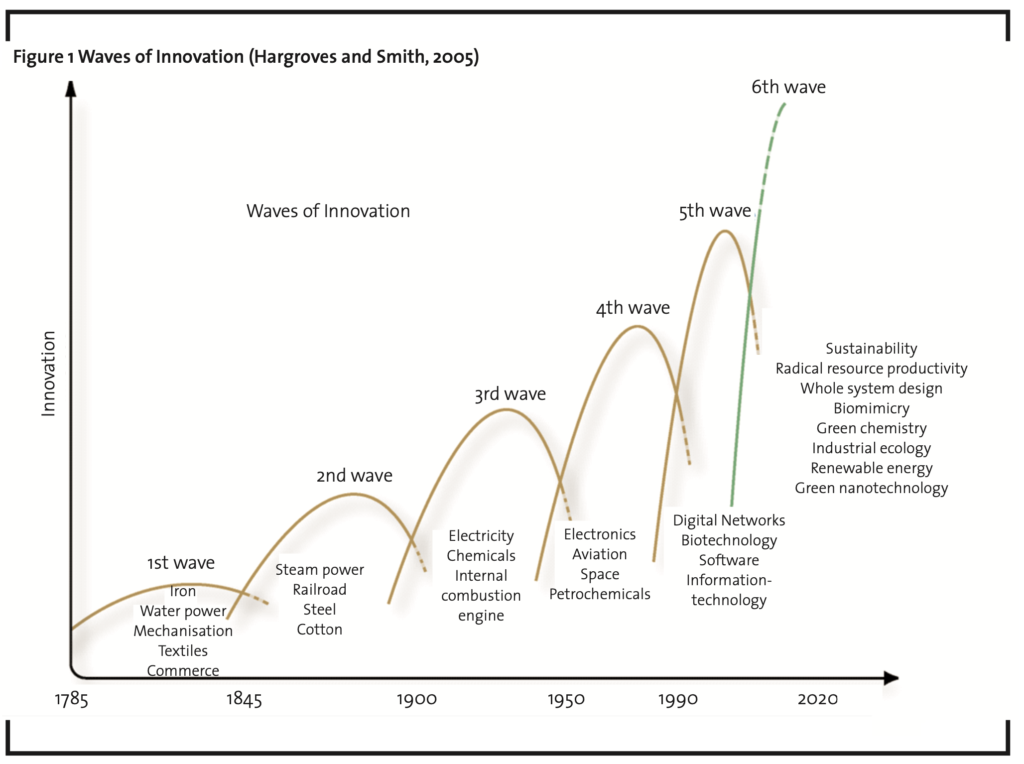
Thomas Kuhn published “The structure of scientific revolution” (Kuhn, 1970) and popularized the terms “paradigm” and “paradigm shift”. Dosi (1982) investigated technology trajectory on the basis of paradigm shift and found continuous innovation can be regarded as proceeding of technology paradigm, while discontinuous innovation might be the initiation of a new paradigm. The differentiation between continuous innovation and discontinuous innovation may be positive for understanding initiation of a new paradigm as well as position and diffusion of a specific technology or knowledge. For example, Figure 1 shows six waves of Sci-Tech innovation between 17852020, which can also be regarded as six paradigms, proposed by Hargroves and Smith (2005). A continuous innovation is what happened in the same wave, while discontinuous innovation is the jump from one wave to the next wave.
A lot of methodologies have been proposed and applied into various knowledge fields for understanding their technology development overview. For example, Pouris and Pouris (2009) made international comparison on biotechnology research to identify potential strategies and policies for South African biotechnology innovation system. However, what usually used for this purpose is bibliometric analysis on patents or scientific papers by way of classifying papers or patents into different categories along time horizon. In this case, understanding of relations among papers or patents is not possible, and hence advanced applications based on paper relations, e.g. identify potential research partnership, identify which paper/patent is important, cannot be approached.
To solve the issue of paper/patent relations identification, attempts have been made by the use of keyword as a bridge of connecting paper/patents, so keyword based analysis as a type of co-word analysis (King, 1987; Law and Whittaker, 1992) started to play an important role in understanding the dynamics of knowledge development. (Gupta and Bhattacharya, 2004). Ding et al. (2001) mapped information retrieval research by using co-word analysis on papers collected from Science Citation Index (SCI) and Social Science Citation Index (SSCI) for the period of 1987–1997. Baldwin et al. (2003) mapped ethics and dementia research by using keywords. Tian et al. (2008) used ISI database to measure scientific output of the field of GIS (Geographic Information System) by using keywords.
However, a lot of literatures used the above mentioned keyword-based analysis providing less sense of knowledge accumulation over time or limited understanding on causal interpretation of human knowledge development. Therefore, this study aims to use the alternative citation based method to avoid this problem and reap reward from the well-assigned citations in structured patent documents for drawing an overview of how a selected technology field, thermal-stable polymer nanocomposite technology, is evolved. Nanocomposite has been a popular material that is defined as multiphase solid material where one of the phases has one, two or three dimensions of less than 100 nanometers (Manias, 2007), and polymer nanocomposite is a type of nanocomposites that contains at least one polymeric phase (Mai and Yu, 2006). The research target set in this study is a type of polymer nanocomposite materials capable of being thermally stable (Morgan and Wilkie, 2007). The dynamic overview of knowledge evolution for this selected field is investigated in this paper.
Mapping technology network by patent citation
It has long been a very critical part of human knowledge system that patent and scientific publications are two most significant ways of disclosing science and technology progress in this society. Former publications can be served as important references or bases for later publication, in this way human knowledge can be gradually accumulated to sustain and expand knowledge system. The important featuring characteristic of patent and scientific publication for knowledge accumulation is their citations showing which former literatures have contributed to later paper/patent and providing the context of knowledge acumulation. A number of researches have noted that patent citations trace out technological building relationships
among inventions (Jaffe, Trajtenberg and Henderson, 1993). Also, citation has been widely used in bibliometric study to evaluate technology development, research performance, and even map knowledge evolution or technological trajectory. For instance, Acosta (2003) investigated the links between science and technology based on an analysis of scientific citations in patent documents to study in greater depth the relationship between science and technological development in various regions of Spain, Hall et al. (2000) suggested that of all patent related indicators, patent citation is a more adequate indicator to evaluate market value, Stuart and Podolny (1996) used patent citations to measure firms’ technological niches and niche shifts.
Otte and Rousseau (2002) studied citation network, utilized as a type of social interaction networks, by the use of social network analysis, and calculate network property to discover how information can be disseminated among network actors, and Liebowitz (2005) indicated the possibility of mapping knowledge flows and measuring relationships among actors in a network. Accordingly, this research aims to shed light on identifying critical patents by the use of social network analysis, patent citation information allows the building of patent linkages which eventually leads to a citation network as a whole. The constructed patent citation network, with patents as network nodes (actors) and patent citation as network ties, allows quantitative analysis on patent citation network by calculating network properties, e.g. Degree Centrality, Betweenness Centrality, and Closeness Centrality. In the sense, mechanism of knowledge flow or technology evolution mechanism, e.g. technology convergence, technology diffusion, etc. can be quantitatively analyzed.
Research Method
Initial patent sampling
This research selects nanocomposite material as research target to draw its citation network. Patents with “nano” and “composite” appeared in title or abstract of patents in application are retrieved from USPTO (Patent retrieval time: Jun. 11, 2008). The retrieved patents are carefully reviewed to remove those which are not sufficiently related to nanocomposite material, and finally a total of 672 patents are remained as our target patents named as “initial patent” in this study.
The development of technology-function matrix
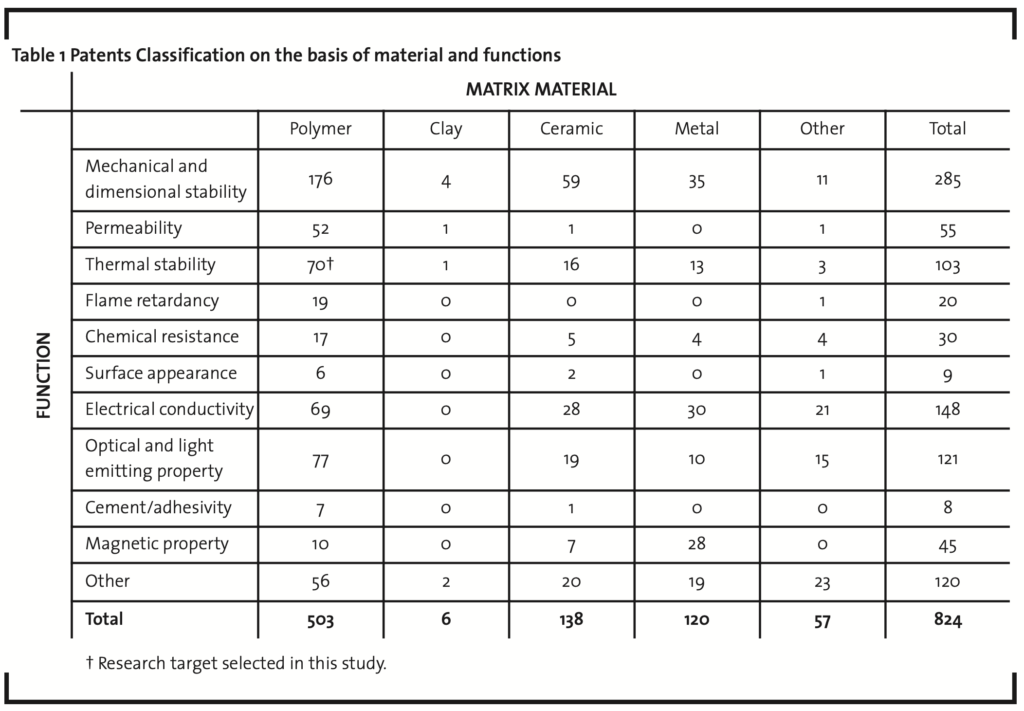
The obtained 672 patents are critically analyzed and classified into two dimensions, 1) technological dimension based on the matrix material disclosed in patents, i.e. polymer, clay, ceramic, metal and other, 2) functional dimension based on the function of invented techniques, i.e. mechanical and dimensional stability, permeability, thermal stability, flame retardancy, chemical resistance, surface appearance, electrical conductivity, optical and light emitting property, cement/adhesivity, magnetic property, and other, as shown in Table 1. Validation is done by comparing the content of classified patents with multiple sources and through informal interviews with members of our expert panel. It is worth noted that one single patent may disclose more than one matrix material or more than one function, so one patent can thus be categorized into more than one classification and thus the total patent count in Table 1 is 824 instead of original patent count of 672. The classification of “other” in both matrix and function in Table 1 are either for patents disclosing some other materials or functions that are not considered in this study, or patents trying to reduce the specificity of its disclosed matrix or function by disclosing more than three matrix materials or or functions. The obtained technologyfunction matrix shown in Table 1 provides an overview, or a so-called “patent map”, for the development of nanocomposite material. Subsequently, this research selects 70 patents with the technology of “polymer” matrix and function of “thermal stability” to meet the requirement of the research target set in this study.
Network patent sampling
After classification of technology and function, the 70 patents with polymer matrix and function of thermal stability are used as primary patents based on which their backward citation patents and forward citation patents are retrieved from USPTO database as the secondary patents which are upstream patents and downstream patents of the primary patents, respectively. By examining upstream and downstream patents, a technological context of what upstream patents contribute to primary patents and what downstream patents are contributed by primary patents can be understood and the underlying knowledge flows can thus be analyzed. In summary, this research uses 1) primary patents: the 70 patents with polymer matrix and function of thermal stability, 2) secondary patents: 558 backward citation patents of the 70 primary patents and 543 forward citation patents of the 70 primary patents, as actors of the technology network (patent citation network) to be drawn in this study. The total number of obtained patents is 1,069 instead of 1,171 (the sum of primary patents and secondary patents) after removal of duplicated count (some patents belong to both primary and secondary patents). The 1,069 patents are defined as “network patents” and are therefore treated as network actors (node). Along with the network ties built by patent citation linkages, a technology network for understanding the developed context of thermal-stable polymer nanocomposite can be achieved.
Patent citation network and network property calculation
After construction of the technology network, network property is subsequently calculated. In social network theory, “Centrality” is a key network property to estimate how easy an actor retrieves or controls resources from the network. Freeman (1979) proposed three ways of measuring network centrality, Degree Centrality, Betweenness Centrality, and Closeness Centrality. The higher centrality indicates more associations with actors in a network. Brass and Burkhardt (1992) pointed out the higher centrality of a person in a social network, the more power s/he possesses from the viewpoint of organizational behavior. This research also uses the three ways of measurement for obtaining centrality of patented technology, in order to understand importance, influence, diffusivity and convergency of a patented technology.
Degree Centrality
Network nodes (actor) which directly linked to a specific node are neighborhood of that specific node. The number of neighbors is defined as nodal degree, or degree of connection. Granovetter (1973) suggested nodal degree is proportional to probability of obtaining resource. Nodal degree represents to what degree a node (actor) participates the network, this is a basic concept for measuring centrality.
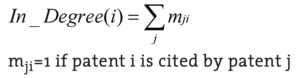
(i) InDegree Centrality: the number of time that patent i is cited by other patents. The higher InDegree Centrality, the more times that patent i is cited, the higher momentum of knowledge diffusion from patent i to other patents.
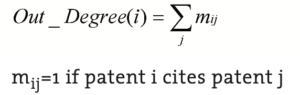
(ii) OutDegree Centrality: the number of times that patent i cites other patents. The higher OutDegree Centrality, the more times that patent i cites other patents, the higher momentum of knowledge convergence from other patents to patent i.
Betweenness Centrality
The concept of betweenness is a measure of how often an actor is located on the shortest path (geodesic) between other actors in the network. Those actors located on the shortest path between other actors are playing roles of intermediary that help any two actors without direct contact reach each other indirectly. Actors with higher Betweenness Centrality are those located at the core of the network.
Closeness Centrality
The Closeness Centrality of an actor is defi-ned by the inverse of the average length of the shortest paths to/from all the other actors in the network. Higher Closeness Centrality indicates higher influence on other actors. In a directed network, Closeness Centrality can be divided into InClosenesss Centrality and OutCloseness Centrality.
(i) InCloseness Centrality: the shortest path from other patents to patent i, the higher InCloseness Centrality, the higher influence of patent i on other patents.
(ii) OutCloseness Centrality: the shortest path from patent i to other patents, the higher OutCloseness Centrality, the easier for patent i to be influenced by other patents.
Concordance between network properties and technology evolution mechanisms
The previously mentioned network properties can be used as indicators for characterizing technology evolution context, and therefore quantitative analysis on the evolution context can be obtained. In this study, we propose the applications of the five network properties on evaluating evolution contexts for thermal-stable nanocomposite technology, namely the concordance between network properties and technology evolution mechanisms, which provides a quantitative approach toward evolution mechanism:
(i) InDegree Centrality: the number of times that a patent is cited, it can be used as an indicator to measure knowledge flow from one target patent to later patents. Because of its implication of knowledge diffusion, InDegree Centrality is defined as an indicator to measure momentum of technology diffusion.
(ii) OutDegree Centrality: the number of times that a patent cites other patent(s), it can be used as an indicator to measure knowledge flow received by a target patents. Because of its implication of knowledge convergence, OutDegree Centrality is defined as an indicator to measure momentum of technology convergence.
(iii) Betweenness Centrality: how often an actor is located on the shortest path (geodesic) between other actors in the network. Therefore, Betweenness Centrality is defined as an indicator to measure momentum of technology transition.
(iv) InCloseness Centrality: the shortest path from other patent(s) to a target patent. The shorter path, the stronger the target patent influences other patent(s). InCloseness Centrality is therefore defined as an indicator to measure momentum of influence.
(v) OutCloseness Centrality: the shortest path from a target patent to other patent(s). The shorter path, the stronger the target patent is influenced by other patent(s). OutCloseness Centrality is therefore defined as an indicator to measure momentum of being influenced.
Even though the five network properties represent five mechanisms of technology evolution. Patents with higher centralities are those located closer to the core of a target research field, or they can be called the core patents. But the idea of “core” relies on which of the five above indicators is used.
Results and Discussion
Initial patent analysis
According to the technology and function matrix shown in Table 1, in terms of technology, most patents disclosed nanocomposite material with polymer matrix (503 patents) and subsequently ceramic matrix (138 patents). In terms of function, most patents are for mechanical and dimensional stability (285 patents), and then electrical conductivity (148 patents), optical and light emitting property (121 patents). This research aims to study thermal-stable polymer nanocomposite, so the 70 patents with technology of “polymer” matrix and function of “thermal stability” are selected as primary patents for subsequent investigation.
Network patent analysis
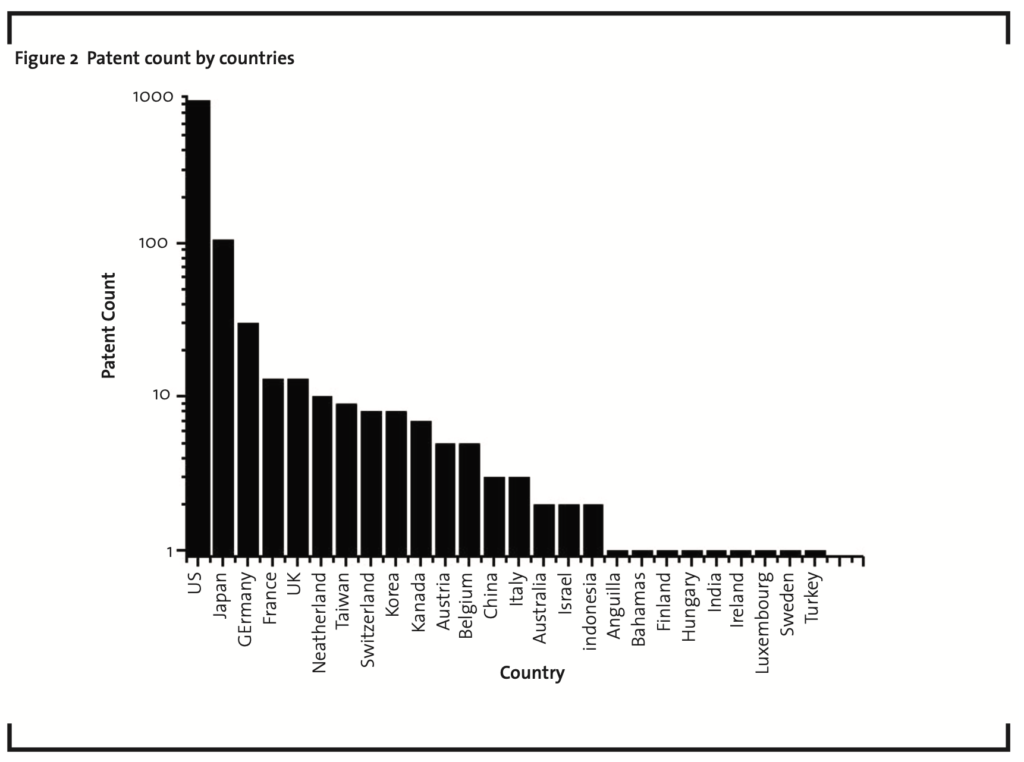
For all the obtained 1,069 network patents, countries with most patents are the US (846 patents), Japan (105 patents), Germany (30 patents), France (13 patents), UK (13 Patents) and Taiwan (7 patents). This revels thermalstable polymer nanomposite related technologies are mainly located in the US, Japan, and Europe but the US is much more significant than other countries, Figure 2.
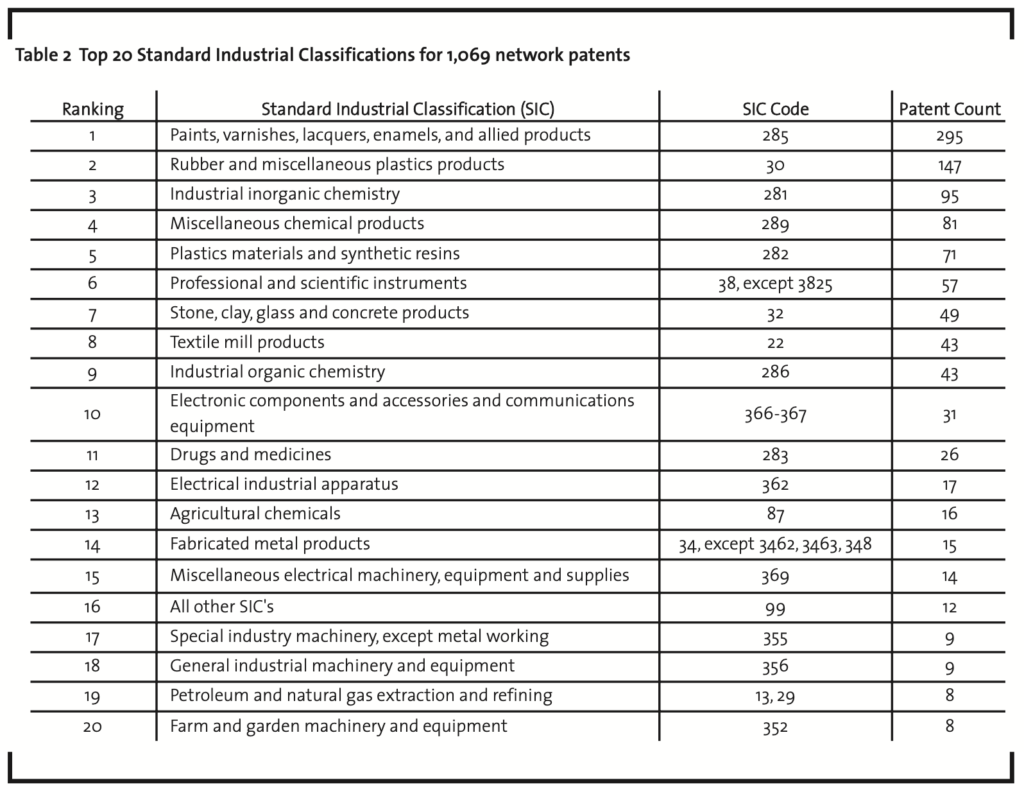
The 1,069 network patents are classified by Standard Industrial Classification (USPTO UPC to SIC concordance, 2008), as shown in Table 2, there are 295 patents in No. 1 classification (paints, varnishes, lacquers, enamels, and allied products), and 147 patents in No. 2 classification (rubber and miscellaneous plastics products). The sum of No. 1 and No. 2, paints and plastics related, are more than one third of the total 1,069 network patents. This possibly implies the incorporation of nanoparticle into polymer matrix are major technologies to obtain nanocomposite material and conventional painting, resin, plastic industries are easier to be involved in both nanotechnology and composite fields.
Patent citation network analysis
Overall network
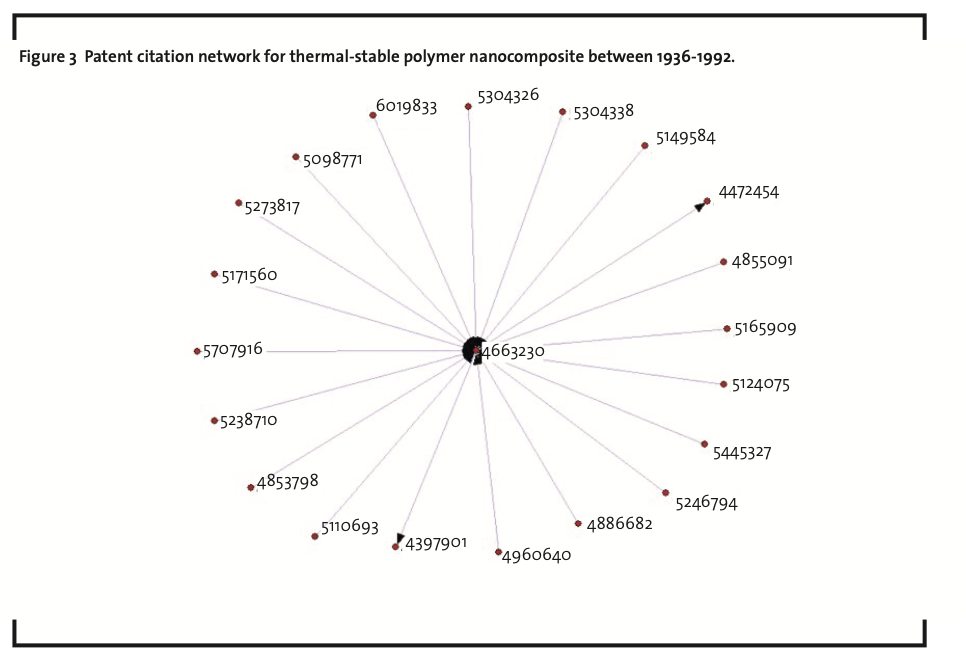
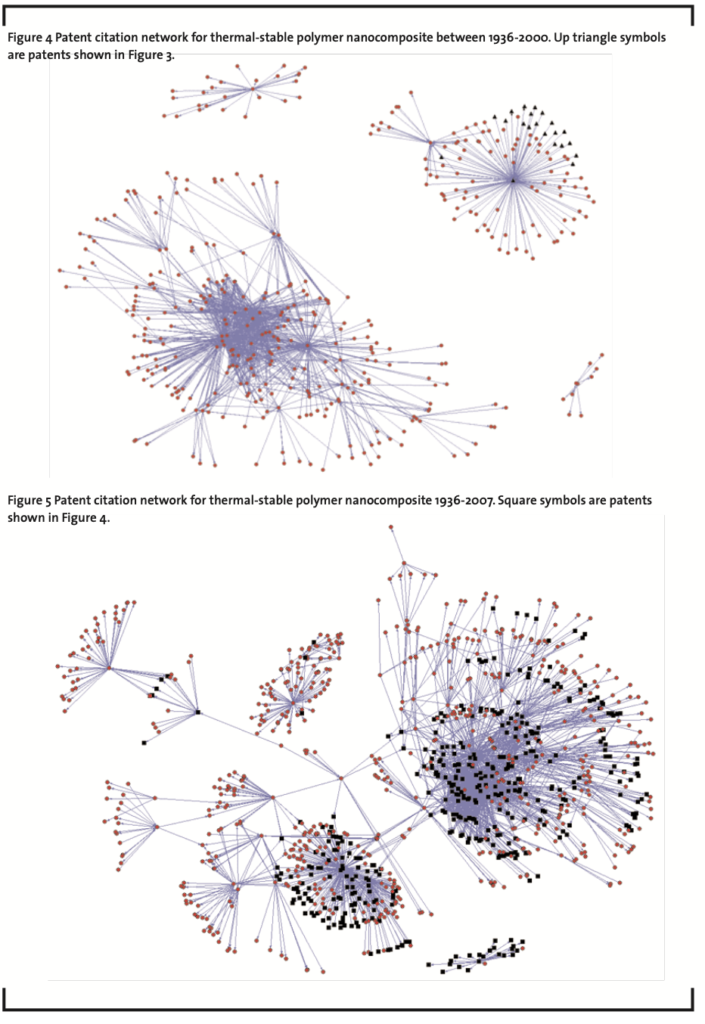
The patent citation network composed of 1,069 patents and 2,318 patent citation relationships are plotted by computer, shown in Figure 3-5 for patents filed on different time period (Note: patents which act as isolated node/actors without any networking behavior are not shown in the figures). Each node represents a patent and each network tie with arrow represents a citation relationship. The
patents pointed by arrows of the network ties are cited by those patents located at the other end of the network ties. In Figure 3, citation network based on patents filed in the period of 1936-1992 is plotted and only several patents are networked together and presented a simple radial structure. In Figure 4, more patents are networked together for the period of 19362000 but still several separated clusters can be observed. In Figure 5, networking is fully matured and almost all patents are networked together for the overall time period of 19362007 in this study.
Network properties calculation
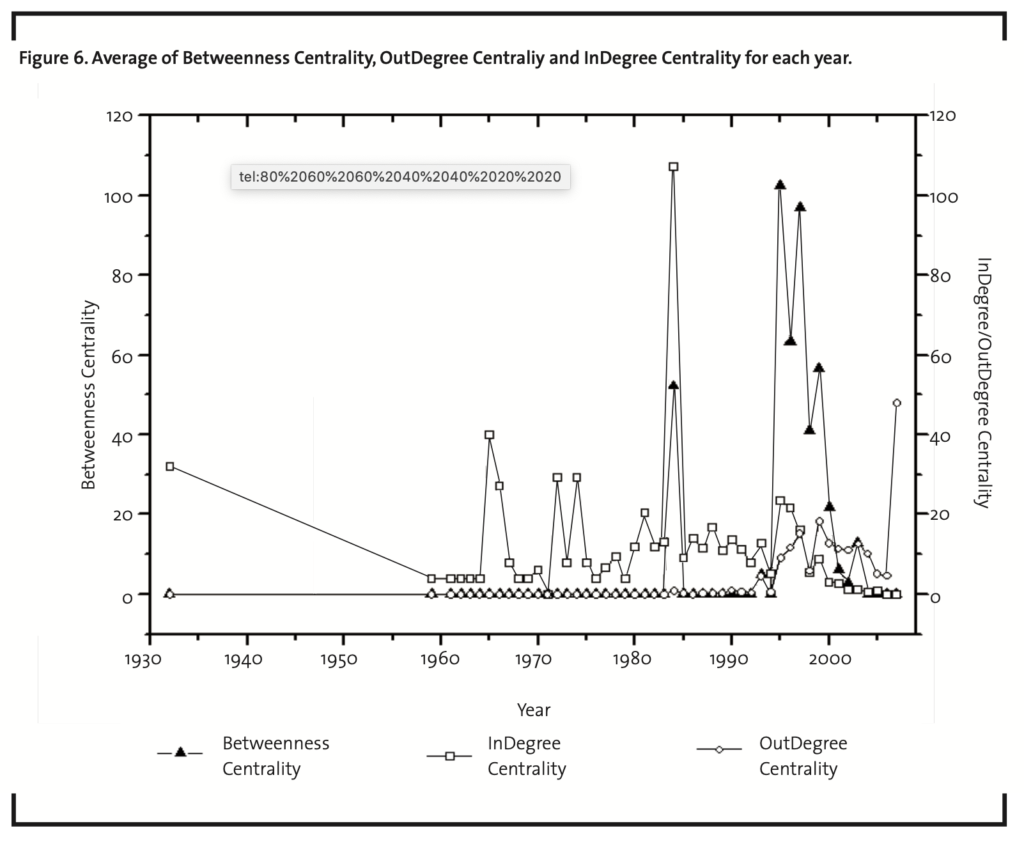
According to aforementioned method of calculating network properties, network properties, i.e. Betweenness Centrality, InCloseness Centrality, OutCloseness Centrality, InDegree Centrality and OutDegree Centality of each network node are calculated. Figure 6 shows the average of Betweenness Centrality, OutDegree Centraliy and InDegree Centrality for each year. Significant peaks around the period of 1984 and 1994-2002 indicate important time periods for development of related technology. After 1994-2002, network becomes more mature. The similar peak positions for Between Centrality curve, InDegree Cen trality and OudDegree Centrality curves suggest technology diffusion and technology transition are closely associated together.
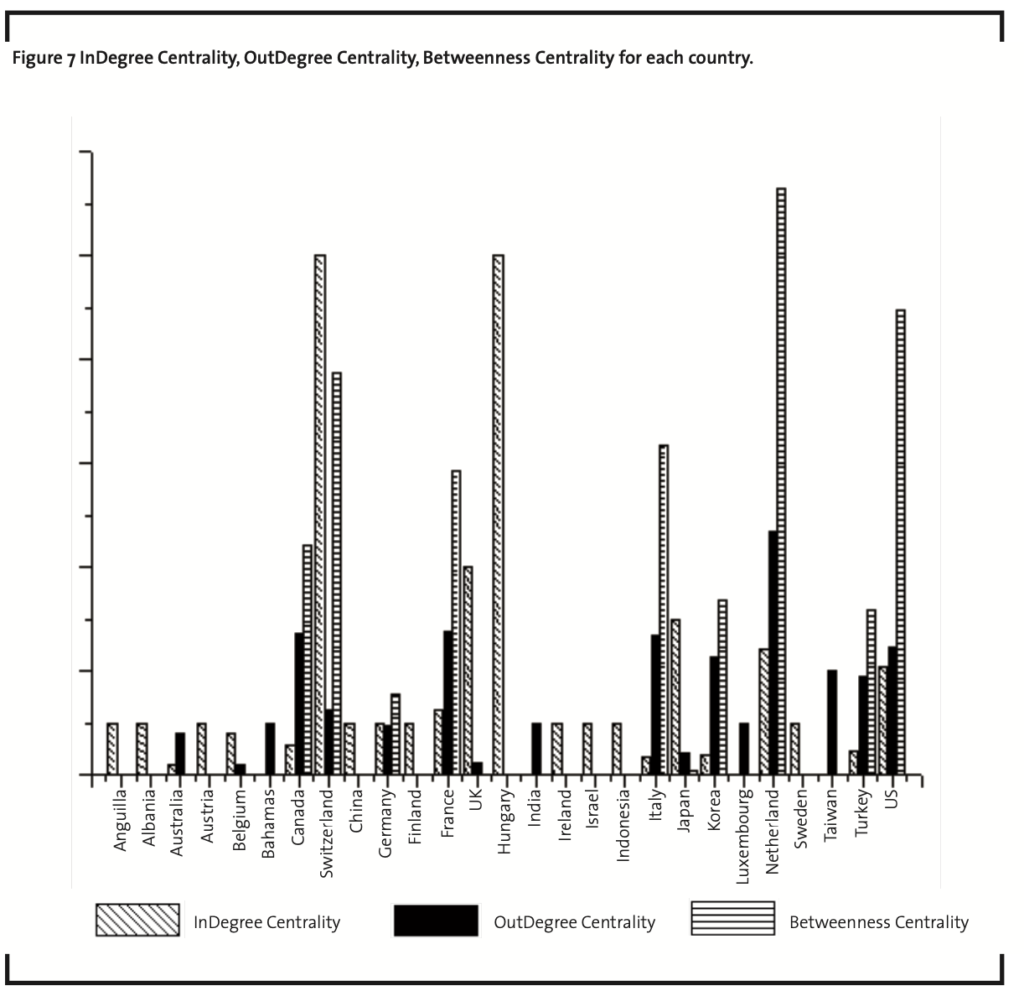
Network properties (InDegree Centrality, OutDegree Centrality, Betweenness Centrality) for each country are also averaged to determine how significant a country contributes to the development of technology. As shown in Figure 7, the Netherlands, the US, and Switzerland are the three countries with the highest Betweenness Centralities. Hungary, Switzerland and the UK are the three countries with the top InDegree Centralities and the Netherlands, France and Canada are the three countries with the top OutDegree Centralities. However, since each country possesses different number of patents, statistical bias maybe possible for countries with limited number of patents.
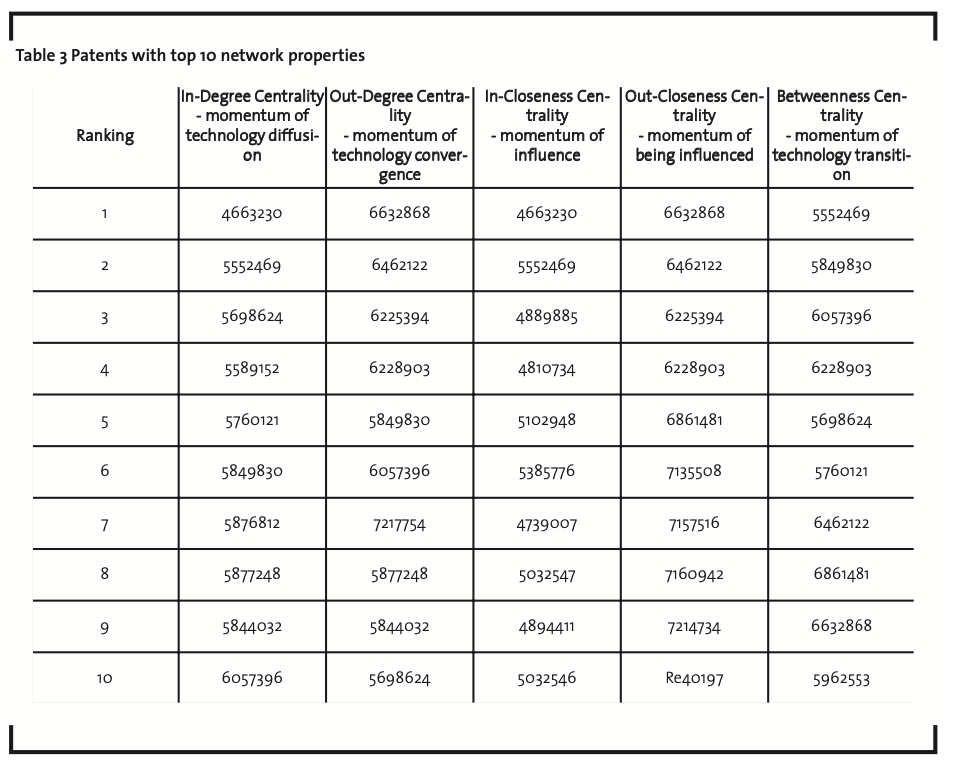
Table 3 shows patents with top 10 network properties. These patents with top network properties are core patents or key technologies that are classifies by aforementioned mentioned momentums of technology development, i.e. technology diffusion, technology convergence, influence, being influenced, technology transition. By examining information of core patents listed in Table 3, intercalated and exfoliated polymer/layered silicate composite material is the most important material in nanocomposite technique development. AMCOL, HYPERION CATALYSIS INTERNATIONAL, SOLVAY ENGINEERED POLYMERS, KABUSHIKI KAISHA TOYOTA CHUO KENKYUSHO UBE INDUSTRIES LTD are top companies in nanocomposite industry.
Quantitative application of patent citation network analysis to business management
The calculated network properties can be provided as a basis for diverse business management applications, where quantitative calculation is required to have mathematical evidence for determining objective business management policies.
1) R&D resource allocation: patent network centrality is a function of time due to the always-increasing number of patents in theUSPTO database. The dynamic network centrality reflects the increase or decrease of importance of a patent over time. The patent holder can estimate how much R&D resource to be introduced to the patented techniques according to the amplitude of the network centrality change of the patent.
2) Performance evaluation: the correlation between how much R&D resource input to generate a patent and the degree of network centrality of the patent can be estimated.
![]()
3) Patent map: a citation network can be converted to a two-dimensional patent map (countour plot) by the use of proper algorithms to allow easy visualization by human eyes and help understand distribution of global patents. This allows quantifying technology development path to obtain optimal patent portfolio and avoid potential infringement.
4) Patent valuation: even though a lot of methodologies have been provided to evaluate patent value, network centrality, which is directly related to defree of importance, might provide a new dimension for patent valuation where quantitative calculation is essential.
Conclusion
Social network analysis on patent citation is demonstrated in this study to explore how technology development can be evolved from a citation network which visually represents the essential structure of technology evolution. Also, the linkages between the five different mechanisms of technology evolution and the five network properties, namely the concordance between technology evolution mechanisms and network properties, are defined and proposed in this study in order to provide a quantitative approach toward understanding technology evolution mechanisms for thermal-stable nanocomposite technology. A patented technique plays multiple roles and shows different levels of importance in terms of the proposed five types of mechanism. The evolution mechanism represented by network property is a function of time in the overall technology development. Therefore, by calculating patents’ network properties at different points of time, a dynamic and quantitative understanding of technology evolution can be obtained in response to Dosi (1982) and Kuhn (1970).
According to the large number of paints and plastics related patents in Table 2, it can be speculated that the incorporation of nanoparticle into polymer matrix is the major technology to obtain nanocomposite material and conventional painting, resin and plastic industries are easier to be involved in both nanotechnology and composite fields, and thus providing a platform for interdisciplinary convergence.
The similar peak positions for Between Centrality curve and InDegree Centrality curve in Figure 6 suggests technology diffusion and technology transition are closely associated together. Table 3 shows top centrality patents in one type of network property are easily to be top centrality again in other type of network properties. This suggests that each mechanism of technology evolution does not happen alone but is supposed to be more or less associated to other type of mechanisms. In other words, critical patents are easily to be important in all aspects of technology evolution mechanisms.
It is found that 1984 and 1994-2002 are the important years for the development of thermal-stable polymer nanocomposite and exfoliated and intercalated polymer layer silicate are the most critical techniques. The Netherlands, the US, Switzerland, Hungary, France, Canada and Japan are important countries in this field. According to standard industry classification, the largest portion of these patents is related to paints, resin and plastic.
Intercalated and exfoliated polymer/layered silicate composite material is the most important material in nanocomposite technique development. AMCOL, HYPERION CATALYSIS INTERNATIONAL, SOLVAY ENGINEERED POLYMERS, KABUSHIKI KAISHA TOYOTA CHUO KENKYUSHO UBE INDUSTRIES LTD are core companies in nanocomposite industry.
The length of a network tie in figures 3-5 is calculated for better visualization and has nothing to do with any network property. However, the length of a network tie can be proportional to similarity between two patents at both ends of a network tie. So it would be desirable to calculate similarity of two linked patents, for example, by calculating occurrence of the same keyword in the two patents. The obtained similarity can be used as the attribute of network tie. Text mining technique can possibly be applied on patents in each separated sub-domains in Figure 4 to understand the differences among sub-domains. So deeper insight about how technology is evolved in each sub-domain can be understood in future study.
This research proposes a systematic and quantitative method to analyze individual patented techniques as well as obtain an overview of large amount of selected patents. The quantitative method provided in this paper shows a possible way of evaluating patents. And thus, a computerized calculation is possible for potential quantitative applications on business magement, e.g. R&D resource allocation, research performance evaluation, patent map visualization, patent valuation, etc. This provides different ways for patent holders to increase their competitive advantages in their businesses.
REFERENCES
Acosta, M., & Coronado, D. (2003): Science-technology flows in Spanish regions An analysis of scientific citations in patents, Research Policy, 32 (10), pp.17831803.
Baldwin C, Hughes J, Hope T, Jacoby R, & Ziebland S. (2003): Ethics and dementia: Mapping the literature by bibliometric analysis, International Journal of Geriatric Psychiatry, 18 (1), pp.41-54.
Bhattacharya, S., & Basu, P. K. (1998): Mapping a research area at the micro level using co-word analysis, Scientometrics, 43 (3), pp.359-372.
Brass, D. J., & Burkhardt, M. E. (1992): Centrality and power in organizations. In N. Nohria & R. G. Eccles (Eds.), Networks and Organizations: Structure, Form and Action, Boston, MA: Harvard Business School Press, pp. 191-215.
Callon, M., Courtial, J. P., & Laville, F. (1991): Co-word analysis as a tool for describing the network of interactions between basic and technological research: The case of polymer chemistry, Scientometrics, 22 (1), pp.155-205.
Cambrosio, A., Limoges, C., Courtial, J.-P., & Laville, F. (1993): Historical Scientometrics? Mapping Over 70 Years of Biological Safety Research with Co-Word Analysis, Scientometrics, 27 (2), pp.119-143.
Chiu, W., & Ho, Y. (2007): Bibliometric analysis of tsunami research, Scientometrics, 73 (1), pp.3-17.
Chiu, W., Huang, J., & Ho, Y. (2004): Bibliometric analysis of severe acute respiratory syndrome-related research in the beginning stage, Scientometrics, 61 (1), pp.6977.
Clarke, A., Gatineau, M., Thorogood, M. & Wyn-Roberts, N. (2007): Health promotion research literature in europe 1995-2005, European Journal of Public Health, 17, pp.24-28.
Coulter, N., Monarch, I., & Konda, S. (1998): Software engineering as seen through its research literature: A study in co-word analysis, Journal of the American Society for Information Science, 49 (13), pp.1206-1223.
Courtial, J. P. (1994): A coword analysis of scientometrics, Scientometrics., 31 (3), pp.251-260.
Ding, Y., Chowdhury, G. G., & Foo, S. (2001): Bibliometric cartography of information retrieval research by using co-word analysis, Information Processing & Management, 37 (6), pp.817-842.
Dosi, G. (1982): Technological paradigms and technological trajectories: A suggested interpretation of the determinants and directions of technical change, Research Policy, 11 (3), pp.147-162.
Freeman, L. C. (1979): Centrality in Social Networks: Conceptual Clarification, Social Networks, 1, pp.215-239.
Granovetter, M. S. (1973): The strength of weak ties, American Journal of Sociology, 78 (6), pp.1360-1380.
Gupta, B. M., & Bhattacharya, S. (2004): A bibliometric approach towards mapping the dynamics of science and technology, Desidoc Bulletin Of Information Technology, 24, pp.3-8.
Hall, B. H., A. Jaffe, and M. Trajtenberg (2000): Market Value and Patent Citations: A First Look. NBER Working Paper #7741.
Hinze, S. (1994): Bibliographical cartography of an emerging interdisciplinary discipline: The case of bioelectronics, Scientometrics, 29 (3), pp.353-376.
Ho, Y. (2007): Bibliometric analysis of adsorption technology in environmental science, Journal of Environmental Protection Science, 1, pp.1-11.
Jaffe, A. B., Trajtenberg, M., & Henderson, R. (1993): Geographic Localization of Knowledge Spillovers as Evidenced by Patent Citationsm, Quarterly Journal of Economics -Cambridge Massachusetts, 108 (3), pp.577598.
King, J. (1987): A review of bibliometric and other science indicators and their role in research evaluation, Journal of Information Science, 13 (5), pp. 261-276.
Kuhn, T. S. (1970): The structure of scientific revolutions, Chicago: University of Chicago Press.
Law, J., & Whittaker, J. (1992): Mapping acidification research: A test of the co-word method, Scientometrics, 23 (3), p.417-461.
Li, T., Ho, Y. S., & Li, C. Y. (2008): Bibliometric analysis on global parkinson’s disease research trends during 1991-2006, Neuroscience Letters, 441 (3), pp.248-252.
Liebowitz, J. (2005): Linking social network analysis with the analytic hierarchy process for knowledge mapping in organizations, Journal of Knowledge Management, 9 (1), pp.76-86
Looze, M. d., & Lemarie, J. (1997): Corpus relevance through co-word analysis: An application to plant proteins, Scientometrics, 39 (3), pp.267-280.
Mai, Y. W., & Yu, Z. Z. (2006): Polymer nanocomposites, Woodhead Publishing, Limited, Cambridge, England.
Manias E. (2007): Nanocomposites: Stiffer by Design, Nature Materials, 6, pp.9-11. Morgan A. B, & Wilkie C. A. (2007): Flame retardant polymer nanocomposites, Hoboken, NJ, John Wiley & Sons.
Noyons, E. C. M., & Raan, A. F. J. v. (1998): Monitoring scientific developments from a dynamic perspective: Selforganized structuring to map neural network research, Journal of the American Society for Information Science, 49 (1), pp.68-81.
Noyons, E. C. M., & Van Raan, A. F. J. (1994): Bibliometric cartography of scientific and technological developments of an R&D field. the case of optomechatronics, Scientometrics, 30 (1), pp. 157-173.
Otte, E., & Rousseau, R. (2002): Social network anlaysis: a powerful strategy, also for the information sciences, Journal of Information Science, 28 (6), pp.441453.
Rikken, F., Kiers, H. A. L., & Vos, R. (1995): Mapping the dynamics of adverse drug reactions in subsequent time periods using INDSCAL, Scientometrics., 33 (3), pp.367-380.
Rip, A., & Courtial, J. P. (1984): Co-word maps of biotechnology: An example of cognitive scientometrics, Scientometrics, 6 (6), pp.381-400.
Stuart, T. E., & Podolny, J. M. (1996): Local Search and the Evolution of Technological Capabilities, Strategic Management Journal, 17, pp.21-38.
Tian, Y., Wen, C., & Hong, S. (2008): Global scientific production on GIS research by bibliometric analysis from 1997 to 2006, Journal of Informetrics, 2 (1), pp.65-74.
United States Patent and Trademark Office (2008): A Concordance Between the U.S. Patent Classification (USPC) System and the Standard Industrial Classification Code (SIC) System, available at http://www.uspto.gov/web/offices/ac/ido/oeip/catal og/products/tafresh1.htm#USPC-SIC, accessed 11 June 2008.
Van Raan, A. F. J., & Tijssen, R. J. W. (1993): The neural net of neural network research. an exercise in bibliometric mapping, Scientometrics, 26 (1), pp.169-192.