Correlation between Sales and Profit Development and Ownership Type in the Chinese Chemical Industry
This paper examines the correlation between ownership type of chemical companies in China and the development of their sales and profit in the period from 2006 to 2012. Data from China´s statistical yearbook for the industry segment “Manufacture of Raw Chemical Materials and Chemical Products” was used, which covers all larger companies with annual sales above about 20 million RMB of sales (more than 20,000 companies in the segment). The results show a strong correlation between ownership type and growth in profit and sales. Private domestic companies perform best, achieving sales and profit growth rates that are substantially above the industry average. In contrast, the performance of foreign-owned chemical companies is slightly below industry average while the results of state-owned chemical enterprises are substantially below industry average. Possible reasons for the difference in performance are given, and consequences for the different ownership types are discussed.
1 Introduction
One of the main differences between the chemical industry in China and in Western countries is the existence of three distinct major types of ownership: private-owned, foreign-owned and stateowned. The ownership type affects many relevant properties such as company goals, amount of local control, technical knowledge, management style and others. As a consequence, the ownership type may have an impact on the performance of chemical companies in China.
Several studies have aimed at identifying the correlation between ownership type and company performance in China, though none of these studies looked specifically at the chemical industry. For example, Wei et al. (2002) found that a higher remaining share of state ownership in newly privatized companies lowered the performance of these companies. In contrast, Sun et al. (2002) found a positive relationship between government ownership and firm performance in companies listed in Chinese stock markets, though the authors admit that this may be due to monopoly rents derived from their government ownership. The results of Xiao et al. (2000) point in a similar direction. They found that legal person shares have positive effects on firm performance while state ownership has a negative impact – however, they state that this is true only in the competitive electronics industry and not in less competitive industries such as utilities. Finally, Wei et al. (2005) found that state ownership is negatively related to firm value while foreign ownership is positively related.
The objective of the research outlined in this paper was to examine the correlation between ownership type and the development of company performance in the Chinese chemical industry as this is the main area of interest and expertise of the author. Ideally, such research would focus on individual chemical companies that changed their ownership type while leaving other relevant parameters unchanged. However, this would result in a very small sample size, and even for these samples, gathering performance data would likely be impossible. Instead, the research was based on the data given in the Chinese statistical yearbook. This data includes the aggregated sales and profits for each of the three main ownership types within the period of 2006-2012, split by industry segment. For the period of 2006-2011, the number of employees per ownership segment is also available, allowing some additional analyses such as sales and profit per employee.
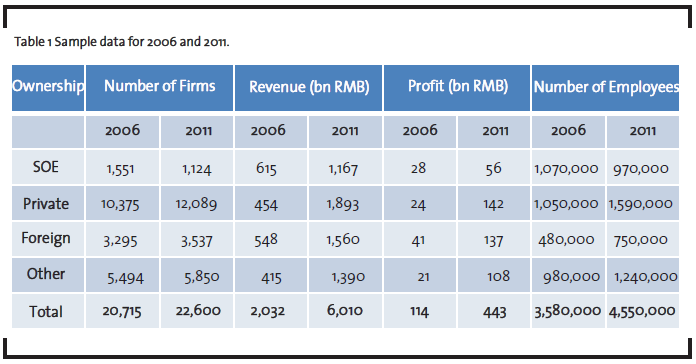
In total, the sample thus covers 22,600 chemical companies with total combined sales of 6,010 billion RMB, total combined profits of 443 billion RMB and a total number of employees of 455,000 (data for 2011).
2 Analysis Details
The data used for the analysis was taken from the Section “Industry” of the China Statistical Yearbook, editions 2007-2013, which contain data for the years from 2006-2012. All data was taken without any corrections as given by the National Bureau of Statistics of China.
Worksheets utilized were “Main Indicators of Industrial Enterprises above Designated Size by Industrial Sector”, “Main Indicators of State-owned and State-holding Industrial Enterprises by Industrial Sector”, “Main Indicators of Private Industrial Enterprises by Industrial Sector”, and “Main Indicators of Industrial Enterprises with Hong Kong, Macao, Taiwan and Foreign Funds by Industrial Sector”.
In each worksheet, data for the industry segment “Manufacture of Raw Chemical Materials and Chemical Products” (as defined in China’s national Standard of Industrial Classification, GB/T 4754- 2011) was used as a proxy for the chemical industry. This segment includes the sub segments of basic chemicals manufacturing, fertilizer manufacturing, pesticide manufacturing, coatings manufacturing, plastics manufacturing, specialty chemicals manufacturing, explosives manufacturing and manufacturing of household chemicals. It does not include manufacturing of pharmaceuticals, chemical fibers, tires, plastic parts and non-metallic mineral products such as gypsum.
Data used from these worksheets to characterize the chemical industry were Number of Enterprises, Revenue from Principal Business, Total Profits, and Number of Employees (see Tab. 1 for the sample data for selected years). All data referred to mainland China only. Particularly in the case of foreign-owned enterprises, this may lead to some distortion as parts of their value creation may have been done outside of China. For example, foreignbased researchers of foreign-owned companies may develop products which are also sold in China – however, they will not be counted among the Chinese employees of the company despite their participation in the value creation process.
According to the China Statistics Yearbook, the scope of industrial statistics were all industrial enterprises with mainland China revenue from principal business of over 5 million RMB from 1998 to 2010. Since 2011, the scope was adjusted to all industrial enterprises with mainland China revenue from principal business above 20 million RMB. This adjustment needs to be considered in the discussion of the results. For example, the higher threshold starting from the year 2011 may have led to lower figures for the years 2011 and 2012 than for the previous year. However, in the chemical industry 20 million RMB (about 2.4 million Euro at 2014 exchange rates) is still a low sales threshold in the chemical industry, thus the distortions are likely to be only small. In general, the size threshold is most likely to lead to an underrepresentation of the share of private enterprises as these are on average by far the smallest companies of the three ownership types. However, the results shown below qualitatively hold true even if such an underrepresentation indeed occurred.
As indicated by the worksheets listed above, the statistical yearbook reports data for the whole industry segment as well as for three different ownership types.
State-owned and state-holding enterprises are state-owned enterprises plus state-holding enterprises. State-owned Enterprises are non-corporation economic units where the entire assets are owned by the State. State-holding enterprises are a sub-classification of enterprises with mixed ownership, referring to enterprises where the percentage of state assets (or shares by the state) is larger than any other single shareholder of the same enterprise.
Private enterprises are profit-making economic units invested and established by natural persons, or controlled by natural persons using employed labor. Included in this category are private limited liability corporations, private limited share-holding corporations and private partnership enterprises.
Foreign-owned companies are companies with at least a 25% share of ownership from outside mainland China.
The ownership share not accounted by any of these three types is still fairly large, accounting for about 20-25% of total segment sales. However, it is not split up further. The vast majority of this segment (more than 80%) is accounted for by limited liability corporations with 2-50 domestic investors. As such, this company type is most closely related to private companies as the segment is neither state- nor foreign-owned, and presumably driven primarily by profit motives. An indication of this fact is that the results for this “Other” segment of ownership are similar to those of the segment of private ownership. However, due to the mixed nature of the “Other” segment, the results for the segment are not discussed.
Unfortunately no complete and consistent data was available for the period before 2006, and for 2012, no data on the number of employees was available. This limited the observation period analyzed.
While using this data allows detecting correlations between economic parameters and ownership type over the course of the observation period, it also has its own risks and thus requires careful interpretation of the initial results. For example, state-owned enterprises may be concentrated in specific sub segments of the chemical industry which are characterized by a performance development that is different from the overall chemical industry. In addition, the average company size is correlated to the ownership type, complicating the identification of causation.
In addition to using the data from the statistical yearbook, a number of open interviews with participants, primarily managers of state-owned, private domestic and foreign-owned companies, in the chemical industry in China have been conducted. The information obtained in these interviews formed an important part of the evaluation of performance differences by ownership type.
3 Results
3.1 Revenue Development
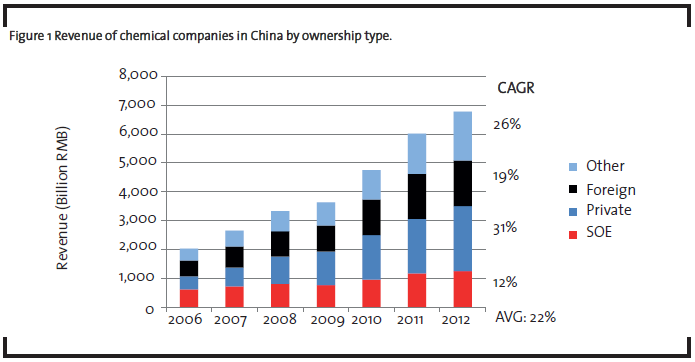
Revenues of the chemical industry in China more than tripled between 2006 and 2012 (Fig. 1). Domestic privately owned chemical companies were the key driver of this growth. They increased their share of revenue from 22% to 33% percent, a fivefold increase in absolute terms. During the same period, SOEs only about doubled their sales. The compound annual growth rate (CAGR) of private enterprises ´ revenue thus was much higher (31%) than the CAGR of the total chemical industry sales (22%). Revenue growth of state-owned enterprises was substantially below market average with a CAGR of only 12%. The CAGR of foreign-owned companies was slightly below overall market growth with 19%.
In order to assess productivity trends by ownership type, sales per employee were calculated as well. The results (Tab. 2) show that all chemical companies independent of their ownership type strongly increased their sales per employee, with an average annual growth rate of 18% across all types. Those ownership types with higher sales per employee at the beginning of the observation period (in particular, foreign companies, but also to some extent SOEs) showed slower growth in sales per employee during the observation period.
3.2 Profit Development
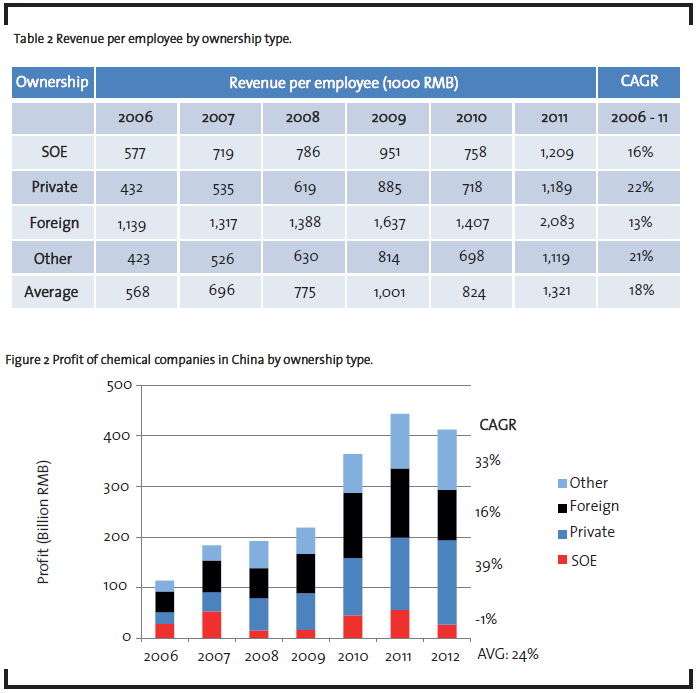
Total profits of the chemical industry in China increased approximately fourfold between 2006 and 2012. This was a faster growth than the sales growth, with a CAGR of 24% compared to only 22% for sales. Similar to the situation regarding sales development, private companies were the key drivers for the growth in profit. They approximately doubled their share of profit from about 20% to 40%, both at the expense of SOEs, whose share of profits dropped from about 25% to about 7%, and of foreign companies, whose share dropped from about 36% to about 24%. In terms of annual profit growth, the difference between different ownership types is also very clear. While profit of private companies grew at a CAGR of 39% (15% higher than market average), the profit growth of foreign companies was substantially below market average (CAGR of 16% compared to a CAGR of 24% for the whole industry). SOEs even had a minor drop in profits in absolute terms, though this may have been due to some specific events in 2012, as SOE profits in 2012 were only about half the level of the previous year.
Profits per employee rose strongly for all ownership types of chemical companies. However, this growth was much lower for foreign companies and SOEs than for private companies. As a consequence, private chemical companies by 2011 achieved substantially higher profits per employee than SOEs despite a lower starting point at the beginning of the observation period. Private companies also reduced the relative gap to foreign companies, though in 2011 profit per employee was still only about half the level of that of foreign companies.
In fact, private chemical companies obtained substantially higher profits per employee in 2011 than SOEs even though they were still slightly lagging behind them in 2006. The gap to foreign companies also decreased substantially, being reduced from a factor of four to a factor two within the observation period.
3.3 Employment Development
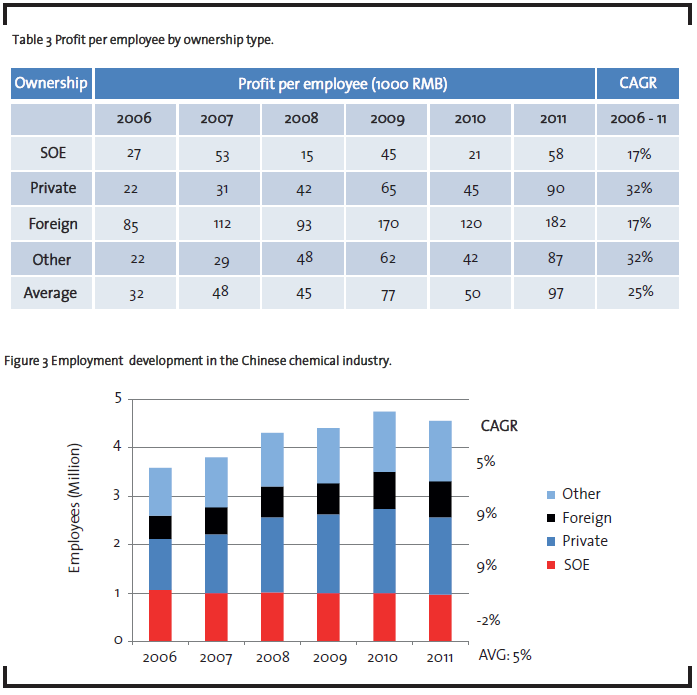
Employment in the chemical industry rose by about 27% in the period from 2006 to 2011. This is a substantial increase, but it is small compared to the increase in sales (+196%).
Employment by SOEs slightly declined in absolute terms and more strongly in relative terms (from about 30% to about 21% of all employees) but correspondingly rose for all other ownership types, particularly for private companies (+6% of relative share of employees). The percentage of employees working for foreign companies increased by about 3% despite the decreasing sales share of foreign companies
3.4 Other Results
Among all ownership types, SOEs are by far the biggest companies by sales, with the average chemical SOE reaching annual sales of about 1000 million RMB in 2011. Foreign companies are less than half this size (average sales 440 Million RMB) and private companies are again much smaller (average sales 157 Million RMB). Sales per company grew by more than 20% per year for all companies, though growth was fastest for private companies. The number of SOEs shrank substantially during this period (from 1,551 to 1,124 units), which had the consequence of sales per SOE growing at a higher rate than total SOE sales.
Profitability, if defined as total profits divided by revenue, was highest for foreign enterprises, reaching 8.7% in 2011. However, private companies showed the strongest increase in profitability during the observation period and reached 7.5% in 2011, not too far below the foreign companies. Stateowned chemical enterprises showed the lowest profitability as well as the lowest growth rate of profitability.
4 Discussion
Focusing on the trends noted during the observation period, the two most interesting results are the much higher growth of domestic chemical companies compared to foreign companies, and the much higher growth of domestic chemical companies compared to SOEs. It is assumed that there is indeed causation and not just a correlation between ownership type and growth in the given circumstances, the rationale for which will be discussed below.
However, another possible explanation is that the lower average size of the private companies is the main reason for their higher revenue growth. Indeed a smaller company is likely to have a higher growth potential than a larger company already commanding a large market share in its segment, and company size is a well-recognized factor influencing company growth. This explanation cannot be rejected as the data does not allow a differentiation between ownership type and company size. However, the growth difference between private and state-owned entities is so large that it is unlikely that different average company size is the only reason.
Therefore below the higher growth of private domestic companies compared to state-owned and foreign-owned chemical companies in China will be discussed based on the assumption that the ownership type does have an impact on sales growth under the conditions examined.
4.1 Higher growth of domestic private companies compared to foreign chemical companies
Anecdotally, the higher growth of domestic chemical companies compared to foreign companies in China has been mentioned by many industry observers and participants. The data analyzed in this research shows that this phenomenon is real. However, there is uncertainty about the reason behind the faster growth of domestic companies. A number of explanations have been brought forward by consultancies and managers of chemical companies, and will be discussed below. The hypotheses include
- Preference of Chinese customers for low-cost products
- Increasing capability of Chinese companies to produce higher-quality products
- Specific advantages of local companies based on their local ownership, e.g., better access to local raw materials, government preference to buy from local companies
- Better local adaptation of domestic companies, e.g., regarding product requirements, ways of promoting sales, selecting sales channels, etc.
- Greater flexibility of domestic companies
- Greater focus of foreign companies on profits compared to revenue focus of domestic companies (particularly SOEs)
- Higher willingness to invest in the Chinese chemical market
Low-cost preference: In many Chinese markets end consumers have a stronger preference for lowcost products (and usually corresponding lower quality) than in Western markets. This applies to consumer goods such as shoes and consumer electronics as well as to cars and individual materials used in construction (e.g., water pipes, coatings, etc.), all of which include materials produced by the chemical industry. Producers of low-cost products mainly choose their chemical raw materials based on price while largely ignoring quality differences. This favors domestic chemicals producers who have a larger portfolio of low-end products and lower production costs. In contrast, foreign- owned companies are often unable to compete in the very low-end chemical segments due to higher production and overhead costs as well as a reluctance to use their established brand names for low-quality materials. However, as a stand-alone explanation, this low-cost preference in the Chinese market is insufficient to explain the faster growth of private domestic chemical companies. Undoubtedly the same low-cost preference existed in China at the start of the observation period. If anything, it has probably weakened somewhat as some consumer segments got wealthier and thus got more willing to pay for higher-quality goods.
Improved local products: In the recent past, China´s chemical companies have substantially increased the quality level and the variety of their products. In some areas, the last 10 years have seen a shift from distinctly substandard locally produced chemicals to some which are highly competitive. For example, the isocyanate producer Wanhua now reaches the same quality level as its global competitors such as BASF and Bayer. The rapid improvement of Chinese chemical materials has partly been enabled by former employees of foreign companies joining local firms and utilizing their experience. For example, Tianhe, a Chinese producer of lubricants, expanded into fluorotelomers through the hiring of some former DuPont experts and now is one of the leading global players in fluorotelomers. Generally, however, the gains in sales for domestic companies are most visible in relatively mature segments, where chemical substances have been fairly unchanged in the last 10 years. This gave domestic companies the time to catch up with the foreign competition. Most industry participants agree that the technology gap between foreign and domestic chemical companies is indeed shrinking, and that this is a major factor in explaining the faster growth of local chemicals producers.
Specific advantages of local companies: In some chemical segments, multinational companies may have direct or indirect disadvantages due to government regulation and lack of access to local raw materials. For example, participation in the booming segment of coal conversion to chemicals requires access to China´s coal at low prices, which is not given to foreign companies. In petrochemicals, foreign companies are restricted to joint ventures without majority ownership – it is likely that this also creates some disadvantages in those steps in the chemical value chain that are directly based on output from the petrochemical industry. Similarly, the Chinese government prefers local buyers over foreign companies. The various stimulus programs of the government, which focus heavily on infrastructure investment, thus favor domestic producers of, e.g., steel coatings, construction chemicals and transportation equipment. This preference may even be stronger on the provincial level, with individual provincial governments preferring the suppliers located in their own province. However, among managers in the Chinese chemical industry, the importance of such specific advantages is generally regarded to be relatively low.
Better local adaptation: As foreign companies are still managed from outside of China, they do not always have the same level of local market understanding as domestic chemical companies. For example, for German producers of chemicals it is still sometimes difficult to understand the local preference for lower prices over higher quality. As a consequence, chemical products produced by German companies tend to be somewhat over-specified – the quality is higher than required by local customers. Of course, local companies also tend to have a better understanding of how to market their chemicals, how to deal with distributors, how to deal with local competitors etc. However, this aspect of better local knowledge and adaptation is likely to have decreased in importance in the recent past as foreign companies have already been in China for some time, and increasingly rely on local staff even on more senior levels.
Greater flexibility: Local chemical companies tend to be less rigid with regard to their products, their target markets etc. For example, several Chinese urea producers reacted to the existing overcapacity by moving towards fine chemicals. Other domestic chemical companies even engaged heavily in businesses outside of chemicals, in particular, in real estate and in finance. They are generally also faster to expand production once local opportunities are spotted. For foreign companies, both the limited local autonomy and the stronger belief in a long-term company strategy make such rapid shifts in business focus less likely.
Focus on sales volume rather than on profit: Foreign companies focus strongly on profitability in their investments, for example, when investing in additional production capacity or in acquiring another company. This may limit their sales to highly profitable segments. Indeed, anecdotal evidence suggests that profitability requirements are lower at private domestic chemical companies. However, as the data analysis shows, profits per employee have increased much faster for domestic companies than for foreign companies. In 2006 employee productivity of private companies (as measured by revenue per employee) was only 38% of that of foreign companies while at the end of the observation period in 2011, they already reached 57% of the productivity of foreign companies. This seems plausible as productivity gains are most easily achieved if the starting productivity is low. The adaptation of common practices would be expected to lead to a gradual convergence of productivity, particularly in the case of extreme productivity differences at the starting point. In any case, there is no trend towards a further lowering of profitability requirements by local private companies, making this an unlikely reason for the recent higher sales growth of local companies.
Higher willingness to invest in the Chinese chemical market: Anecdotal evidence suggests that private chemical companies in China reinvest a larger share of their profit into their existing business than foreign companies. This is plausible as China still only offers a limited choice of investment options to its citizens, and in addition, repatriation of profits is not an option for local companies. However, additional research is necessary to determine whether this is an important factor in explaining the faster growth of local companies.
Of the aspects discussed, our judgment suggests the improved quality of domestic chemical products to be almost certainly a key reason for the faster growth of local chemicals producers. While foreign chemical companies may also have somewhat improved the quality of their products, the potential was much more limited due to the high starting level of quality. The improved product quality is particularly relevant for the growing mid-level market segment in China. While in the past there was a vast gap in quality between high-end and low-end products, recently the level in between becomes more and more important. On the demand side, China´s growing urban middle classes have the means to require somewhat higher quality than before without already asking for high-end products. On the supply side, both foreign and domestic companies target this market. The foreign companies do this by localizing their value chains to lower their costs, and by adapting their existing high-end products to slightly lower local standards. Local producers already have a cost advantage and increasingly raise the quality level of their products in accordance with these mid-market requirements. Chemicals producers are either directly or indirectly – as raw materials suppliers – affected by these developments.
It should also be noted that the data in the statistical yearbook does not reflect any changes in the underlying companies (e.g., companies exiting the data pool due to lower sales). While this may have an impact on the results which cannot be reflected in the analysis, this effect is assumed to be small compared to the effects described above.
4.2 Higher growth of domestic private companies compared to SOEs
There are three most likely reasons for the low growth of SOEs compared to private companies. Chemical SOEs are primarily active in mature chemical segments with lower growth potential, such as the production of ammonia, sulfuric acid, PVC or other commodity chemicals. These sub segments of the Chinese chemical market have lower growth rates than the whole market, similar to the growth difference between basic and specialty chemicals in Western countries.
Secondly, SOEs are less flexible in quickly expanding in growth areas and attractive market niches than private companies. This is partly due to their larger size, but also due to the more bureaucratic nature of their company structure and the larger number of people involved in the process of taking business decisions.
Thirdly, SOEs may not regard rapid sales growth as their main objective. In fact, political pressure to increase sales and particularly profits so far has been very limited (e.g., via a requirement to pay dividends to the state owners), though there are indications that this may be changing in the future. SOEs have a role in providing employment, and many loss-making units are under substantial pressure not to reduce their workforce. This may also explain the limited growth that chemical SOEs show in productivity per employee. To some extent, the role of SOEs is the administration and utilization of existing chemical assets rather than the maximization of sales via rapid adoption to changing market needs.
5 Outlook
The analysis suggests that private companies have the highest growth and profit rates in the Chinese chemical industry in the recent past. They substantially increased their share of sales while at the same time increasing their share of profits to an even larger extent. Judging from the ongoing changes in the later years of the observation period, this development is not over yet. Private chemical companies are likely to increase their sales share even further in the next few years. The gap between the product quality of foreign and domestic companies still exists, giving private chemical companies future potential for catching up. As the chemical industry is a relatively mature industry, it will be hard for foreign companies to compensate for the upgrading of local products via new, more advanced products.
In contrast, SOEs have been very much on the defensive. Their growth was significantly below market growth, and consequently their overall market share and their importance in China´s chemical industry decreased. This may be aligned with a deliberate government policy of giving the market a greater role in the economy. However, it still leaves open the question of the future of the chemical SOEs, with the possible exception of the dominant petrochemical companies such as Sinopec and PetroChina. These big SOEs have strategic roles in securing key raw materials for China and may thus receive long-term government support more easily despite their low profitability. However, smaller SOEs may have to accept the shrinking role as providers of employment and thus social stability rather than as profit-driven enterprises, unless the government increases its efforts to maintain their relevance. For foreign companies, the analysis may seem somewhat disillusioning. An annual sales growth of 19% in the period from 2006 to 2012 certainly sounds impressive from the perspective of stagnant Western markets, and it explains the strong focus of foreign chemical companies on China. However, compared to an average annual market growth of 22% during the same period, the achievements of foreign players are much less impressive. This development is most likely the consequence of a shrinking technology and knowledge gap between foreign and domestic companies. Given the rapid advances of local companies within the relatively short observation period, maintaining a high market share in China will be a huge challenge to foreign chemical companies. As a consequence, foreign companies may have to adapt to their shrinking technological superiority over the Chinese competitors, and adapt their activities accordingly – for example, by developing more localized products and by focusing more on cost competitiveness. In the long run, competition between foreign and domestic chemical companies in China will presumably be one between comparable players, much like competition between, e.g., German and US chemical companies in the US market.
References
CBNS (China Bureau of National Standards) (2011) The national standard GB/T4754―2011 (in Chinese).
Xiao, Chen and Dong, Jiang (2000): Ownership Pluralization, Firm Performance and Industry Competition, Economic Research Journal, 8, 29-35.
China Statistical Yearbook (2006-2012): available at http://www.stats.gov.cn/english/statisticaldata/AnnualData, accessed on August 25, 2014.
Sun, Qian, Tong, Wilson H.S. and Tong, Jing (2002): How Does Government Ownership Affect Firm Performance? Evidence from China’s Privatization Experience, Journal of Business Finance & Accounting, 29 (1) & (2), 1-27.
Wei, Zuobao and Varela, Oscar (2003): State equity ownership and firm market performance: evidence from China’s newly privatized firms, Global Finance Journal, 14, 65-82.
Wei, Zuobao, Xie, Feixue and Zhang, Shaorong (2005): Ownership Structure and Firm Value in China’s Privatized Firms: 1991-2001, Journal of financial and quantitative analysis, 40 (1), 87-108.