Enhancing market-oriented R&D planning by integrated market and patent portfolios
Abstract
Marketing and R&D strategies need to be aligned to increase the return from investment in new technologies. Various portfolio techniques have been widely used to support strategic planning. A new portfolio approach integrating market and technology portfolios to support market-oriented R&D planning is developed. The integrated portfolio is based on objective market and patent data and empirical evidence that the respective portfolio dimensions impact a company’s business performance. This contributes significantly to the relevance of the proposed integrated portfolio approach for strategic planning. It is tested in a practical application in the chemical industry. Based on these experiences, a set of recommendations for the effective use of the integrated portfolio for market-orientated strategic R&D planning is derived.
Introduction
Market orientation is a key driver of company performance [1]. Accordingly, companies should align their core activities with market requirements. Among a company’s most important activities is the development and market introduction of new products because this determines sustained company success in many industries [2–4]. It has been frequently shown that the alignment of all process steps from idea to launch with market requirements is a success factor of new product development [5–7]. Consequently, research and development (R&D) should be focused on designing new products which satisfy market requirements.
Technological change has been found to have a decisive impact on the competitive structure in many industries [8–10]. Thus, even if market requirements remain basically unchanged, technological progress can severely effect a company’s competitive position. These changes need to be identified and assessed as early as possible in order to align the firm’s R&D strategy accordingly [11–13]. Thus, market requirements and technological capabilities need to be assessed simultaneously in order to formulate effective strategies for new product development.
It has been shown in empirical studies that the integration of market requirements and technological capabilities during new product development increases success [14,15]. At the same time, integration ought to be achieved also on the strategic level, i.e. Marketing and R&D strategy must be aligned [16]. There is empirical evidence that a strategy which balances market requirements and technology capabilities leads to higher new product success [17,18].
The strategic management of a firm’s R&D portfolio enhances the success of new products [19]. To support strategic planning various portfolio concepts have been developed over the years. In the 1970s, market portfolios became popular to support strategic planning in large corporations. However, a product’s underlying technologies were not assessed in market portfolios which posed the danger to overlook technological changes and to make wrong investment decisions. Consequently, technology and patent portfolios were developed from the 1980s onwards to assess technologies according to their competitive impact [11,20]. However, technology portfolios lack an explicit market focus. Thus, the need arises to integrate market and technology portfolios based on objective data in order to achieve a better alignment of Marketing and R&D strategies in companies. In this paper, we first develop such an integrated portfolio approach to support market-oriented R&D planning. Subsequently, we test the proposed portfolio method in a practical application. This paper concludes with an evaluation of the proposed portfolio method and with suggestions for further applications.
Development of an Integrated Portfolio Concept
A The Market Portfolio
The concept of product portfolio analysis is one of the most widely used tools in the field of strategic planning. Its origins date back to the late sixties when diversified companies were facing an increasingly complex strategic planning process. Therefore, companies had to find new ways to assure an effective and efficient management of the company’s resources. The Boston Consulting Group developed its market share/market growth matrix for this purpose. It is still the most widely known and implemented approach [21,22]. It enables managers to easily comprehend and communicate a complex problem, thus having a powerful tool supporting strategic decision making.
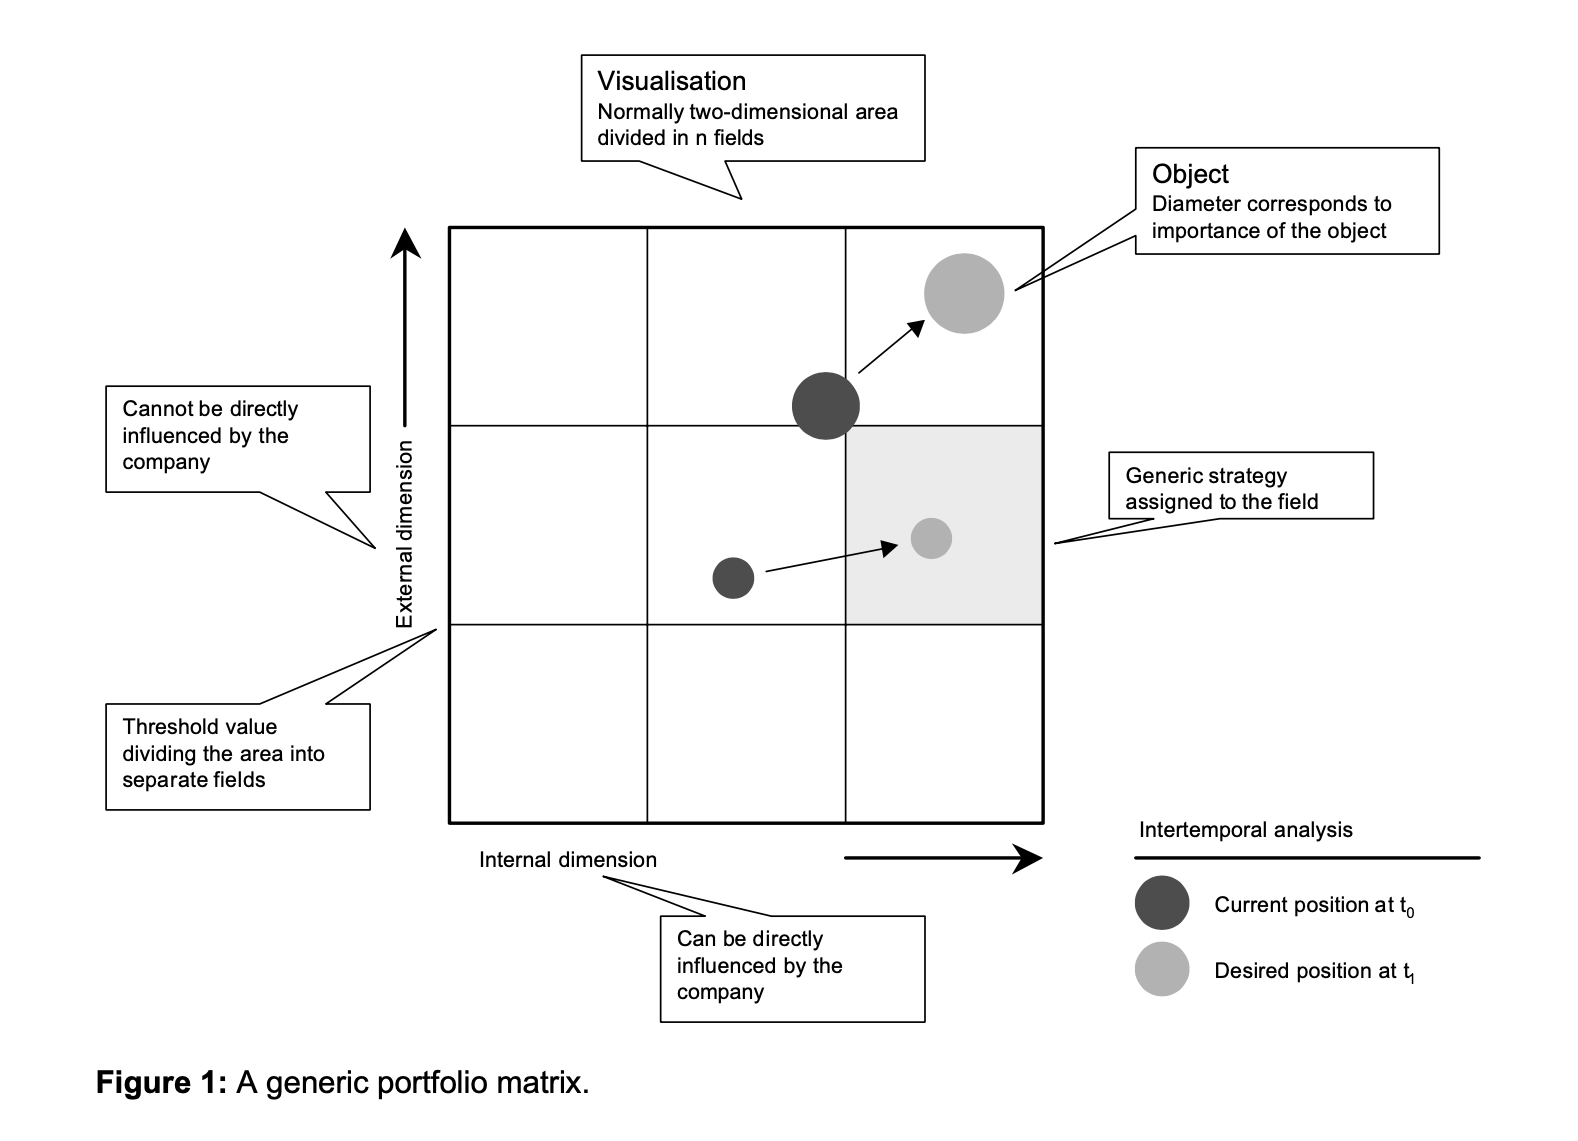
Subsequently many variants of this approach were developed, yet all varying the same basic structure [23]. All share a two dimensional framework with one dimension representing the competitive position in the respective market and the other one illustrating market attractiveness (see figure 1 for a depiction of a generic portfolio). The dimensions are either univariately or multivariately defined. The area spanned up by the dimensions is divided into four or more fields, each of them being assigned a generic strategic recommendation for the products or business units being positioned in the respective area. The size of the circles representing products or strategic business units is usually determined by the respective share of sales or a measure of profitability.
The market share/market growth approach is a sound concept regarding required data and underlying assumptions. It has been subject to much empirical research providing supporting evidence [24,25]. The required data is relatively easy to capture: market share and market growth can be objectively measured, the only problem being the correct definition of the relevant market [26].
However, critics quickly argued that the underlying assumptions are flawed. Indeed, there is empirical evidence that the relationship between market share and profitability is not as clear-cut as postulated in the generic strategies of the portfolio matrix [21]. Moreover, it is often argued that the data basis is too weak to make profound strategic decisions. This led to the development of product portfolio concepts using multivariate dimensions such as the market attractiveness/market position matrix developed by McKinsey [27]. In addition to market share, it uses a multitude of factors identified in the PIMS project, several of them qualitative and thus harder to measure. Their estimation may lead to biases due to the subjective nature of the respondent’s opinions.
Thus, one faces a trade-off between a simple concept incorporating few variables, which can be objectively measured, or a complex model requiring data, which are hard to capture, thus leaving room for biases. When using the approaches based on few variables, it is important to keep in mind the limited data base of the simpler approaches, on which the generic strategies are recommended.
Apart from these issues being more technical in nature, there is substantial criticism highlighting a central drawback of market portfolios. As they capture the market positioning of the company’s products or strategic business units and their respective current competitors, product portfolio analysis is essentially short-term oriented. It fails to capture external turbulences such as new technologies which affect the positioning in the portfolio and thus the recommended strategies.
B The Technology Portfolio
The Patent Portfolio
Patent data and patent statistics have long been used by economists as a proxy for technological change and technological process. There is significant empirical evidence supporting the validity of this approach [28]. Patent data have the big advantage that they are widely available and objective in nature. In a further step, entire portfolios assessing a company’s patent position were proposed [29,30]. These assign the company’s patents to different technology fields relevant to the company and evaluate them afterwards using different indicators entirely based on patent data. The patent portfolio shares its basic structure with the technology portfolio, having one dimension assessing technological position and the other one assessing technology attractiveness. As patent portfolios (see figure 2) will be an important element of the integrated portfolio concepts developed later on in this article, we will briefly describe the indicators used to assess technological positions. For a more detailed description, please refer to the articles by Brockhoff and Ernst [29–31].
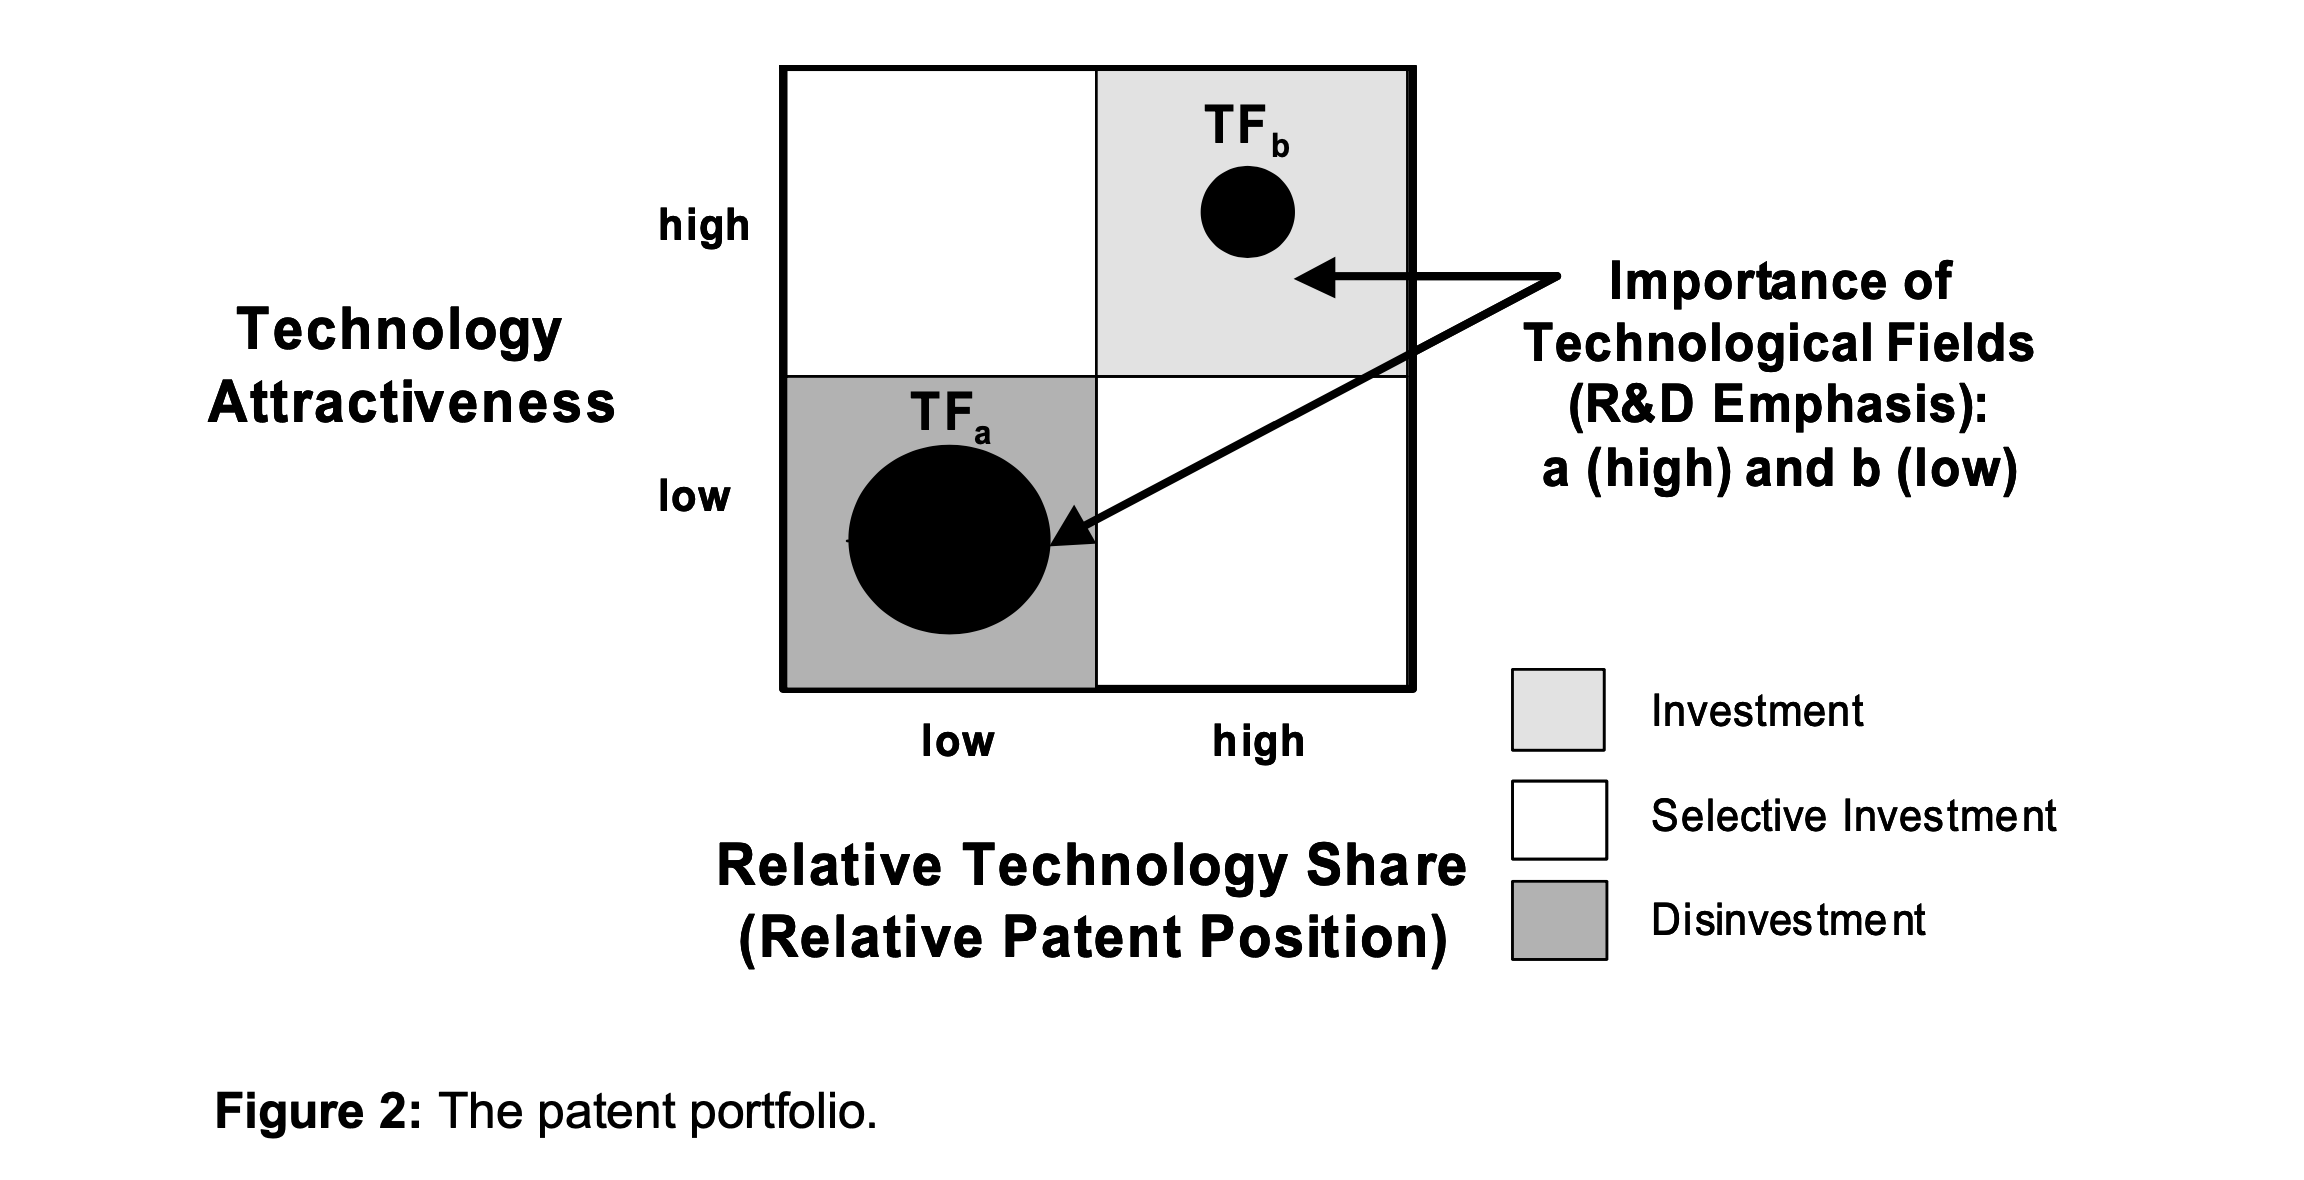
In analogy to the market growth/market share portfolio, it has been suggested to use the term ‘relative technology share’ in order to describe the competitive technological position in analogy to ‘relative market share’ commonly used to measure a firm’s competitive position in the market [32].
As this is a measure only incorporating patenting activity, but not accounting for the quality of patents, other operational definitions of the internal dimension have been proposed. Accounting for patent quality is an important link to establish an analogy between patent and market portfolios: both relative market share and relative technology share, incorporating patent quality, have a positive impact on a company’s business performance [33–36]. Therefore, a construct for patent quality consisting of different quality measures is used in newer approaches to assess the technological impact [37]:
1. Rate of patents granted: A patent will be granted only if the invention consists of new and non-obvious technological elements. Thus, a patent is believed to have a higher technological value than the patent application [38]. The rate of patents granted substantially differ between companies and can thus serve as one indicator for the quality of research.
2. International scope of patent applications: As the cost for obtaining valid patent for a number of countries is significantly higher than for a single national patent, the former have been empirically found to be of higher value than national applications only [28,37].
3. Patent Citation Ratio: Patents are used by examiners at the patent office to document the state of technology when they check if a patent application contains new and inventive features which go beyond what has been known so far. This procedure leads to patent citations. The number of citations received by a patent in subsequent patent documents is often interpreted as a proxy for the economic importance of the invention [39–41].
The use of different measures allows to achieve a stable assessment of a company’s patent position [31].
The external dimension ‘technology attractiveness’, which is displayed on the ordinate, is measured by the growth rate, either absolute or relative, of patent applications in the respective technology field. Using patent growth as a proxy for a technology’s attractiveness is supported by empirical studies showing a strong correlation between patent and market growth in various industries [12,37,42].
The third dimension represented by the circle size of the technology fields in the patent portfolio is called ‘R&D emphasis’. It is calculated as the total number of patent applications of the company in one technology field divided by the total number of all patent applications of the respective company. Thus, “R&D emphasis” indicates a technology’s importance in the company’s total R&D portfolio.
Generic strategies largely correspond to the generic strategies of the market growth/market share portfolio, e.g. to aggressively invest in technology fields with high growth and strong positions, i.e. high impact pacing and key technologies. Thus, the patent portfolio is the only technology portfolio grounded on a sound empirical basis.
Despite this fact, patent portfolios share the most important drawback with classic technology portfolios. R&D planning is only one aspect of strategic planning. It necessarily leads to the misappropriation of resources if only technological aspects are considered in the planning process. Therefore, they need to be aligned with other strategic planning tools in order to avoid one-sided misconceptions.
C The Integrated Portfolio
Pure technology or market portfolios have a one-sided focus on either technology or product market. We already elaborated on the importance of market orientation in the R&D process. New technologies have to fulfil market needs. Otherwise products based on them will fail in the market. The integrated portfolio concepts trying to overcome this shortfall by combining market and technological analysis can be classified into three distinct groups:
The first group builds upon an existing technology or market portfolio and adds generic strategies for the missing perspective [21,43]. Although this approach is intriguingly simple, it does not solve the central problem of incorporating the interdependencies. Applying similar strategic recommendations will only be valid if both technology and product are positioned in the same field of the portfolio. In all other cases, this will lead to a misallocation of resources and could even result in eroding the company’s competitive base.
A second class of concepts develops entirely new portfolio approaches. Some of them use the classic matrix-type visualisation [44], while others follow different approaches for the formulation of the optimisation problem. Some approaches in the latter category use a mathematical formulation of the portfolio problem and usually have a very stringent general formulation [45]. Being often rather complex and thus difficult to communicate and implement, these approaches lack practical relevance as well.
The third group of concepts tries to aggregate two or more single portfolios into one holistic portfolio [11,46]. This could either be a new single matrix-type portfolio, i.e. a condensation of four dimension into only two. This procedure leads to a visualisation which is easy to understand and to communicate, but encounters several methodological problems. Another approach is the integration using a common axis. Generally, this type of integration is theoretically sound as no data are omitted and the original portfolios remain largely unchanged. Their added value is the development of new integrated generic strategies.
Therefore, we will develop an integrated portfolio using this design, but following a more formalised approach to avoid the pitfalls of earlier concepts. Unlike other approaches, we will keep the amount of required data within reasonable limits in order to achieve an easy implementation while simultaneously building onto a theoretically sound basis.
In the following, we introduce a framework for the creation of concepts for integrated portfolios and simultaneously develop a new portfolio. It draws on elements of a framework by Wind/Mahajan [27], however incorporates necessary changes for the formulation of an integrated portfolio concept (see figure 3). The process of developing our integrated portfolio concept follows these steps. First, the portfolios which are subsequently integrated into a single portfolio are identified. We already made a case for the use of patent portfolios instead of other technology portfolios, the biggest advantage being the sound empirical foundation and the objective data used by them. Therefore, a matching market portfolio, which captures the advantages of the patent portfolio, needs to be identified. The only market portfolio entirely relying on objective data is the market share/market growth matrix.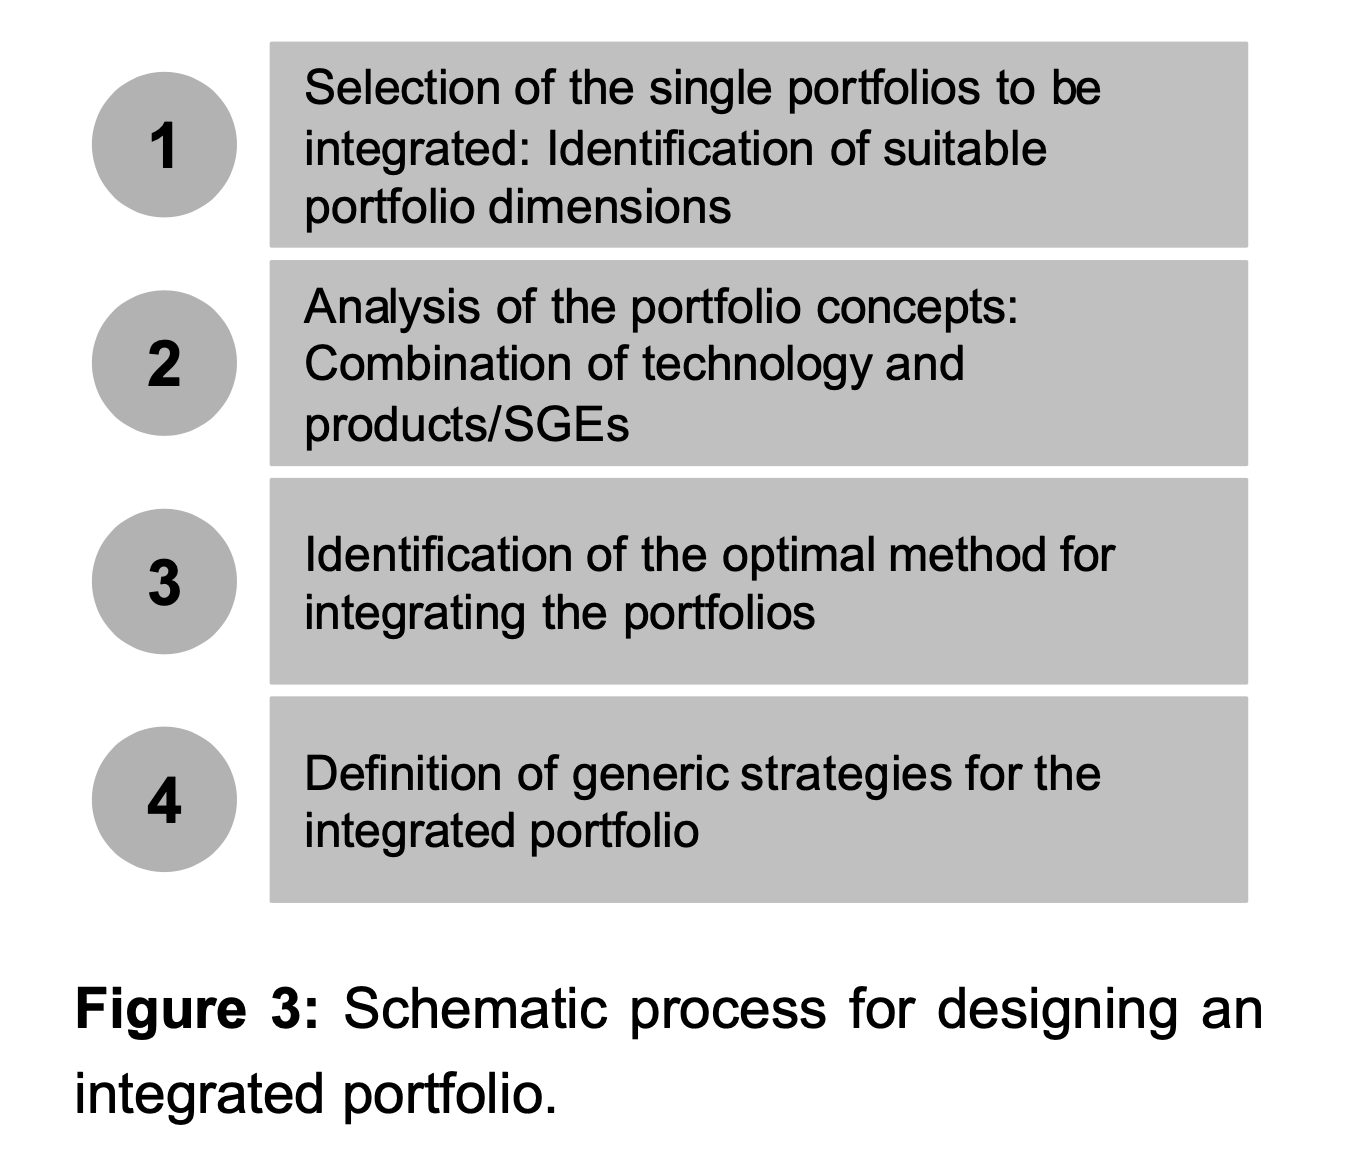
In a second step, a suitable integration mechanism has to be found. In order to come up with an integrated portfolio which can be easily communicated, the integration using a common dimension is desirable. In order to emphasise the importance of market orientation in the R&D process, we suggest using market growth in the integrated portfolio. This approach clearly follows the notion that the attractiveness of a technology has to be mainly judged on the basis of its market impact. The growth/share matrix is now easy to integrate as both portfolios share a common dimension (see figure 4). In case a technology has not yet been integrated into products, we suggest to use the measure “patent growth” as described in the initial patent portfolio in order to capture the attractiveness of the technology (see figure 2).
The third step is the inclusion of possible interdependencies between technologies and products into the analysis (see figure 4). The attractiveness of a technology field could be determined by the weighted average of the market growth rate of the products in which the technology field is applied. Weights could be defined as the share of one product’s contribution to the total sales generated by all products incorporating the respective technology.
Alternatively, a similar measure could be based on profit data. This way, all interdependencies between technologies and products can be captured. To assess new technologies not yet incorporated in existing products, we suggest using expert assessments to compensate for eventually missing quantitative market data.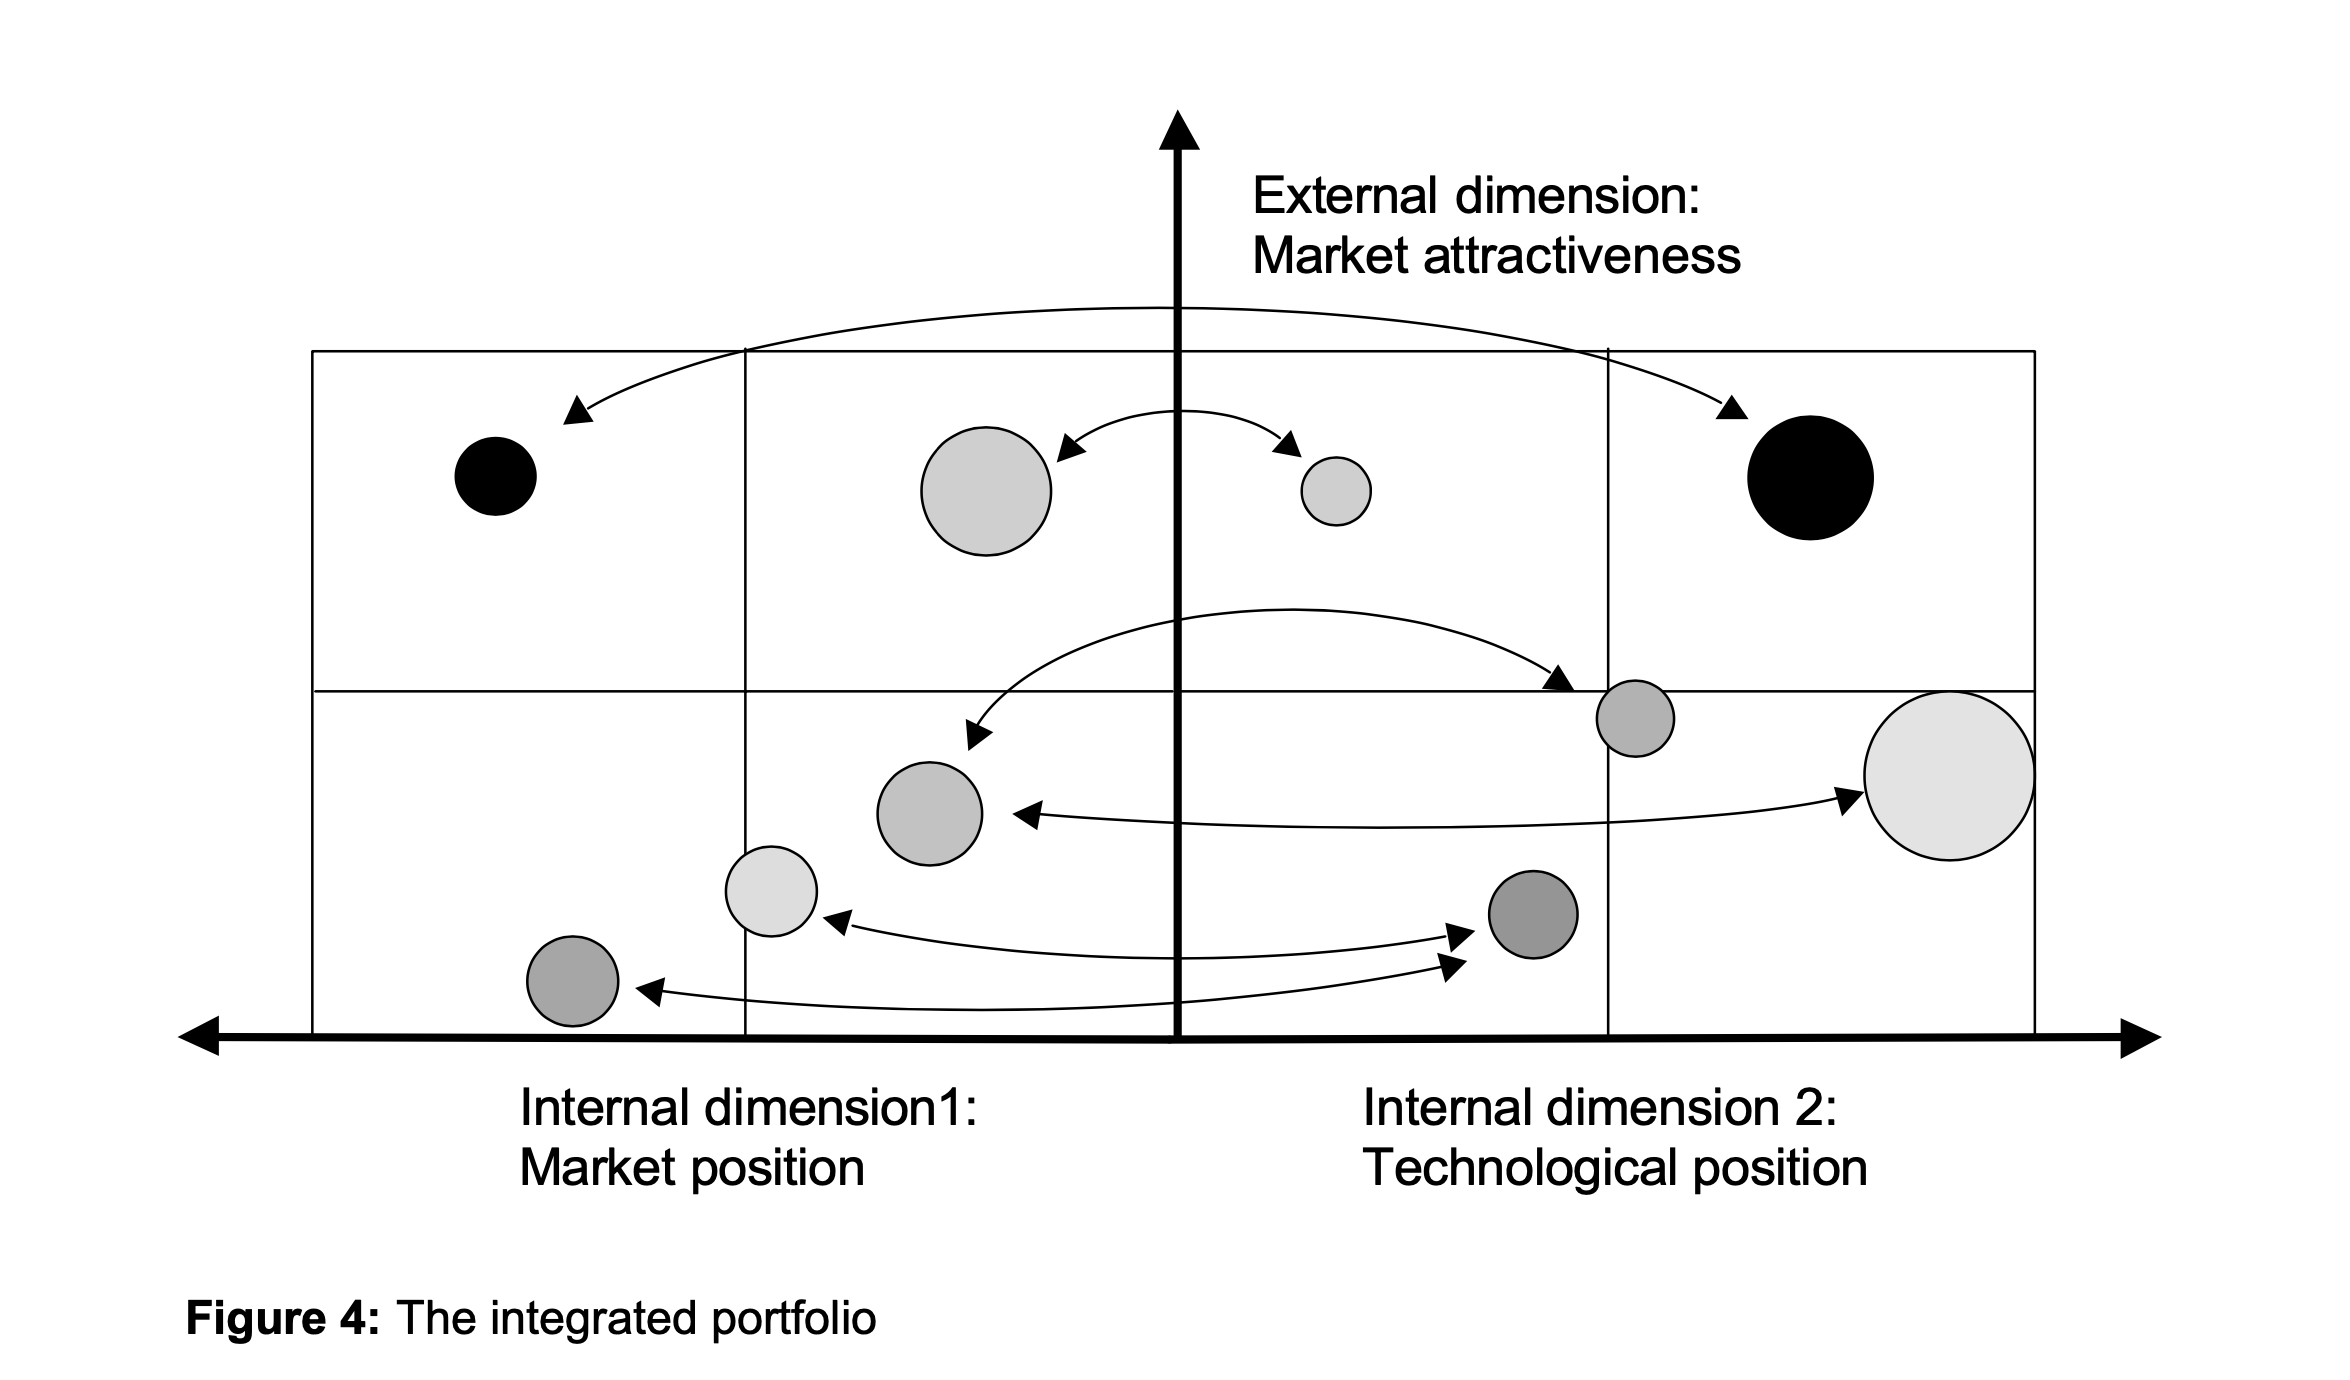
Each half of the proposed integrated portfolio is split into four quadrants: the dimension “market attractiveness” is divided by a hurdle growth rate, e.g. average sales growth or a sales growth target, the dimension “technology share” at a value of the relative technology share of 1, the “market share” dimension equally at a value of the relative market share of 1.
In the case of a positioning in the same quadrant in both market and patent portfolio, the combined generic strategies remain appropriate: for a product with a star/star positioning, increased marketing and R&D expenditures are necessary to reinforce market and technological positions and to counter attacks from competitors.
However, the generic strategies cannot be simply combined in case of disparate positionings. These could be interpreted as evidence for a misappropriation of R&D and/or marketing expenditures, but also simply result from industry specificities and thus not require any strategic action.
In all cases, the underlying situation has to be carefully evaluated in order to derive effective strategic implications from the portfolio analysis.
An Application of the Integrated Portfolio in the Chemical Industry
A Data Collection and Measurements
A first implementation of the proposed concept was carried out for two business units of a company operating in the specialty chemicals industry. For each unit, distinct product areas were defined. The entire analysis incorporates seven product fields and 22 products of Business Unit 1 and three product fields and 15 products for Business Unit 2. Here, we can only report on some characteristic results. The required patent data were supplied by the firm’s patent department. Patent applications were assigned to product fields and individual products in a workshop with senior patenting experts from the company.
The indicators described earlier required to draw patent portfolios had to be calculated. The share of granted patents was measured based on granted patents at the German Patent Office and international scope was calculated as the share of triad patents, filed in Europe, the US and Japan simultaneously, because it was believed by the experts from the patent department that this would best capture patent quality in this industry.
Due to the very specialised nature of the business units’ products, no market growth rates and market share data were available. Thus, we had to rely on expert evaluations instead. The dimensions market attractiveness, relative market share and revenue share driving the circle size in the market portfolio were evaluated using a questionnaire sent out to marketing managers asking for their estimation of relative market share in relation to the strongest external competitor, product market growth relative to the average growth in the business unit and product sales relative to the average sales per product in the business unit.
B Results of the Portfolio Analyses
Based on these raw data, we constructed multiple portfolio visualisations on the business unit and product field levels. Please refer to figure 5 for a sample portfolios. The visualisations were discussed in a joint meeting with marketing, R&D and patent managers from the company. Some of the discussion helps to better understand and interpret the portfolios.
The analysis on the product area level (figure 5) draws a picture of a very attractive area, i.e., each product growing at least as fast as the business unit. In most cases, the products are positioned in corresponding quadrants of the portfolio. Thus, R&D and Marketing strategies are well aligned in these product areas.
In some cases, however, there are obvious differences. Product 6 enjoys a strong market position in a high growth market. In contrast, its technology position is fairly weak.
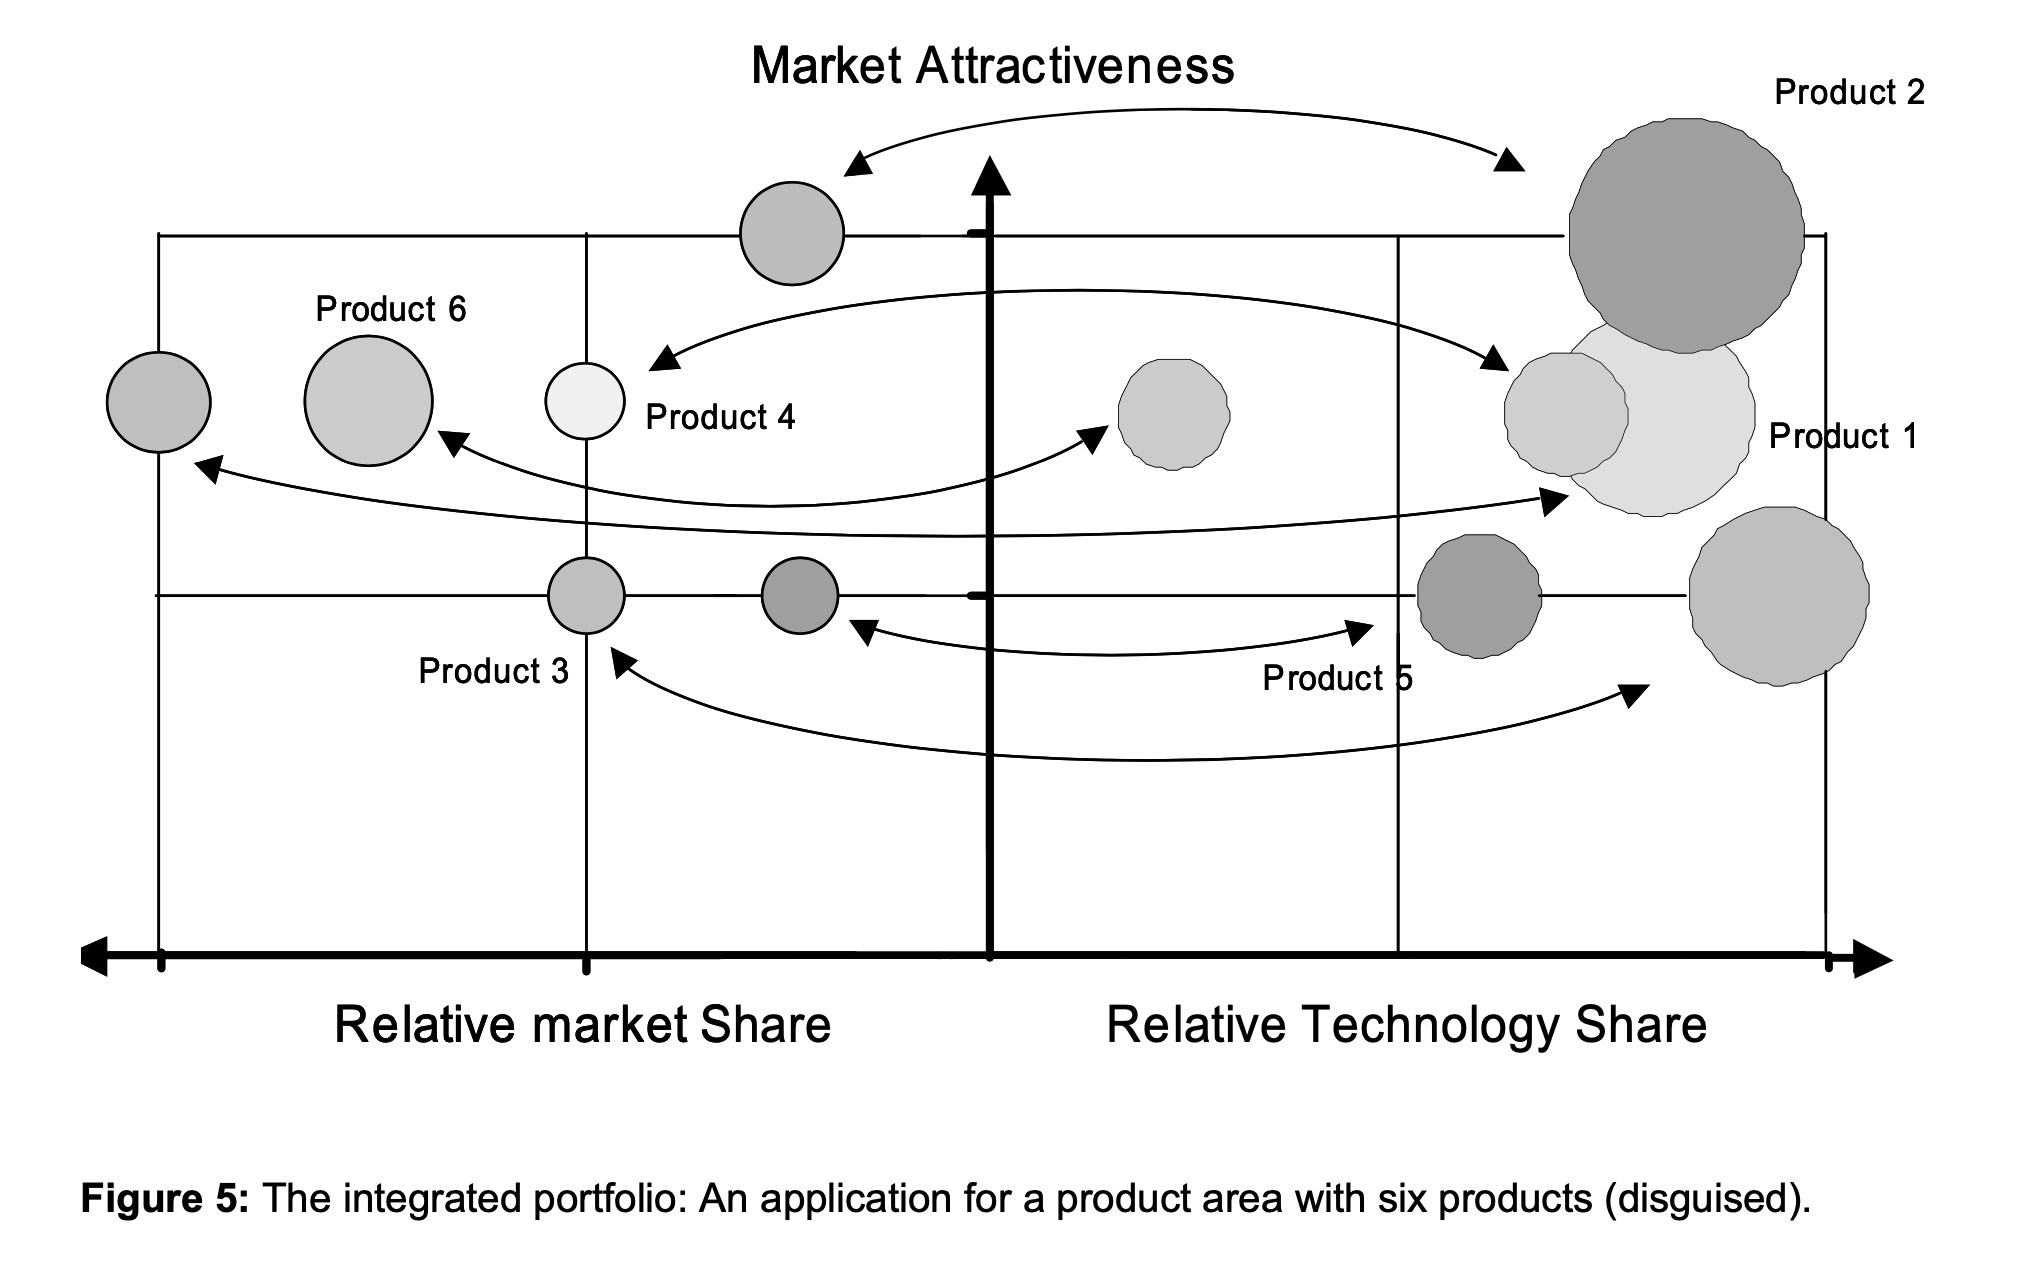
This disparate positioning could be attributed to the fact that the company was still in the process of reinforcing its technological position and thus still intended to file for more patents. The need for further R&D investment in this product is clearly highlighted by the portfolio analysis and will be further emphasised by the company.
Product 3 is characterised by a strong technological position and average numbers for market share and market growth. The company under consideration has a strong R&D emphasis on this product, however, the contribution to sales is rather modest. The discussion revealed that Marketing and R&D perceive the potential of the recently introduced product quite differently. It was decided to conduct a workshop with multiple company experts in order to reassess the attractiveness of this product. Based on the outcome a decision ought to be made whether R&D investments in this product should be realigned. The analysis at the business unit level follows a similar logic.
In sum, the integrated portfolio analyses have shown that market and technology positions in the company under consideration are not always aligned. These results have led to a first discussion among company managers on the root causes for the observed inconsistencies of portfolio positions. This already highlights the need for intensive discussion based on the portfolio presentations before final conclusions are made. All managers perceived this to be very helpful to gain a common understanding of Marketing and R&D strategies. To get a more details picture and in order to incorporate further knowledgeable experts and decisions makers in the company, it was decided to carefully review the marketing, patenting and R&D strategies for some of the concerned areas.
Conclusions
The integrated portfolio can be a powerful tool for strategic planning purposes because it offers an efficient and effective way to better align Marketing and R&D strategies. The integrated portfolio combines a widely known and used market portfolio concept with a patent portfolio capturing technological aspects. Both portfolios’
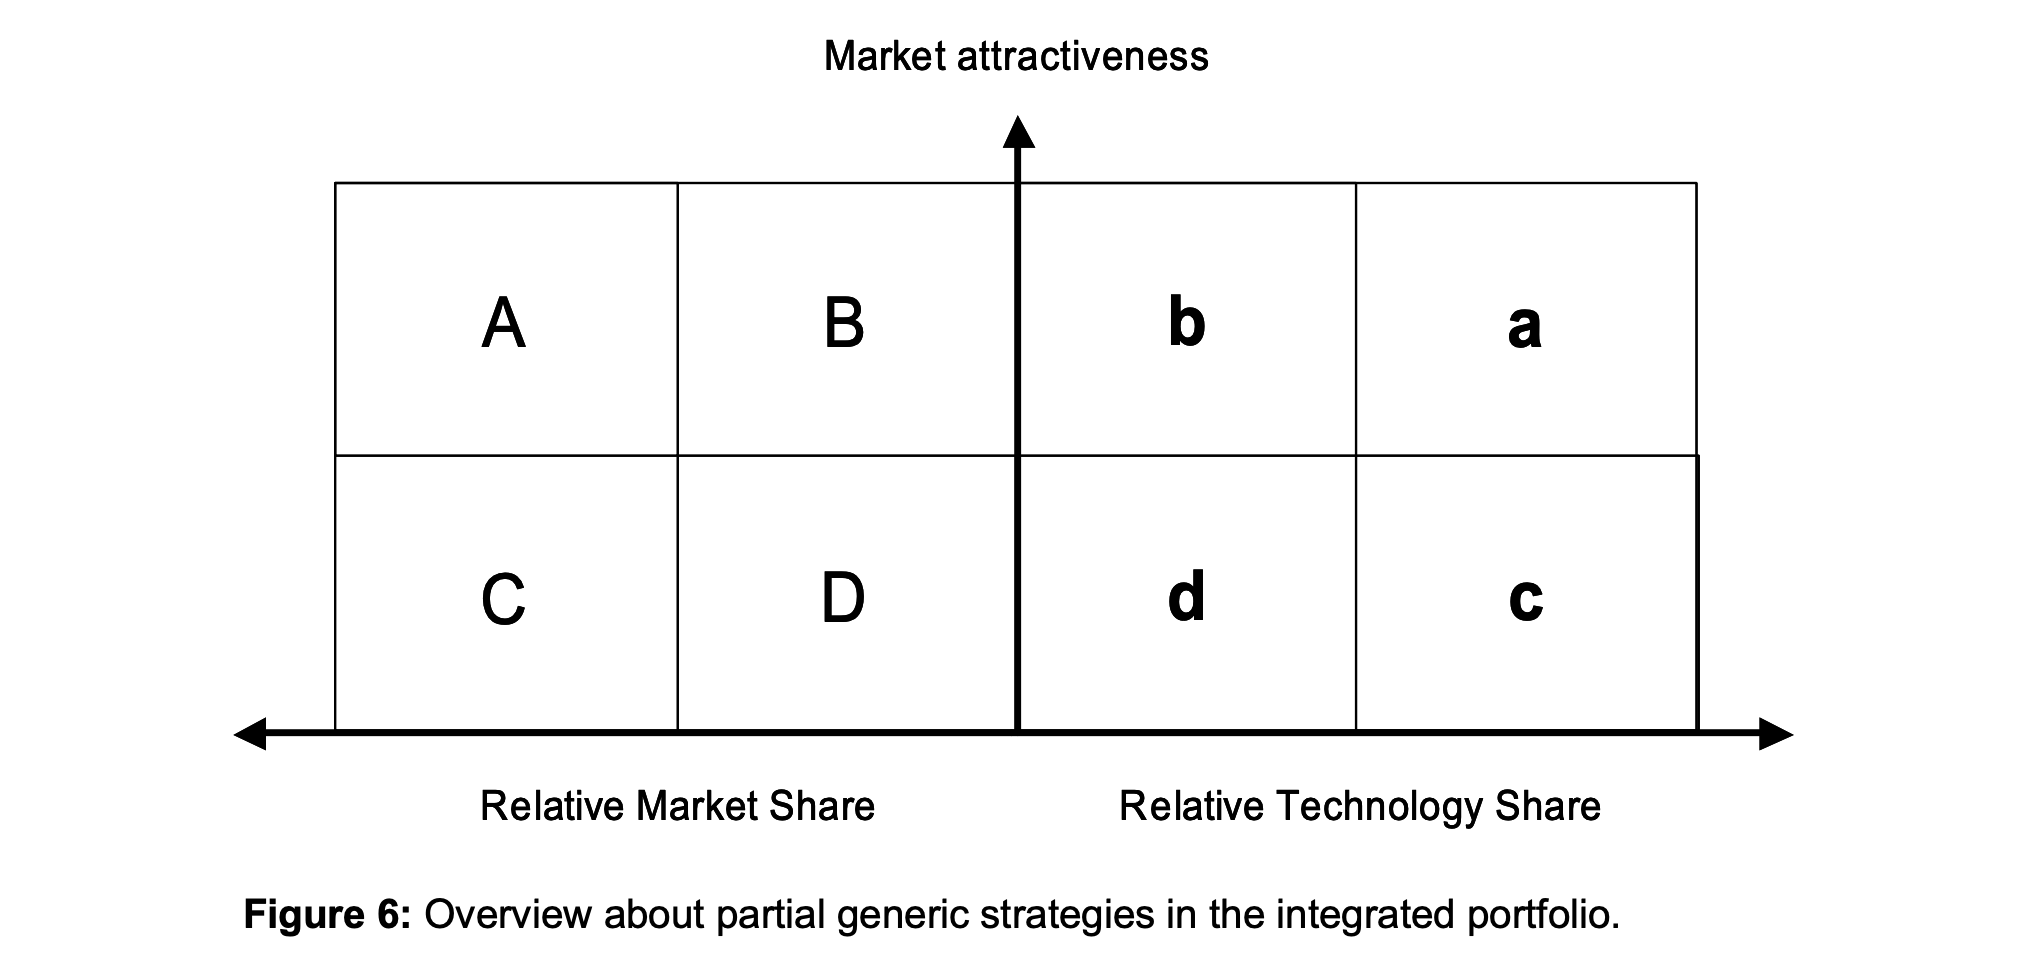
dimensions, especially the abscissa, have been shown to impact business performance, thus making the portfolio illustrations especially meaningful for decision makers in firms. The clear focus on market orientation in the integrated portfolio as expressed on the ordinate where the integration of both portfolios is achieved by using the market portfolio’s initial dimension “market attractiveness”. It is believed that a technology’s attractiveness has to finally show on the market and that R&D strategies ought to be consequently aligned with market requirements (see introduction). In cases where market data is not yet available for new and future products, one should rely on accurate market forecasts derived from market research or other sources. Figure 6 summarises the strategic implications which can be derived from the integrated portfolio.
If both technology and products are placed in the same field of the market and technology portfolios represented by the combinations Aa, Bb, Cc and Dd in figure 6, the generic strategies from the separate portfolios can simply be added up and remain valid. The main advantage of our portfolio concept is the detection of disparate positionings. In the case example, we elaborated on the combinations Ab, Ba, Cd and Dc. In these cases, different generic strategies have to be applied and those from the separate portfolios might become invalid as demonstrated by our example. Several hypotheses can explain the differences and we tried to find some evidence in expert discussions. For a disparate positioning in the upper half of the portfolio, i.e. a high growth environment, a likely explanation for a strong technological position, but weak market position would be an insufficient satisfaction of market needs. In this case, R&D expenditure should be cut back as it cannot be earned back in the future. In contrast, it could also be possible that the weak market position is due to strong competition in the product market. This would call for larger investments in marketing, R&D investments simultaneously held constant or scaled up. In a low growth environment, our hypothesis explaining a differing position would be a misappropriation of R&D investments. As market “cash cows” usually require massive economies of scale to be profitable, aggressively building market share would be a loss-making strategy. The sustainability of a market “cash cow” could also be threatened by a weak technological position. However, this need not be the case: if there are high barriers to entry due to economies of scale, the company does not need to protect its competitive position by property rights any more to prevent new firms from entering the market. We provided first evidence for possible strategic actions, which might be applied in these situations. However, it has to be stressed that these always need to be checked for appropriateness in the specific situation under evaluation.
Another strength of the portfolio method is the visualisation of complex decision problems. It lays the ground for an intensive discussion of portfolio positions, their root causes and their implications. The case example clearly shows that the integrated portfolio establishes a framework for joint strategy discussions between technical and non-technical functions like R&D, Marketing and the Patent Department.
We believe that the main benefit of portfolio techniques in strategic planning is the stimulation of cross-functional reviews of R&D and market strategy: as explained earlier in this chapter, there are hardly any combined generic strategies for disparate positionings which can be applied across industries and in different contexts. This opinion was confirmed by managers from the company, which found the portfolio very useful as a tool supporting strategic decision making.
A further important benefit of the integrated concept is that further knowledge is created during the conceptualisation and implementation phases. The systematic condensation of patent data and the simultaneous visualisation of technology and products create a significant amount of knowledge. The analyses create a significant amount of important knowledge which separate portfolio analyses cannot provide.
The limitations of this work can first be attributed to the case study approach, which is in a first step justified when new concepts are developed and preliminarily tested. A second limitation results from the data needed for the patent portfolio: if a company does not patent innovations, the method cannot be applied. However, patenting product innovations is a dominant strategy in many industries [37,47,48]. Thus, we do not believe that this severely limits the applicability of our approach in most cases. Finally, the proposed portfolio concept does not capture future technological developments which have not led to any patent applications yet. Here, traditional forecasting techniques, e.g. Delphi studies or scenario analysis, can be used which, however, have their own shortcomings [49,50].