Are behavioral pricing tactics also present in the B2B context? Evidence from a complex chemical B2B product
Abstract
Applying behavioral pricing tactics is common in business-to-consumer (B2C) markets and can result in a competitive advantage. One aspect of behavioral pricing is the use of price ending effects. While a lot of prior research focused on B2C markets, little research has been done to provide insights on price ending effects in business-to-business (B2B) markets. This study adresses this research gap by investigating price endings using the example of a highly complex chemical B2B product. The results reveal a high use of dominant price endings, indirectly indicating positive price threshold effects for this B2B product. The identified dominant price endings are similar to those observed in B2C studies and are thus strongly suggesting that current B2C price ending theories may also be applicable to B2B markets.
1 Introduction
The behavioral pricing research adds psychological and behavioral aspects to pricing research by applying theories from social cognition and behavioral decision research (Somervuori, 2012). Albeit some reviews on behavioral pricing have been conducted (e.g. Monroe, 1973; Winer, 1988), there is still no clear, uniform conceptualization (Somervuori, 2012). Behavioral pricing can be defined as follows: “Behavioral pricing constitutes an expansive subset of pricing research wherein prices and pricing are examined with respect to their human elements – that is, with respect to how humans attend to, perceive, process, and evaluate price information, as well as how they go about determining the price at which a particular item should be sold or purchased” (Miyazaki, 2003, p. 471). In order to influence the demand positively, behavioral aspects in pricing tactics are commonly used in B2C markets (Hinterhuber and Liozu, 2014). One of these effects is the compromise effect, where customers tend to avoid extreme options and instead choose intermediate options (Simonson, 1989). Therefore, pricing managers can increase the likelihood that the customer buys the premium product by adding a super-premium product to the portfolio (Hinterhuber and Liozu, 2014). Another important aspect of behavioral pricing research are price threshold and price ending effects which have so far almost exclusively been detected in the B2C context (Hinterhuber, 2015; Monroe et al., 2015). Companies active in B2C markets already use specific price endings in pricing tactics in order to affect customers’ behavior. The question is whether those price ending effects are also transferable to the B2B context (Hinterhuber and Liozu, 2014; Monroe et al., 2015; Wilson, 2000). If so, findings concerning B2C price endings might open up new opportunities for B2B companies with regard to influencing their customers’ decision-making. To provide an answer concerning the transferability, this exploratory study is thus investigating the price endings used within the B2B market on the basis of the example of a highly complex chemical product. In this study, the focus lies on identifying the frequency of occurrence of certain price endings and deducing whether or not behavioral pricing tactics are also present in the B2B context. After this introduction, the literature on price thresholds and price endings is summarized and hypotheses concerning price endings in B2B markets are deduced. In the subsequent sections, the underlying data and method of this exploratory study are described and the results are presented and discussed. This paper concludes with the findings and an outlook on further research.
2 Literature review
The following section provides an overview of the current state of price threshold and price ending research. Relevant price ending theories and empirical evidence are summarized before deducing the hypotheses for pricing tactics in B2B contexts.
2.1 Price thresholds and price endings in B2C markets
The concept of price thresholds addresses the sudden change in the customer’s price evaluation at a specific price point, whereby a distinction is made between absolute and differential price thresholds (Monroe, 1973). Absolute price thresholds are price points where customers stop purchasing due to the fact that some customers will either find the product/service too expensive (upper absolute price threshold) or too cheap so that they become suspicious of its quality (lower absolute price threshold) (Bruno et al., 2012; Monroe et al., 2015). The upper and lower absolute price threshold border the range of prices where a customer considers purchasing a product/service. This is referred to as acceptable price range (Monroe, 1971). In contrast, differential price thresholds are sudden changes in the customer’s price evaluation within the acceptable price range. Those abrupt changes in the perceived relative expensiveness of the offering occur with increasing prices (Monroe, 1973). However, the perceived price difference does not necessarily lead to a shift in the buying behavior.For instance, George et al. (1996) showed that a price change of more than 8-10% is required in order to significantly influence the purchasing behavior in the case of household products of varying brands. The existence of price thresholds has been accepted, in particular with regard to odd and round prices, which differ in their rightmost digit. Round prices are often defined as 0- or 5-ending prices (e.g. $130 or $145). In contrast, odd prices include one of the other eight possible digits at the rightmost position, whereby the price threshold research has so far focused on the digit 9 (Janiszewski and Lichtenstein, 1999; Kalwani et al., 1990; Schindler and Kirby, 1997). The existing empirical research shows that 0-, 5-, and 9-ending prices are more regularly used compared to other price endings in the B2C context. Table 1 provides an overview of the shares of specific price endings identified by selected studies. Those studies reveal that the digit 9 is the most frequently applied price ending in the B2C context, but the magnitude of relative frequency varies across product categories. In addition, there is a tendency of using 9-ending prices more often for low-priced or low-quality products, while 0- and 5-ending prices are either used for high-priced or lowpriced products (Kreul, 1982; Lee et al., 2009; Naipaul and Parsa, 2001; Stiving, 2000). For example, in the restaurant industry, price endings on the digit 5 are used for high-quality food whereas 9-ending prices are characteristic for low-quality food (Naipaul and Parsa, 2001). Lee et al. (2009) found similar results for products in internet-based selling. They showed that internet retailers use 9ȼ price endings for lowpriced products (prices < $100) and 0ȼ and 5ȼ price endings for prices over $100.
2.2 Price ending theories
A number of theories has been proposed to explain the frequent use of 0-, 5-, and 9-price endings. Relevant theories also applicable to the B2B context are the cognitive accessibility theory (Schindler and Kirby, 1997), affective effect theory (Nguyen et al., 2007), image effect theory (Stiving and Winer, 1997), perceived gain effect theory (Schindler and Kirby, 1997), rational inattention theory (Levy et al., 2007) and underestimation theory (Schindler and Kirby, 1997). The cognitive accessibility theory is based on the observation that in different numerical estimation tasks, people show a strong tendency towards 0- and 5-ending numbers (Hultsman et al., 1989; Tarrant and Manfredo, 1993). In pricing context, Schindler and Wiman (1989) investigated this phenomenon and found that customers tend to produce 0- and 5-ending prices when recalling prices. Thus, the digits 0 and 5 are more accessible in memory (Fazio et al., 1982; Higgins et al., 1977), which is also valid within the pricing context as 0- and 5-ending prices seem to be more cognitive accessible than the other eight possibilities (Estelami, 1999; Guido and Peluso, 2004, Schindler and Kirby, 1997). In addition, results suggest that 0-ending numbers have a higher cognitive accessibility than 5-ending numbers (Schindler and Kirby, 1997). It seems as if this tendency to favor round numbers is very deeply ingrained in human cognitive processing (Schindler and Kirby, 1997; Yoshida and Kuriyama, 1986). Thus, the frequent use of this kind of prices is explained as they are easier perceived, remembered and compared (Estelmani, 1999; Schindler and Kirby, 1997). Affective effect theory states that odd prices (e.g. 9-ending prices) can be perceived as a manipulative marketing tool by customers, leading to a negative affective state (Schindler, 2006). In contrast, round prices can elicit a positive affective state if customers perceive them as honest and unchanged (Suri et al., 2002). Thus, in order to avoid negative affective states coupled to the use of odd prices and rather stimulate positive affective states, this theory favors the use of round prices.
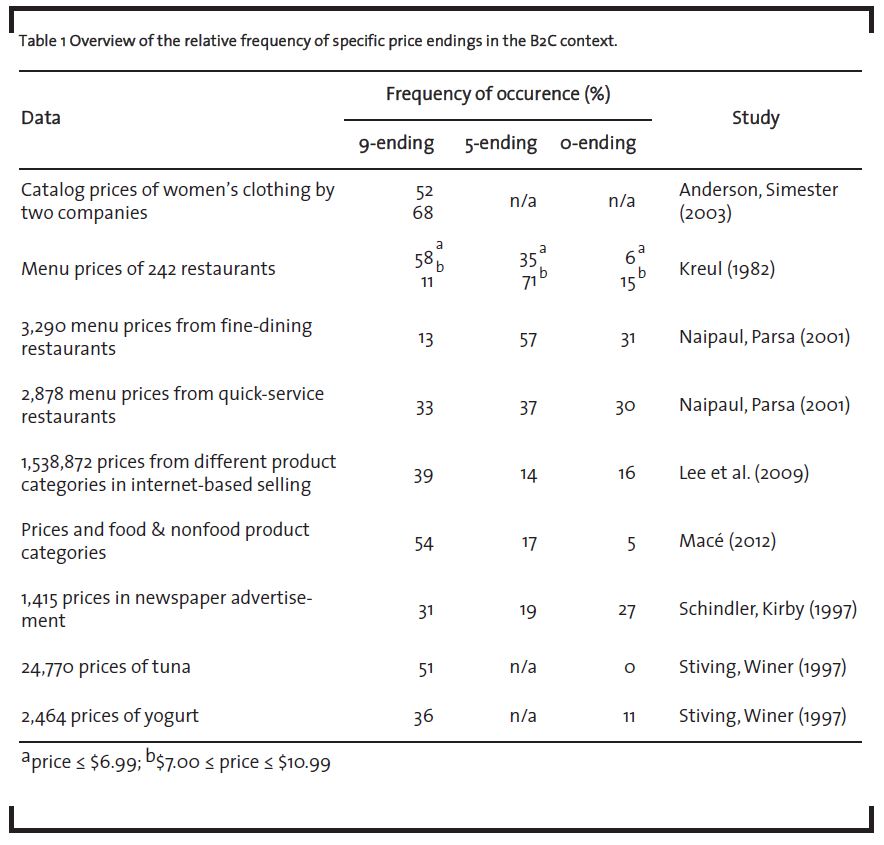
Image effect theory distinguishes between two effects to explain the frequent use of specific price endings: the price image effect and the quality image effect. The price image effect argues that 9- and 99-ending prices indicate low prices leading to a low-price image and therefore potentially to higher sales. In contrast, the quality image effect argues that odd prices (e.g. 9- and 99-ending prices) indicate low quality, while round prices (e.g. 0-ending prices) are a signal for high qualitative products which might enhance its desirability. Thus, by choosing price endings, companies can either produce a low-price or a high-quality image (Stiving and Winer, 1997).
The perceived gain effect is based on the higher cognitive accessibility of round numbers. The digits 0 and 5 are reference points in price evaluations for customers. According to the prospect theory (Kahneman and Tversky, 1979), 9-ending prices can be framed as a round price with a small gain (Schindler and Kirby, 1997). Here, the perception of gains is disproportionate to the gain’s small size, which is thus enhancing the evaluation of prices ending with a 9 (Schindler and Kirby, 1997; Thaler, 1985). This enhancement is termed perceived gain effect and could be an explanation of why companies favor 9-ending prices (Schindler and Kirby, 1997).
The rational inattention theory suggests that customers may be rational inattentive to the rightmost digit(s) of prices due to being constrained by time, limited resources or information processing capacities (Levy et al., 2007). Thus, companies favor setting the last digit as high as possible at 9ȼ or $9 (Lee et al., 2009).
Considering the findings that customers tend to process prices from left to right and favor round prices (Poltrock and Schwartz, 1984), the underestimation effect theory states that customers may truncate an advertised price into a round-number mental presentation. For example, a price such as $799 would be encoded as $790 if just the first two digits are processed (Schindler and Kirby, 1997). This leads to an overrepresentation of 9-ending prices.
In sum, all presented theories indicate that customers tend to process prices not as a whole and that the specific price endings may affect the customer’s buying behavior (Lee et al., 2009).
2.3 Empirical evidence
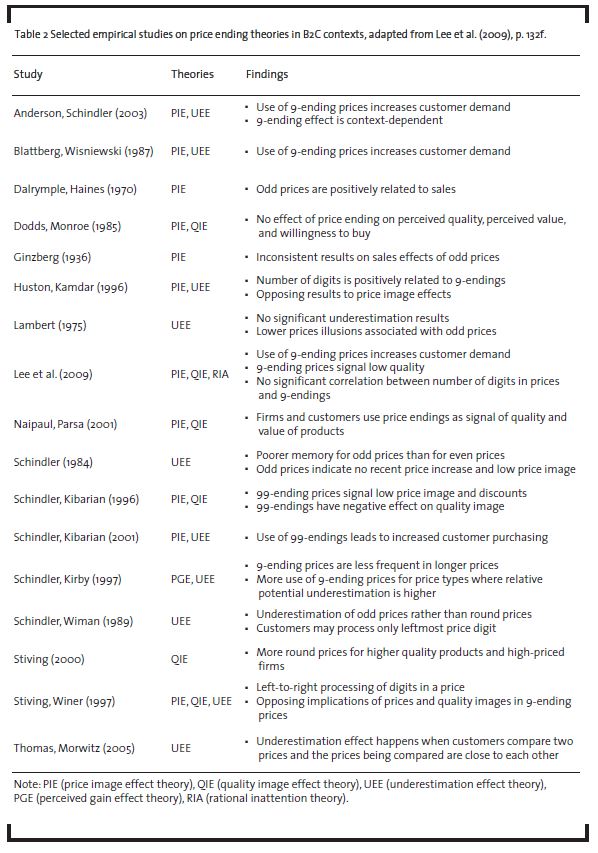
A lot of studies have been conducted to support each theory and to explain the dominance of specific price endings, especially 9-endings. Table 2 summarizes selected empirical studies on price endings in the B2C context. Interestingly, the studies show inconclusive results, e.g. concerning the quality image effect (Dodds and Monroe, 1970; Naipaul and Parsa, 2001; Stiving, 2000). Furthermore, while some studies provide evidence that 9-ending prices increase sales (Anderson and Simester, 2003; Lee et al., 2009; Schindler and Kibarian, 1996), other studies do not detect any effects (Dodds and Monroe, 1985; Ginzberg, 1936).
2.4 Price endings in B2B markets
Although B2B markets include challenges that differ from those in B2C markets, e.g. price negotiations (Stanton, 1981) and purchases by a buying center (Bonoma, 1982), many behavioral characteristics are present across diverse contexts. This leads to the assumption that there are “fundamental similarities within human choice-making” (Wilson, 2000, p. 781) in B2B and B2C markets and that many behavioral pricing theories in B2C markets could be applicable to B2B markets as well (Monroe et al., 2015). Up to date, only Larson et al. (2014) investigated the impact of price endings on the demand in a B2B context. The authors found that 9-ending and 0-ending prices strongly affect the demand for telecommunication services. Their findings also indicate 0-ending prices to have a higher impact on the demand than 9-ending prices. Based on their findings, they conclude that positive price thresholds also exist in B2B markets. As there are no further studies analyzing the impact of price endings on B2B products, this study addresses this research gap by investigating the frequency of price endings for a highly complex chemical B2B product in order to answer the question whether or not B2C price ending theories may also be applicable to B2B markets due to similarities within human behavior (Monroe et al., 2015; Wilson, 2000). Previous research has shown that price setters in B2C markets frequently use 0-, 5-, and 9-endings, which is in parts consistent with the results of Larson et al. (2014). Therefore, the following hypotheses are proposed for price endings in B2B markets:
Hypothesis 1a: Dominant price endings are present in B2B markets.
Hypothesis 1b: The price endings are not evenly distributed.
Hypothesis 2: The most frequently used price endings in B2B markets are 0-, 5-, and 9-endings.
3 Method and data
This study uses an exploratory approach. The frequency of occurrence of price endings in a B2B market is investigated by means of complex chemical products. These B2B products are so-called “beads”, i.e. spherical, non-porous, monodisperse nano- and microparticles, which are mainly used in biomedical applications (Bi et al., 2009; Cha et al., 2009; Dunbar, 2006; Liu et al., 2009; Safarik and Safarikova, 2009; Seydack, 2005; Ugelstad et al., 1993, Vignali, 2000). Due to their variety in functionality and the usage for highly specialized applications, small niche markets exist. In order to provide consistency, this analysis only takes those beads into consideration that consist of commonly used bulk materials. Such bulk materials are polymers (e.g. polymethyl methacrylate or polystyrene) and silica (Bake and Walt, 2008; Chen et al., 2006; Kang et al., 2006; Yalçın et al., 2006). Other (inorganic) materials are not considered.
Price negotiations are a common practice in B2B markets (Stanton, 1981). Due to different reference prices, price negotiations can lead to variations in the agreed price (Moosmeyer et al., 2012). To avoid biases, only internet-based catalog prices are sampled for this analysis.
Previous studies mainly focused on price endings in cents but research indicates that price ending effects occur as well for endings in dollar (Larson et al., 2014; Lee et al., 2009; Levy et al., 2007). Thus, this study analyzes price endings in dollars and cents.
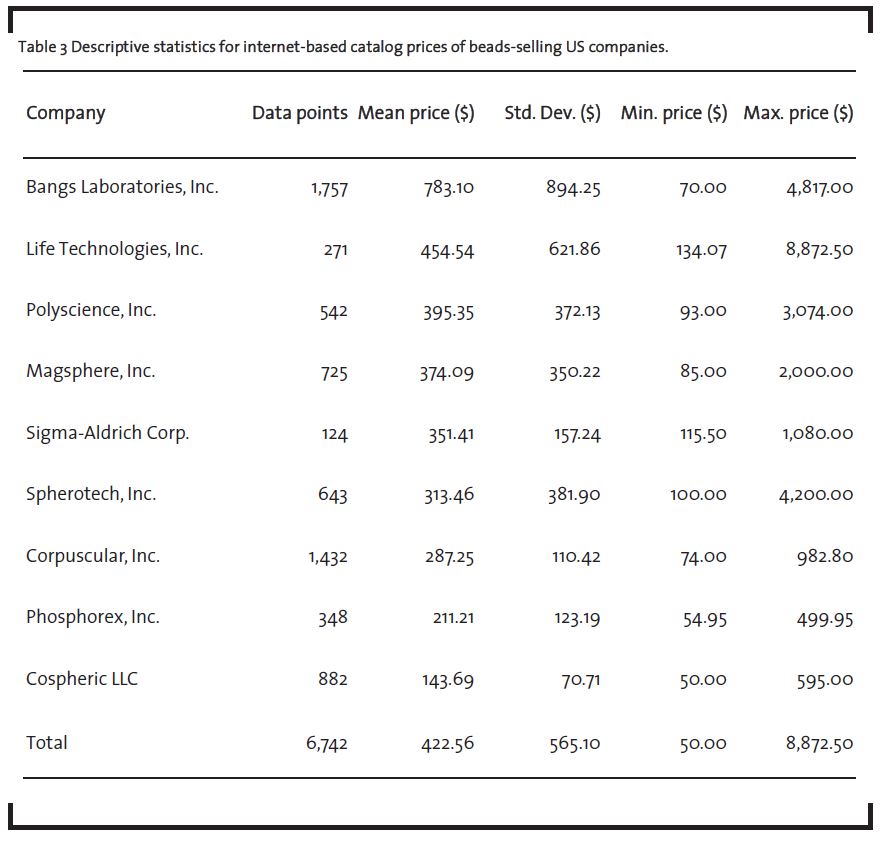
A total of 6,724 prices were sampled from 9 US companies – a representative sample in view of the fact that the US bead market only consists of a few competing companies. The prices were exactly coded as listed in the internet catalog of each company. The advertised prices ranged from $50.00 to $8,872.501 and the mean value of the whole sample was $422.56. Table 3 provides an overview of the descriptive statistics of this data set.
4 Results and discussion
As shown in table 4, the rightmost digits of bead prices are not evenly distributed among the 10 possibilities (χ2(9) = 49,760; p < 0.001). As the “Total” row of table 4 shows, the ending 0ȼ is greatly overrepresented with 92%. Furthermore, 6 of 9 companies are solely using 0ȼ endings for bead prices. The other 9 possible price endings for the rightmost digit are underrepresented and account together for only 10%. Although the 5ȼ ending occurs solely for 5% of the prices, it is the second highest frequency of occurrence within this sample. An explanation for this result could be the 100% use of this price ending by the company Phosphorex. One company uses a 9ȼ ending price but to a negligible percentage which becomes not evident within the table due to rounding. This result deviates from the findings of Lee et al. (2009) although the price level is as well between $100 and $1,000 for all companies. For products priced above $100, they find that 28% of the prices end with 0ȼ, 21% with 5ȼ, and 25% with 9ȼ, respectively. In their study, the use of the price ending 0ȼ increases for products above $1,000. Thus, the price ending strategies of companies within the present study seem to be different. One possible explanation for this observation might be the already described strong tendency to use round endings, particularly 0ȼ, for high prices, potentially in order to signal higher quality (quality image effect) (Stiving, 2000). In addition, Stiving (2000) found that this relationship is even stronger when the customer does not know the true level of quality prior to the purchase, which is the case for beads due to their high technological complexity.
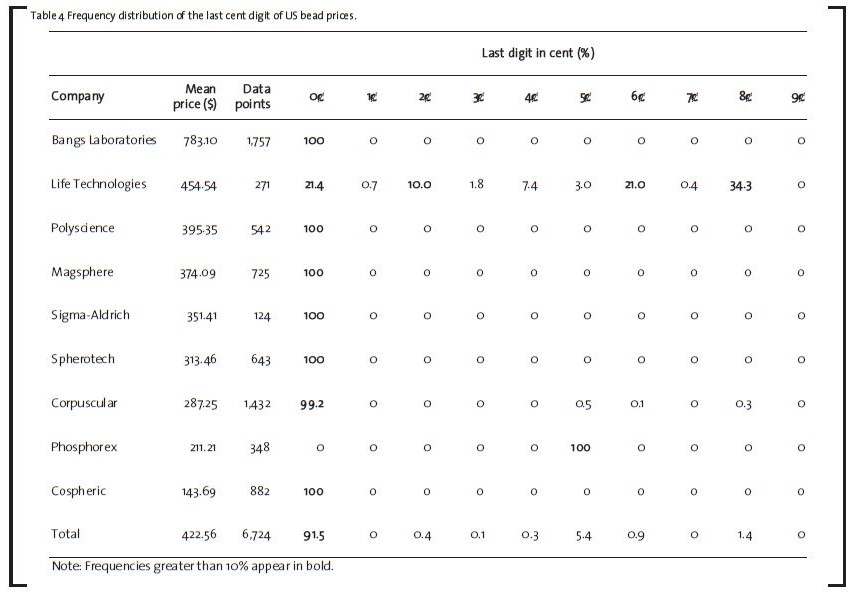
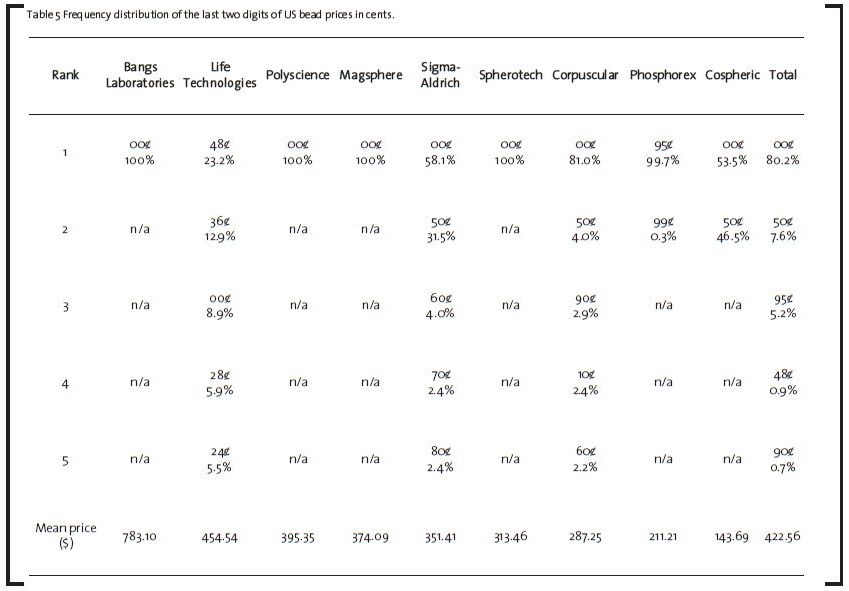
Table 5 shows the frequency distribution of the last two digits in cents within the sample. As expected, also the last two cent digits of bead prices are not equally distributed among all 100 possibilities (χ2(99) = 432,015; p < 0.001). As illustrated in the “Total” row of table 5, the 00ȼ, 50ȼ, and 95ȼ price endings are overrepresented, reflected by 80% for 00ȼ, 8% for 50ȼ, and 5% for 95ȼ, respectively. The other price endings are accounting for 7%. Companies examined in this study show a strong tendency to use especially 00ȼ ending prices. In contrast, only the company Phosphorex prices all beads with 95ȼ endings. The company Life Technologies follows an entirely different pricing strategy, 23% of the bead prices end with an unusual price ending of 48ȼ and solely 9% show a 00ȼ ending.
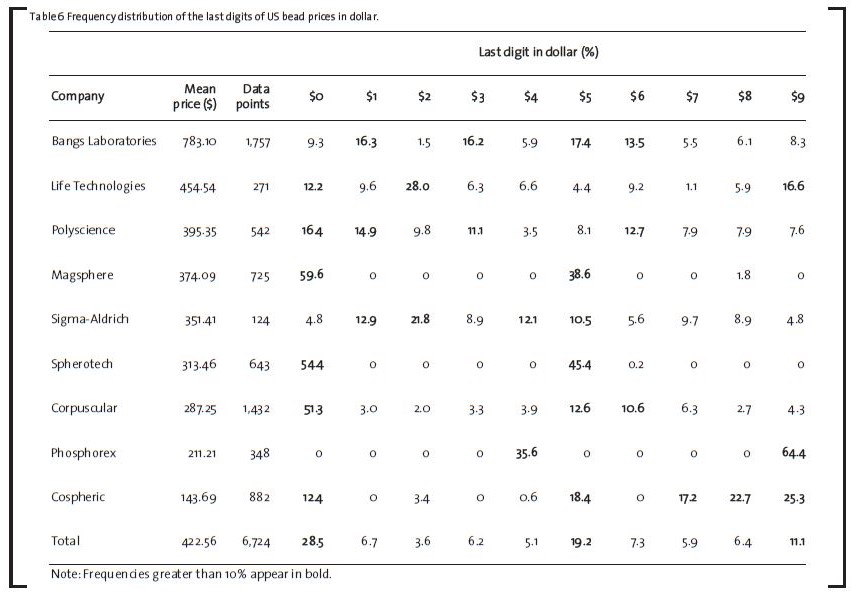
The frequency distribution of price endings in dollar is reported in table 6, clearly indicating that the last digits of bead prices in dollar are unevenly distributed among the 10 possibilities (χ2(9) = 1,752; p < 0.001). The $0 and $5 price endings are overrepresented (29% and 19%, respectively). The companies Magsphere, Spherotech, and Corpuscular use the $0 ending for over 50% of their prices, whereby Magsphere and Spherotech almost solely use $0 and $5 price endings. This overrepresentation of $0 and $5 price endings could be explained by the high cognitive accessibility of those two digits. By using the 0- and 5-ending prices, price setters can simplify the communication with their customers, which might in turn increase the opportunity that customers perceive and recall the advertised prices. In addition, one reason for the lower frequency of $5 price endings in comparison to $0 price endings might be that 5-ending prices have a lower cognitive accessibility than 0-endings prices (Schindler and Kirby, 1997). Furthermore, the $9 price ending is also comparably often used, accounting for 11%. Contrary to the other companies, Phosphorex and Cospheric apply the $9 ending most frequent (64% and 25%, respectively). Furthermore, Phosphorex solely uses $9 and $4 endings and the 95ȼ ending for the last two digits of the bead prices, leading to a focus on prices which are below a round denomination (e.g. $149.95 or $199.95) in their pricing strategy (Huston and Kamdar, 1996). This prevalence of $0, $5, and $9 price endings is partially consistent with the findings of Larson et al. (2014). They found that 0- and 9-ending prices increase the demand within a B2B context, but $5 ending prices had no significant positive impact in their study.
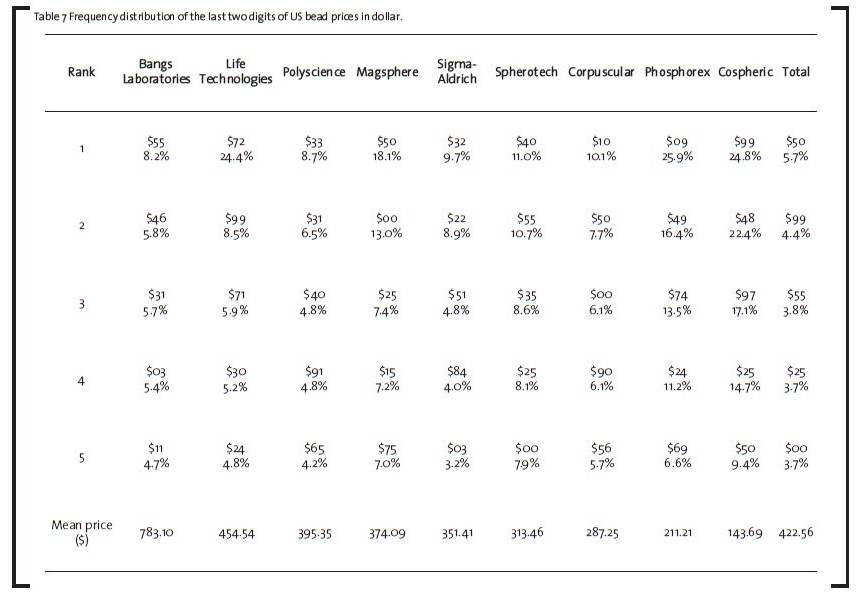
The last frequency distribution considered concerns the last two dollar digits (table 7). Again, the last two digits of the bead prices are not equally distributed among the 100 possibilities (χ2(99) = 3,586; p < 0.001). The most frequent used price ending is $50, accounting for 5.5%. Rank 2 is occupied by the $99 ending accounting for 4.4%, while the $00 ending ranks fifth (3.7%). The company Cospheric uses the $9 ending for 25% of their prices. For the last two digits in dollar terms, almost 25% of their prices end with $99, which leads to the conclusion that nearly all $9 prices endings are simultaneously $99 price endings. Therefore, this company also has a strong tendency to use prices which are below a round denomination (e.g. $99.00) (Huston and Kamdar, 1996).
In sum, the results show that there are dominant price endings for US bead prices and that the analyzed price endings are not evenly distributed. Thus, there is strong support for hypothesis 1a and 1b. While the $0, $5, and $9 price endings were shown to be predominant for the last digit in dollar, this is only true for the 0ȼ ending with regard to the last cent digit. Therefore, hypothesis 2 is only partially supported. This strong tendency to use 0-ending prices and especially the 00ȼ price ending for a B2B product shows that most of the B2B price setters in this study strongly believe in the (positive) effects of round price endings (as suggested by the quality image effect theory and cognitive accessibility theory). Exceptions in this study are the companies Phosphorex and Cospheric. They focus on prices which are below a round denomination (e.g. $149.95, $99.00) and are thus rather trusting in the perceived gain effect, underestimation effect, price image effect or the rational inattention effect. All of those effects provide a possible explanation for the frequent use of the price ending 9.
Nevertheless, there are dominant price endings indicating the existence of price thresholds in B2B markets. Especially for $0, $5, and $9 ending prices, positive price threshold effects are suggested, but these findings are only partly consistent with the results of Larson et al. (2014) who found positive threshold effects for $0 and $9 ending prices within the B2B context. Because of the appearance of similar dominant price endings in B2C and B2B contexts, this study found strong support that B2C price ending theories may also be applicable to the B2B context. The observations made are strengthened as similar dominant price endings emerge when conducting the same analysis for the German market.
5 Conclusion and Outlook
This study depicted the landscape of price endings by analyzing the frequency of their occurrence on cent and dollar level for a highly complex chemical product. The results show that price setters particularly use $0, $5, $9 and 00ȼ endings. Based on the assumption that price setters favor prices and price endings contributing to achieving their demand goals, this indicates positive price thresholds effects for these price endings. These price endings are similar to the dominant endings found in previous B2C studies. This finding is thus supporting the assumption that B2C price ending theories may also be applicable in the B2B context. The results particularly indicate the transferability of the cognitive accessibility theory to the B2B context. At the same time, it can be assumed that the quality image effect might be an explanation for the frequent use of the price ending 0. In addition, two companies frequently used 9-ending prices which rather support the existence of the perceived gain effect, underestimation effect, price image effect or the rational inattention effect. Thus, further research is required. It should be noted that there are some limitations to this study. The analysis assumes that price setter favor prices that influence demand goals positively, so that the existence of positive price thresholds effects was only indirectly investigated. However, most dominant price endings are consistent with the results of Larson et al. (2014) and previous B2C studies. Furthermore, only catalog prices were investigated. Because price negotiations are common practice in B2B context (Stanton, 1981), it is unclear how far the sampled prices are true selling prices. Since this study focused on prices above $100, further research should also include cheaper B2B products as different price levels have found to lead to different frequencies in using price endings in B2C studies (Lee et al., 2009). In managerial practice, the primary focus of B2B pricing is and will be set on the economic analysis. However, behavioral and psychological aspects should not be neglected in pricing decisions due to violations of rational choice-making principles by B2B customers (Hinterhuber, 2015). Based on this study and results of Larson et al. (2014), positive price thresholds effects may exist in B2B context. Then, specific price endings are able to increase the demand and should thus be considered in B2B pricing tactics.
References
Anderson, E. T., Simester, D. I. (2003): Effects of $9 price endings on retail sales: Evidence from field experiments, Quantitative Marketing and Economics, 1 (1), pp. 93-110.
Bake, K. D., Walt, D. R. (2008): Multiplexed spectroscopic detections, Annual Review of Analytical Chemistry, 1, pp. 515-547.
Bi, S., Zhou, H., Zhang, S. (2009): Bio-bar-code functionalized magnetic nanoparticle label for ultrasensitive flow injection chemiluminescence detection of DNA hybridization, Chemical Communications, pp. 5567-5569.
Blattberg, R. C., Wisniewski, K. J. (1987): How retail price promotions work: Empirical results, Working Paper, Center for Research in Marketing, University of Chicago, Chicago, USA.
Bonoma, T. V. (1982): Major Sales – Who Really Does the Buying, Harvard Business Review, 60 (3), pp. 111-119.
Bruno, H. A., Che, H., Dutta, S. (2012): Role of reference price on price and quantity: insights from business-to-business markets, Journal of Marketing Research, 49 (5), pp. 640-654.
Cha, B. H., Lee, S. M., Park, J. C., Hwang, K. S., Kim, S. K., Lee, Y. S., Ju, B., Kim, T. S. (2009): Detection of Hepatitis B Virus (HBV) DNA at femtomolar concentrations using a silica nanoparticle-enhanced microcantilever sensor, Biosensors and Bioelectronics, 25 (1), pp. 130-135.
Chen, Z., Peng, K., Mi, Y. (2007): Preparation and properties of magnetic polystyrene microspheres, Journal of Applied Polymer Science, 103 (6), pp. 3660-3666.
Dalrymple, D. J., Haines Jr, G. H. (1970): A Study of the Predictive Ability of Market Period Demand-Supply Relations for a Firm Selling Fashion Products, Applied Economics, 1 (4), pp. 277-285.
Dodds, W. B., Monroe, K. B. (1985): The effect of brand and price information on subjective product evaluations, Advances in Consumer Research, 12 (1), pp. 85-90.
Dunbar, S. A. (2006): Applications of Luminex® xMAP™ technology for rapid, high-throughput multiplexed nucleic acid detection, Clinica Chimica Acta, 363 (1), pp. 71-82.
Estelami, H. (1999): The computational effect of price endings in multi-dimensional price advertising, Journal of Product & Brand Management, 8 (3), pp. 244-256.
Fazio, R. H., Chen, J. M., McDonel, E. C., Sherman, S. J. (1982): Attitude accessibility, attitude-behavior consistency, and the strength of the object-evaluation association, Journal of Experimental Social Psychology, 18 (4), pp. 339-357.
George, J., Mercer, A., Wilson, H. (1996): Variations in price elasticities, European Journal of Operational Research, 88, pp. 13–22.
Ginzberg, E. (1936): Customary Prices, American Economic Review, 26, p. 296.
Guido, G., Peluso, A. (2004): Consumers’ perception of odd-ending prices with the introduction of the Euro, Journal of Product & Brand Management, 13 (3), pp. 200-210.
Higgins, E. T., Rholes, W. S., Jones, C. R. (1977): Category accessibility and impression formation, Journal of Experimental Social Psychology, 13 (2), pp. 141-154.
Hinterhuber, A. (2015): Violations of rational choice principles in pricing decisions, Industrial Marketing Management, 47, pp. 65-74.
Hinterhuber, A., Liozu, S. M. (2014): Is innovation in pricing your next source of competitive advantage?, Business Horizons, 57 (3), pp. 413-423.
Hultsman, W. Z., Hultsman, J. T., Black, D. R. (1989): “Response peaks” as a component of measurement error: Assessment implications for self-reported data in leisure research, Journal of Leisure Research, 21 (4), pp. 310-315.
Huston, J., Kamdar, N. (1996): $9.99: Can” Just-Below” Pricing Be Reconciled with Rationality?, Eastern Economic Journal, 22 (2), pp. 137-145.
Janiszewski, C., Lichtenstein, D. R. (1999): A range theory account of price perception, Journal of Consumer Research, 25 (4), pp. 353-368.
Kahneman, D., Tversky, A. (1979): Prospect theory: An analysis of decision under risk, Econometrica: Journal of the Econometric Society, 47 (2), pp. 263-291.
Kalwani, M. U., Yim, C. K., Rinne, H. J., Sugita, Y. (1990): A price expectations model of customer brand choice, Journal of Marketing Research, 27 (3), pp. 251-262.
Kang, K., Kan, C., Yeung, A., Liu, D. (2006): The immobilization of trypsin on soap-free P (MMA-EAAA) latex particles, Materials Science and Engineering: C, 26 (4), pp. 664-669.
Kreul, L. M. (1982): Magic numbers: psychological aspects of menu pricing, Cornell Hotel and Restaurant Administration Quarterly, 23 (2), pp. 70-75.
Lambert, Z. V. (1975): Perceived prices as related to odd and even price endings, Journal of Retailing, 51 (3), pp. 13-22.
Larson, A. C., Reicher, R. L., Johnsen, D. W. (2014): Threshold effects in pricing of high-involvement services, Journal of Product & Brand Management, 23 (2), pp. 121-130.
Lee, D., Kauffman, R. J., Bergen, M. E. (2009): Image effects and rational inattention in Internet-based selling, International Journal of Electronic Commerce, 13 (4), pp. 127-166.
Levy, D., Lee, D., Chen, H., Kauffman, R. J., Bergen, M. (2011): Price points and price rigidity, Review of Economics and Statistics, 93 (4), pp. 1417-1431.
Liu, C., Stakenborg, T., Peeters, S., Lagae, L. (2009): Cell manipulation with magnetic particles toward microfluidic cytometry, Journal of Applied Physics, 105 (10), pp. 102014-1–102014-11.
Macé, S. (2012): The impact and determinants of nine-ending pricing in grocery retailing, Journal of Retailing, 88 (1), pp. 115-130.
Miyazaki, A. D. (2003): Guest editorial: The psychology of pricing on the Internet, Psychology & Marketing, 20 (6), pp. 471-476.
Monroe, K.B. (1971): The information content of prices: A preliminary model for estimating buyer response, Management Science, 17, pp. B-519-B-532.
Monroe, K. B. (1973): Buyers’ subjective perceptions of price, Journal of Marketing Research, 10, pp. 70-80.
Monroe, K. B., Rikala, V. M., Somervuori, O. (2015): Examining the application of behavioral price research in business-to-business markets, Industrial Marketing Management, 47, pp. 17-25.
Moosmayer, D. C., Schuppar, B., Siems, F. U. (2012): Reference Prices as Determinants of Business-to-Business Price Negotiation Outcomes: An Empirical Perspective from the Chemical Industry, Journal of Supply Chain Management, 48 (1), pp. 92-106.
Naipaul, S., Parsa, H. G. (2001): Menu price endings that communicate value and quality, Cornell Hotel and Restaurant Administration Quarterly, 42 (1), pp. 26-37.
Nguyen, A., Heeler, R. M., Taran, Z. (2007): Highlow context cultures and price-ending practices, Journal of Product & Brand Management, 16 (3), pp. 206-214.
Poltrock, S. E., Schwartz, D. R. (1984): Comparative judgments of multidigit numbers, Journal of Experimental Psychology: Learning, Memory, and Cognition, 10 (1), pp. 32-45.
Safarik, I., Safarikova, M. (2009): Magnetic nanoand microparticles in biotechnology, Chemical Papers, 63 (5), pp. 497-505.
Schindler, R. M. (1984): Consumer recognition of increases in odd and even prices, Advances in Consumer Research, 11 (1), pp. 459-462.
Schindler, R. M. (2006): The 99 price ending as a signal of a low-price appeal, Journal of Retailing, 82 (1), pp. 71-77.
Schindler, R. M., Kibarian, T. M. (1996): Increased consumer sales response though use of 99-ending prices, Journal of Retailing, 72 (2), pp. 187-199.
Schindler, R. M., Kibarian, T. M. (2001): Image communicated by the use of 99 endings in advertised prices, Journal of Advertising, 30 (4), pp. 95-99.
Schindler, R. M., Kirby, P. N. (1997): Patterns of rightmost digits used in advertised prices: implications for nine-ending effects, Journal of Consumer Research, 24 (2), pp. 192-201.
Schindler, R. M., Wiman, A. R. (1989): Effects of odd pricing on price recall, Journal of Business Research, 19 (3), pp. 165-177.
Seydack, M. (2005): Nanoparticle labels in immunosensing using optical detection methods, Biosensors and Bioelectronics, 20(12), pp. 2454-2469.
Simonson, I. (1989): Choice based on reasons: The case of attraction and compromise effects, Journal of Consumer Research, 16 (2), pp. 158-174.
Somervuori, O. (2012): Essays on behavioral pricing, Dissertation, Department of Information and Service Economy, Aalto University, Helsinki, Finland.
Stanton, W. J. (1981): Fundamentals of marketing, 6th ed., McGraw-Hill, New York, USA.
Stiving, M. (2000): Price-endings when prices signal quality, Management Science, 46 (12), pp. 1617-1629.
Stiving, M., Winer, R. S. (1997): An empirical analysis of price endings with scanner data, Journal of Consumer Research, 24 (1), pp. 57-67.
Suri, R., Manchanda, R. V., Kohli, C. S. (2002): Comparing fixed price and discounted price strategies: the role of affect on evaluations, Journal of Product & Brand Management, 11 (3), pp. 160-173.
Tarrant, M. A., Manfredo, M. J. (1993): Digit preference, recall bias, and nonresponse bias in self reports of angling participation, Leisure Sciences, 15 (3), pp. 231-238.
Thaler, R. (1985): Mental accounting and consumer choice, Marketing Science, 4 (3), pp. 199-214.
Thomas, M., Morwitz, V. (2005): Penny wise and pound foolish: the left-digit effect in price cognition, Journal of Consumer Research, 32 (1), pp. 54-64.
Ugelstad, J., Stenstad, P., Kilaas, L., Prestvik, W. S., Herje, R., Berge, A., Hornes, E. (1993): Monodisperse magnetic polymer particles, Blood purification, 11 (6), pp. 349-369.
Vignali, D. A. (2000): Multiplexed particle-based flow cytometric assays, Journal of Immunological Methods, 243 (1), pp. 243-255.
Wilson, D. F. (2000): Why divide consumer and organizational buyer behaviour?, European Journal of Marketing, 34 (7), pp. 780-796.
Winer, R. S. (1988): Behavioral perspective on pricing: Buyers’ subjective perceptions of price revisited, Issues in Pricing: Theory and Research, pp. 35-57.
Yalçın, G., Elmas, B., Tuncel, M., Tuncel, A. (2006): A low, particle‐sized, nonporous support for enzyme immobilization: Uniform poly (glycidyl methacrylate) latex particles, Journal of Applied Polymer Science, 101 (2), pp. 818-824.
Yoshida, H., Kuriyama, K. (1986): The numbers 1 to 5 in the development of children’s number concepts, Journal of Experimental Child Psychology, 41 (2), pp. 251-266.