The relation of energy value chains, global GDP and CO2
1 Introduction
Nature and human beings – as part of nature – depend on a continuous flow of energy to stabilize a state far off any thermodynamic equilibrium. Evolution has addressed this energy demand over millions of years especially by photosynthesis in highly delocalized and dispersed natural systems. In addition, the development of mankind during the last 10,000+ years has also been the quest for new energy sources. Whilst the energy content of wood, wind and water was used wherever possible based on existing or newly developed technologies, societies had also exploited animal powered techniques and slavery more or less until the industrial revolution started in the 17th century. With the utilization of coal first and there- after oil and gas as well as nuclear power, energy became available in a much higher order of magnitude. Finally, today’s world has been built on the combination of sophisticated technologies leveraging as high as possible energy content in primary energy sources. Only recently, mankind has learned to tap into the most ubiquitous energy available on our planet: using sunlight directly for the generation of electrical power via photovoltaic cells and, more indirectly, wind to drive wind mills, which have already reached a MW scale per installation.
The consumption of fossil energy sources over time has reached1 a level of 11.7 Giga tons of oil equivalents (Gtoe) in 2018. This in turn has resulted in a significant depletion of the world’s resources, which nature had generated over hundreds of millions of years. And finally, the excessive burning of fossil fuels has contributed significantly to rising CO2 levels in our atmosphere, leading to the current situation, which can only be considered as highly unsustainable.
1 Energy units and conversion: 1 toe≅1,2 kNm3≅1,5 SKE≅12 MWh≅42 GJ; toe: ton of oil equivalent; Nm3: standard cubic meter; SKE: coal equivalent; MWh: megawatt hour; GJ: Giga Joule; Giga: billion
Many initiatives on international and national levels, foremost the United Nations Sustainable Development Goals (United Nations, 2015) and derived thereof the climate protection conferences including the Paris Agreement from December 2015 (United Nations, 2015b), tried to create a sense of urgency and to define and implement measures to limit green house gas emissions.
Fact is, that over the last 27 years since Rio 1992 none of the agreed measures have achieved the goal to limit emissions. On the contrary, emissions in absolute terms have increased ever since. Unfortunately, there are reasons for that pattern stemming from the global economic development in combination with our global monetary system. The relation and influencing factors are outlined below. Key words are energy value chains, energy consumption and GDP, monetary system, climate debate and finally perspectives.
2 Energy value chains and well being
In the chemical industry so-called value chains from crude oil to plastic materials, active ingredients or pharmaceuticals are familiar descriptions of material flow, which can also be the basis for designing a circular economy (Kopel and Utikal, 2019). However, circular economy cannot be expected to solve our resource problems alone. The reason for that is often the neglect of the energy part, which is needed to make material value chains and circular economies work.
Considering energy as an integral part of our life and the basis for our well-being, it becomes quite obvious that everything just depends on availability and distribution of energy (here called the energy value chain). On each step of the material value chain, energy in various forms is needed. Ore refinement to steel requires energy (fuel and electrical power) for the machinery park that is digging, extracting, transporting, purifying, processing and finally forming of steel plates. The same is true for aluminum production and for all other materials required in our world including agricultural products. In the chemical industry and along the chemical value chains additional energy input is needed to build the broad portfolio of chemical products often starting with crude oil as the major feedstock. Moving forward in the value chain towards the consumer products the same logic applies. Energy input is needed for transportation, heating of industrial buildings, running machinery based on electrical power and again logistics to serve the next customer level in the value chain. Finally, materials or products get either consumed in the industrial manufacturing processes itself or by the consumer. At the end of the useful lifetime of a product, energy is again needed for collecting, purifying, sorting, recycling (to close the material loop but not the energy loop!) or for appropriate disposal.
Bottom line, on each step of our chemical and industrial processes, the industry uses energy, predominantly in the form of fossil primary energy sources, which are crude oil, coal, natural gas and fuels derived thereof. Materials can be regarded as “frozen energy” with a certain lifetime, having been produced at a certain point in time based on raw materials supplied by nature and using the energy mix at their specific date of production. This is true for the pyramids of Giza in Egypt (mainly man/animal power) as well as for modern smartphones or any other product of our industrial processes. The energy used is not only captured in these products as such but also in transportation, heating and everything needed to manufacture the product. This part of the energy is dispersed and cannot be recuperated. Concepts around the circular economy are often neglecting this major part of energy consumption.
Going one step further, one could argue that also private income, e.g. salaries paid to the workforce in the global economy, is more or less immediately converted into energy consumption (heating of private homes, mobility, consumer products, etc.). This thought will be taken up later in this article in more detail.
In essence, no other input factor than ener- gy is needed to run the global economy. With sufficient energy available it is easily possible to extract Lithium (needed for batteries) from sea water, ores from less productive deposits, drinking water from sea water in desalination plants and closing recycle loops in the circular economy including activation of carbon dioxide, just to name some examples. Not with-standing the above, one factor is obviously needed in addition: know-how to use energy efficiently, being an area with significant progress during the last decades.
3 Global energy consumption – historically and outlook
With the understanding that essentially only energy matters, a view on the global consumption and supply pattern over the last 55 years supplemented by an outlook until 2040 reveals the full scope of the challenge we are facing (Figure 1).
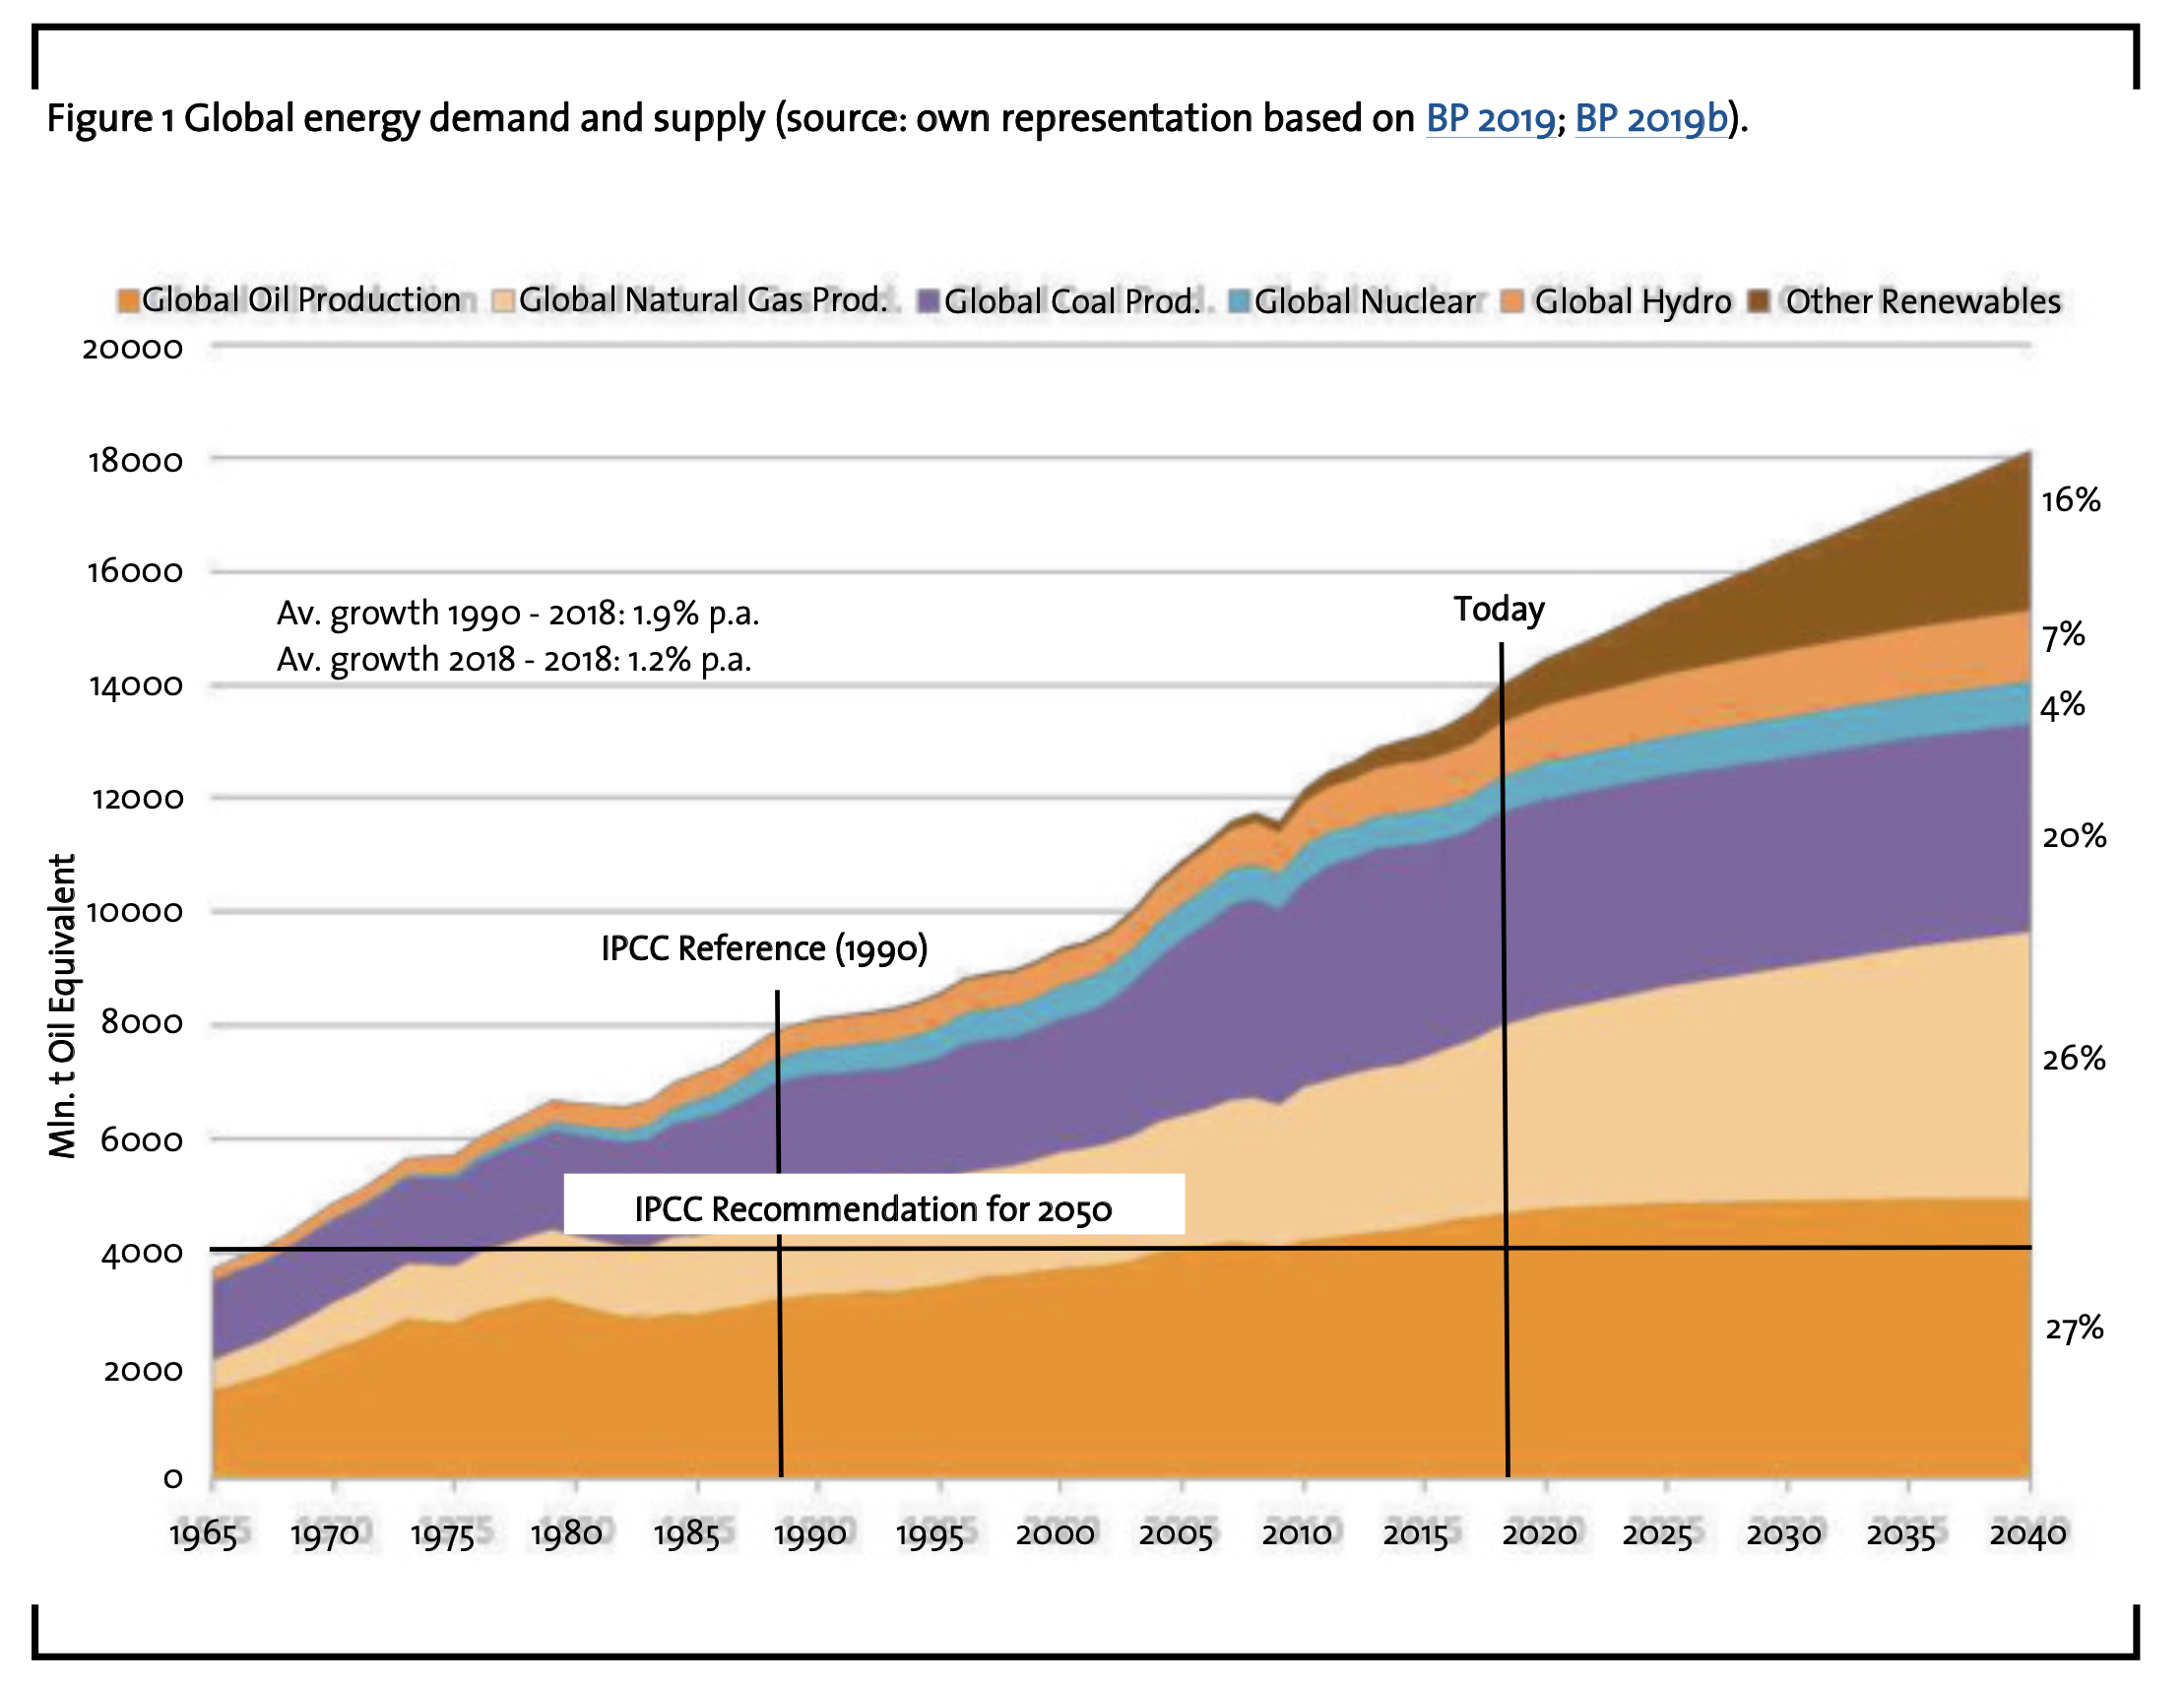
In 2018, global energy consumption had reached a level of 13.9 Gtoe. Crude oil contributed with 4.6 Gtoe (33%), natural gas with 3.3 Gtoe (24%), coal with 3.8 Gtoe (27%), nuclear power with 0.6 Gtoe (4%) and all renewables together with 1.6 Gtoe (12%). Despite its presence in political debates and the media, biofuels only contributed with less than 1% to global energy supply. The average demand growth since 1990 has been rather constant at 1.9% p.a., which shows the same trend as global GDP growth. Looking a bit more closely, there are only short periods when energy demand growth was stable or even decreasing. All these periods were associated with either supply side restrictions, respectively massive price increases (e.g. the oil crises in 1973 and 1979/1980), or lack of global economic growth (such as in the early 1990ies) or again very high oil prices followed by a consumption crisis during and after the financial and banking crisis of 2008/2009. The conclusions from such pattern will be discussed below.
Expectations for the future are worrying. There is no reason to assume that the energy demand trend will change significantly. Climate protection programs could not reverse this global trend in the past. In addition, the demand and supply patterns, which are based on infrastructure and industrial investments over decades can hardly be adapted within the next 20 to 30 years, keeping in mind that for example coal fired power plants, which have driven China’s and in general Asia’s economic growth since the year 2000, have useful lifetimes of 50+ years. The energy demand forecast, based on a scenario which assumes that government policies, technology and social preferences continue to evolve in a manner and speed seen over the recent past, shows a 1.2 % increase p.a. for the next 20 years. Despite a very significant increase of non-fossil energy globally (plus 2.8 % p.a. 2018 to 2040), also fossil fuels are expected to grow in absolute terms (from 11.7 Gtoe in 2018 to 13.2 Gtoe in 2040 or 0.6 % p.a.). Now, it is very obvious that the Intergovernmental Panel on Climate Change (IPCC) recommendation, requesting a reduction of 50% relative to fossil fuel consumption in 1990 or – in other words – going back to the level of consumption in the late 1960ies, will be largely missed on a global level. The situation varies between the regions.
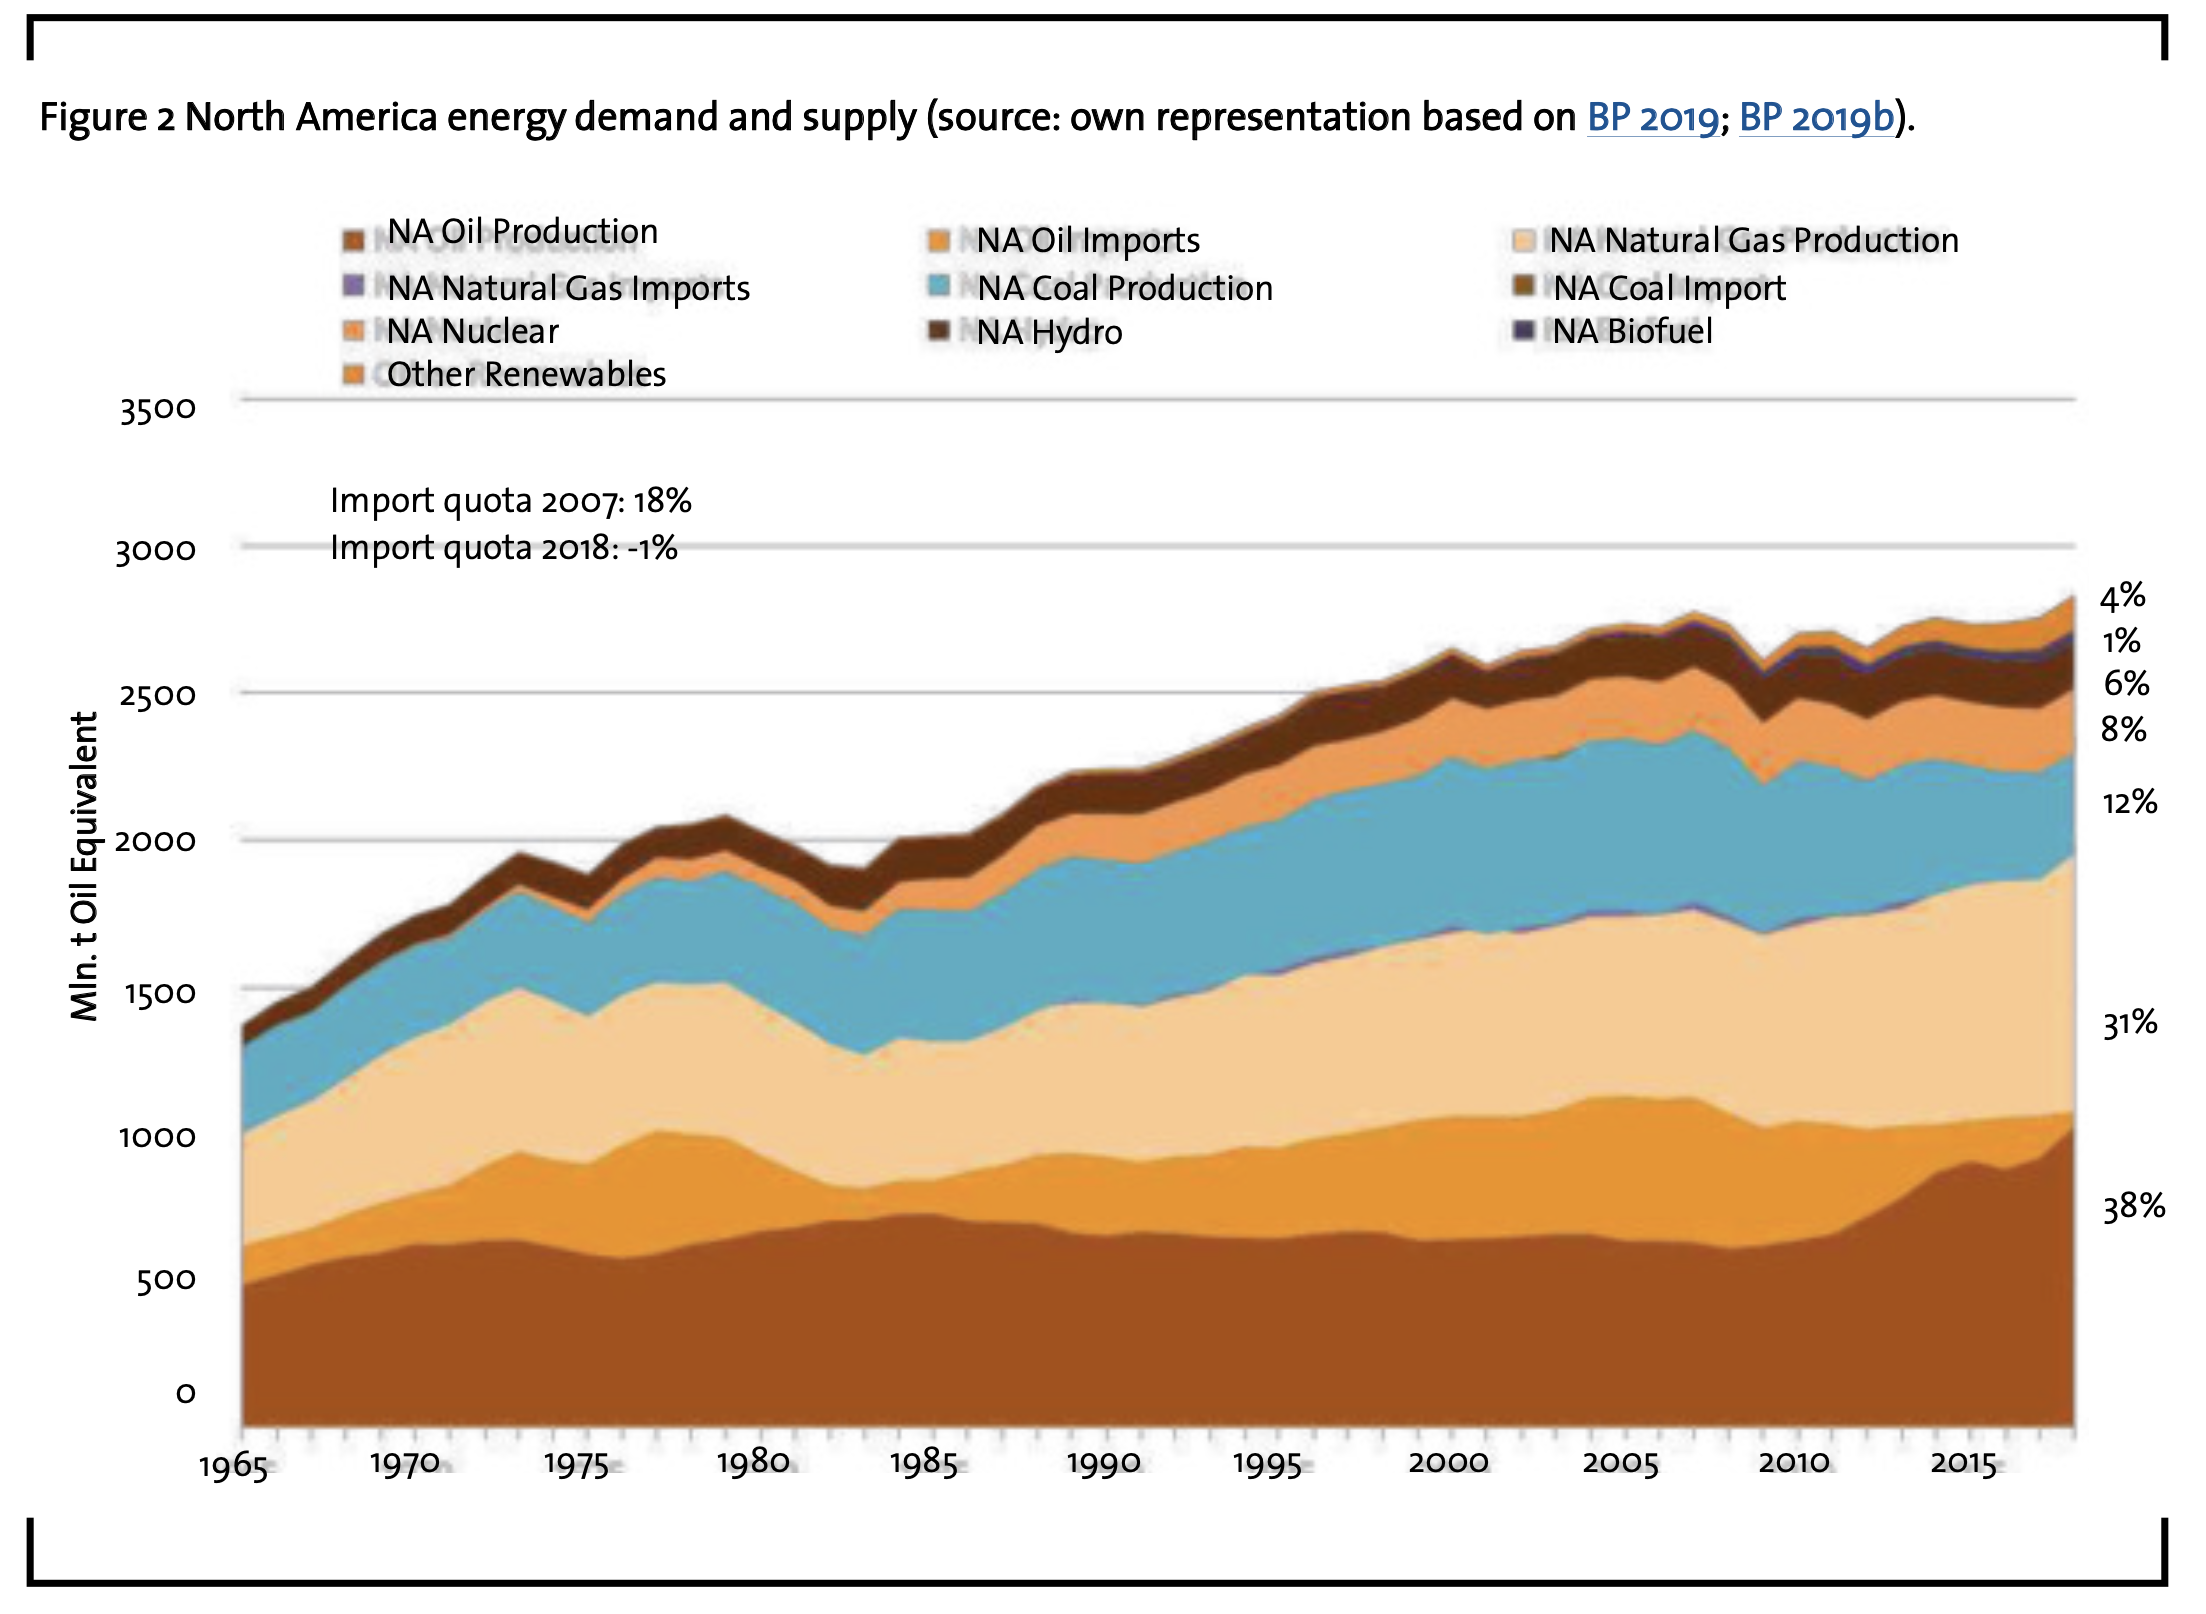
The North American continent with US, Canada and Mexico (Figure 2) is heavily relying on fossil fuels. Demand peaked in 2018 with no meaningful increase in the share of Renewables in the energy supply mix. Very obvious, the impact of shale oil and gas has led to a dramatic decrease in fuel import requirements. The continent has turned into an export region.
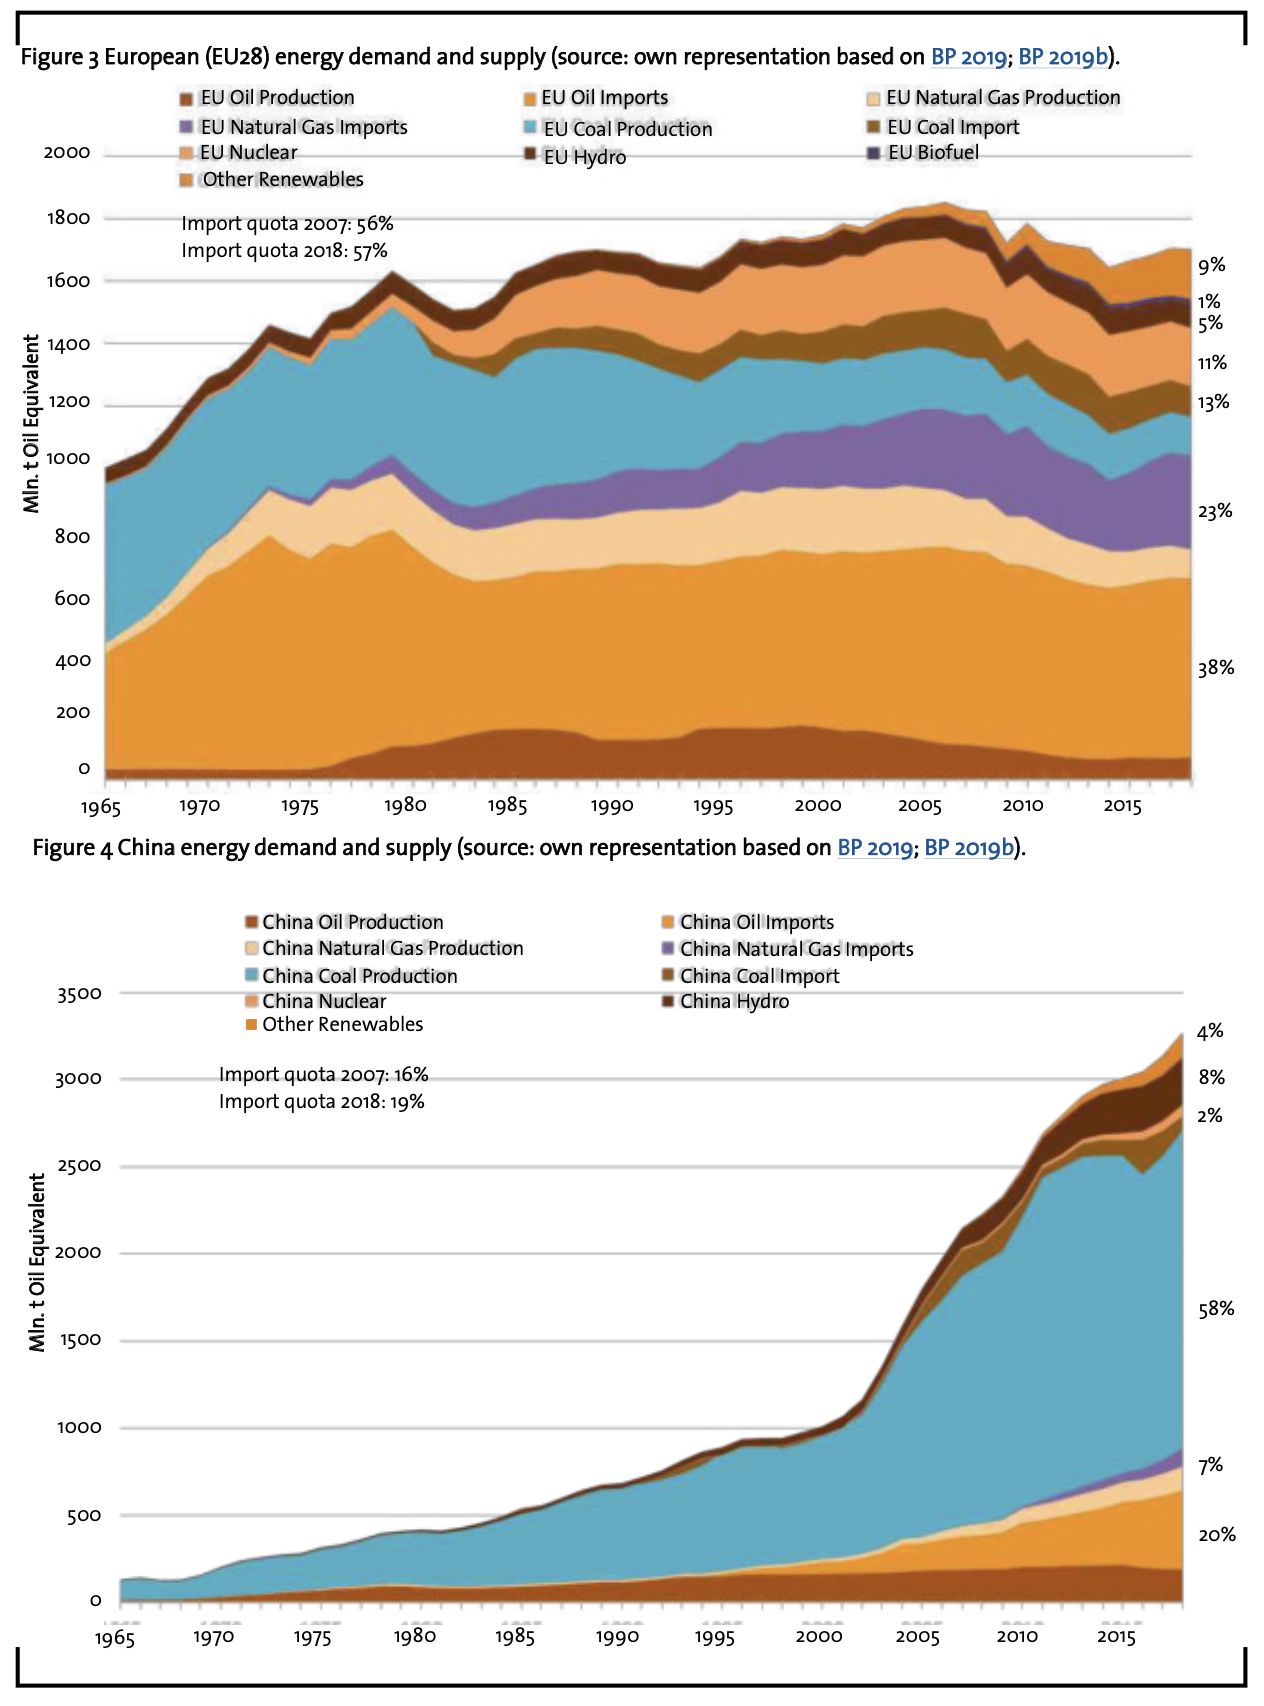
EU28, as a region with a significant lack of own fossil energy sources, shows a different pattern (Figure 3). Energy demand peaked in 2006 and decreased in the aftermath of the economic crisis 2008/2009. With economic growth picking up in most of the EU countries since 2013 and specifically in Germany, energy demand has turned into growth mode again. Dependency from imports remained stable at close to 60 % despite the significant increase in renewables, mainly in Germany, which only just compensated for shutdowns of some coal and nuclear power plants. The growth in energy demand has been covered by additional natural gas imports.
China’s energy demand has increased dramatically parallel to its impressive economic development starting in the late 90ies (Figure 4). While in the beginning the energy demand was covered by own coal resources, including the transformation of coal into chemicals and fuels based on coal to gas processes, China has started to diversify its energy supply base. China is specifically importing liquid fuels for its heavily growing transportation sector. Interestingly, China has largely absorbed the Middle East crude oil production, which did not find its home in the US following the shale oil and gas boom. Without shale oil/gas we would have seen much higher crude oil prices in the past. As part of the diversification strategy, China is also heavily investing in hydro power and Renewables. Over the last 20 years China contributed the largest share to global CO2 emissions based on its fossil fuel consumption, from which in turn the global economy profited through low priced energy intensive products such as construction steel, plastics, chemicals, aluminum, etc. Specifically the US and Europe have benefitted from externalization through using China as a lower cost manufacturing base (“globalization”).
Will global energy demand stabilize on the current level? No! India, the rest of Asia and the African continent are determined to follow the other regions in terms of energy requirements. This development is in particular in line with a number of UN Sustainable Development Goals (Goal 1: End poverty in all its forms everywhere; Goal 7: Ensure access to energy for all, e.g. foster economic development of 1.2 billion people without electricity or 2.7 billion people without clean cooking fuels).
To complete the picture, a holistic view on the primary energy consuming activities is necessary: in a rough approximation, three quarters of the primary energy is needed to run the global economy and provide all elements of the desired increase in prosperity on earth. Only one quarter ends up directly with the end consumer supporting her or his well-being, such well-being means i.e. having access to heating/ cooling/lighting of private homes, fuels to travel from A to B, a wide variety of food and consumer products, benefiting from health care and medication, having access to information and data services, living in a secure and protected environment, enjoying cultural activities (sports, music and art) and supporting science.
It is important to note, that the three quarters needed to run the global economy are the pre-condition for the wealth of each individual. The one goes hand-in-hand with the other.
Could efficiency change the picture? Up to now: again No! Until today, in most human activities increasing efficiency has often been (over-)compensated by larger living space per person, increased passenger kilometers, higher quality products, standards and services (technological advancements in automobiles over time may serve as an example).
4 GDP and energy demand
Under the assumption that only energy is driving our global economy, global GDP (80.7 tn US$ in 2017) (Table 1) can be directly linked to the global energy demand of 13.5 Gtoe in 2017. The global GDP value created by one toe was around 6000 US$ in 2017. Figure 5 represents the development over time based on real US$ (2017). On a global level the desired decoupling of GDP from energy demand cannot be observed. Over 20 years, GDP per toe increased by only 0.7 % p.a.
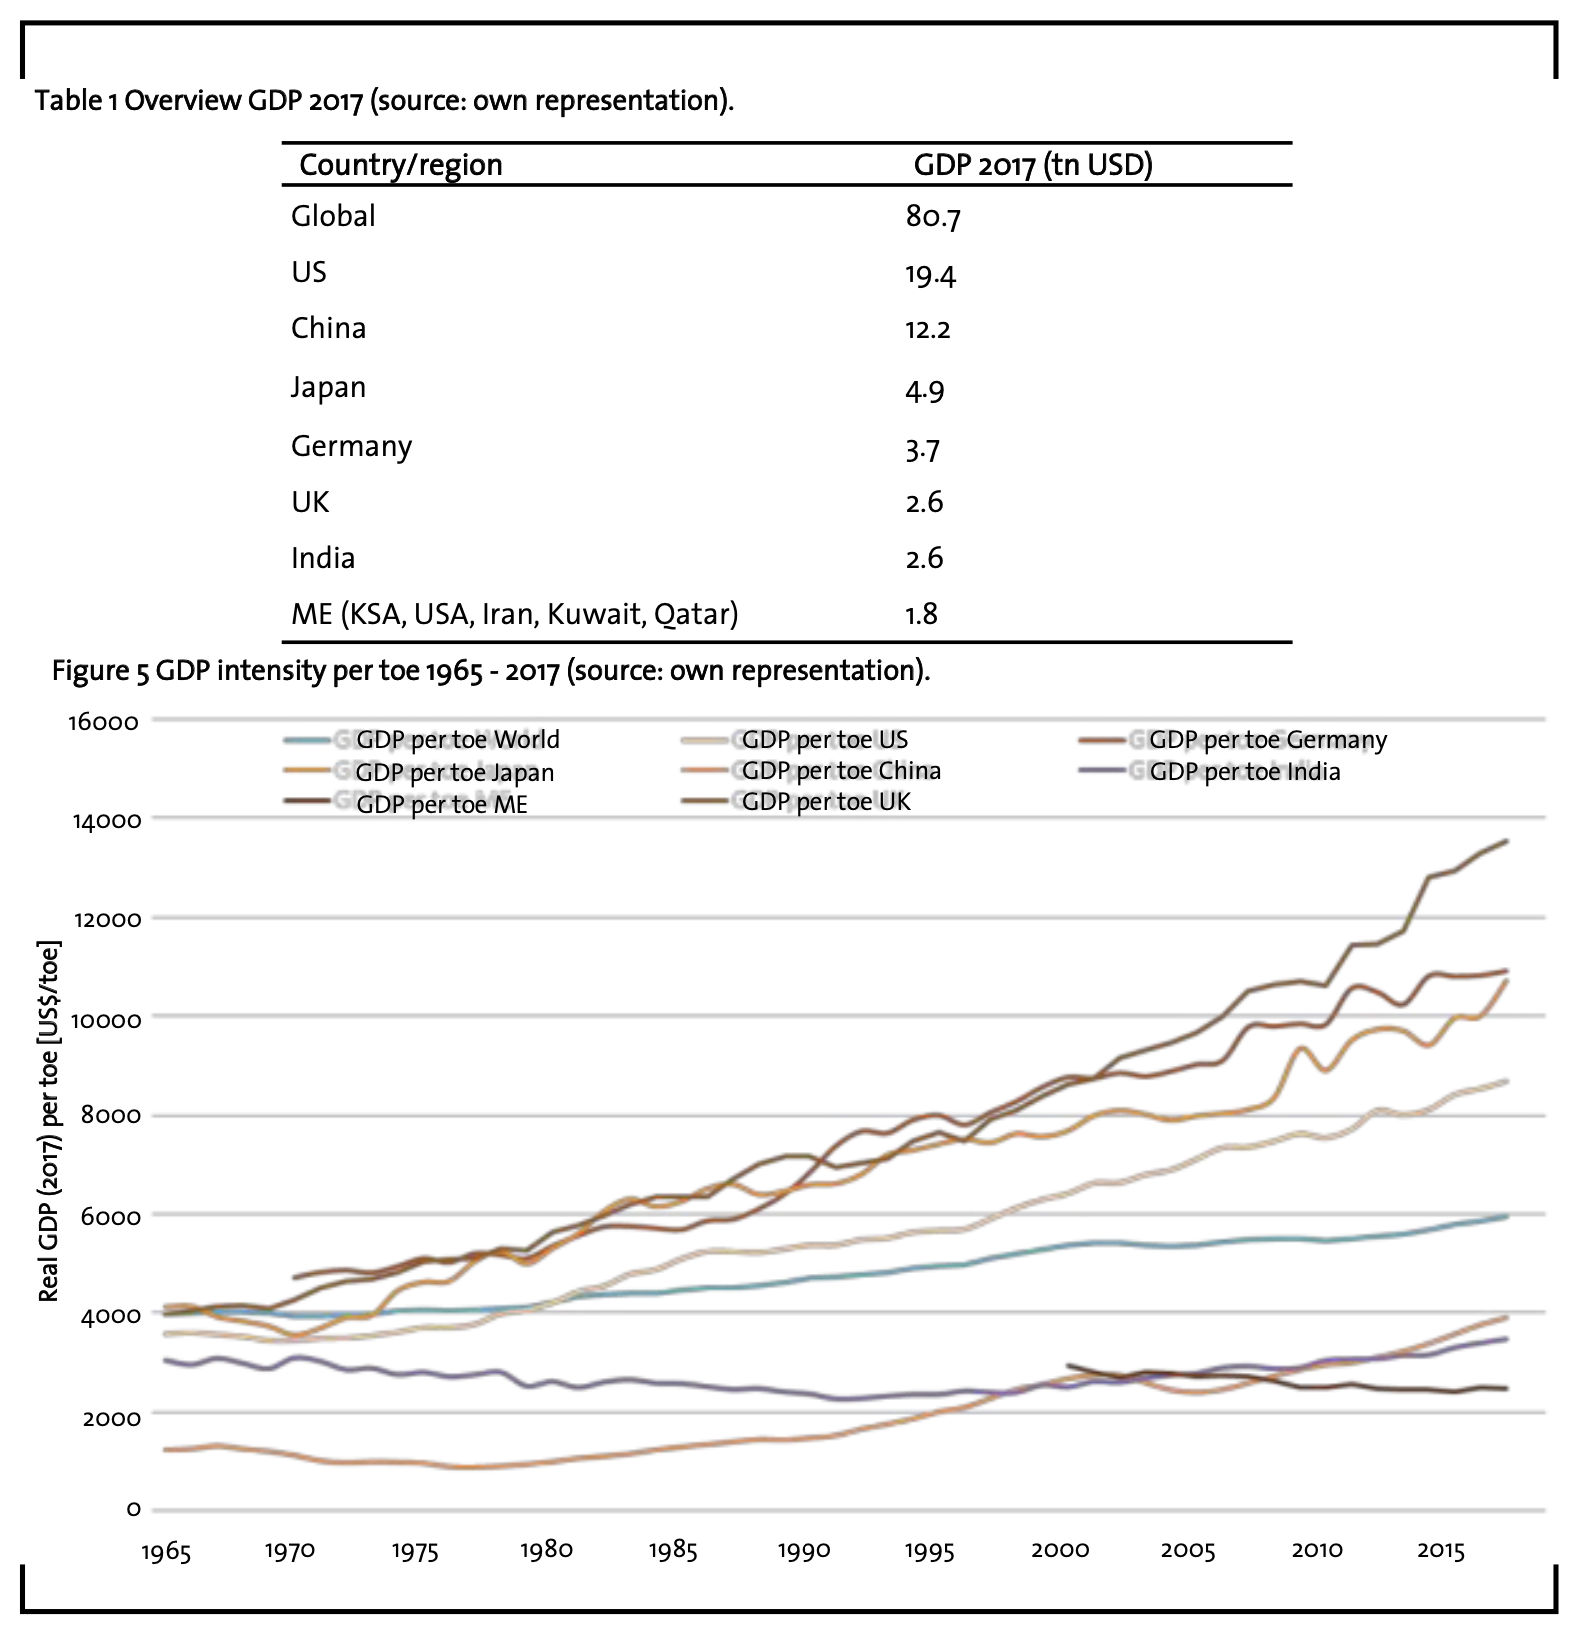
On the one hand, countries like Germany or Japan have improved the ratio over time and produce a higher GDP per toe than other countries. The reason behind are efficiency gains (higher utilization in key industries and infrastructure, energy saving measures, e.g. insulation of renovated homes or low energy homes when newly built) but also externalization of energy consuming industries (refineries, steel and chemical industry, etc.). On the other hand, countries such as China and the Middle East have built up such energy intensive industries. Consequently, GDP per toe in these countries are significantly below global average.
Also from a theoretical point of view there is no reason to assume that a decoupling could be possible. Major efficiency gains in the past came from economy of scale and automation. These effects were partly compensated by depletion of low cost resources (e.g. substitution of crude oil production costs of 50 cts/bbl in the Middle East by 30+ US$ per bbl from shale oil or Canadian tar sands), increased quality of products (e.g. automobiles, machinery), higher standards across all economic activities and more transportation (also as a result of globalization).
The consequences of the direct correlation between GDP and energy demand are now obvious:
- Any kind of investment or spending, independently whether it is business, government or private, creates energy demand somewhere on the planet.
- Any increase in global GDP and hence prosperity requires additional energy input. The global growth just depends on available energy (only energy limits the global potential growth).
- Consequently, “money” can actually be considered as a license to consume a certain amount of (primary) energy. Remunerations and salaries paid then become nothing else but the right to consume energy, e.g. for heating/cooling of private homes, transportation, purchasing of goods (purchase of “frozen energy”) or paying for services, which allow others to consume parts of the energy needed (e.g. spending money during vacation).
- Global currencies are “backed” by global energy reserves and the availability of those reserves. As long as money supply by the central banks is in line with economic growth based on additionally available energy, there is no fundamental reason for any kind of economic crisis. Prosperity without economic cycles could go on for decades until mankind in total has achieved a certain standard of living. Even an unconditional basic income would be possible on the long run.
- Ownership in invested capital just means control rights over physical assets, which had been produced with a certain energy mix in the past.
- Monetary entitlements due at a certain point in time in the future (e.g. loans, pensions, etc.) are safe as long as there is sufficient energy available at that due date (and the entities that have to pay back the loans/pensions have access to such energy).
5 Consequences for the climate protection debate
A carbon tax of 30 US$ per ton of CO2 emission or approx. 100 US$ per toe is insignificant compared to the value created by one toe (6000 US$). In business, CO2 taxes are just incorporated into the price of a specific product. Even worse, taxes paid by one part of the global economy are reallocated to and spent by other entities. With this spending additional energy is consumed and hence the corresponding CO2 equivalents are emitted elsewhere. Reasonable taxes are an instrument to drive efficiency but not an instrument to reduce emissions in absolute terms. Despite the fact that many countries are not participating in the CO2 trading schemes, which undermines the concept already, CO2 taxes cannot fundamentally solve the problem in view of absolute emissions. There are only two ways to solve the CO2 problem:
(1) Limit and reduce the consumption of fossil fuels based on binding agreements
To understand the consequences of such an approach, it is important to keep in mind another very significant relation: energy consumption generates GDP and GDP generates workplaces. With this relation in mind, unfortunately no one can have an interest in significantly reducing the energy input into the global economy in a comparatively short time frame (e.g. until 2035 or 2050). Without the continuous flow of energy on today’s level our global society would fall apart. The banking crisis 2008/2009 with a global GDP (and energy) slump of only 5% (energy minus 2%) for just one year is the most recent show case, which demonstrates the vulnerability of our global economy. The Great Depression of the year 1928 – manufacturing decreased by approx. 30% – is the worst case in recent history with all its disastrous consequences around the globe. IPCC requests a reduction of fossil fuels by 70% until 2050 compared to today’s level. Clearly, limitation of fossil fuels without compensation through non-fossil fuels is not an option at all. This leaves only the following path forward:
(2) Heavily invest in renewable energies on a global scale (global “Energiewende”)
During the last decade, renewable energies got much more efficient. For wind power plants in Germany energetic amortization can be achieved within 2-7 months and approx. 2 years for photovoltaic systems. Consequently, mankind needs to significantly accelerate investments into these technologies in combination with smart power grids and storage solutions. Mankind needs to invest for a certain period of time a meaningful portion of the global GDP into Renewables. Instead of building tanks, warplanes and reentering into a new arms races, investments in a decentralized energy system could not only contribute to solve the CO2 problem but also to reduce the major inequality between nations and continents on our planet.
6 Perspective – what needs to be done in addition to existing programs
- The supply side of energy: Provide significantly more financial funds for investments in renewables through involuntary contributions by the wealthy parts of the societies (in exchange for shares in such energy undertakings) and drive innovation in storage systems.
- Demand side of energy: Accelerate all measures to save energy and drive innovation in all areas of human activities to maximize well-being with a minimum of energy consumption (e.g. isolation of buildings, e-mobility, sharing economy, enhance lifetime of products, etc.).
- Avoid destruction of “frozen energy” and activities not supporting prosperity. Ban and eliminate activities incompatible with the climate goals, such as wars, excessive military spending, excessive luxury, private flights into space, etc.
- Communication strategy: Explain the relation between money spending, energy consumption and CO2 emissions to our societies and create awareness in all parts of a society.
- Transparency on CO2 emissions: Establish a CO2 account (like a bank account) for each and every person on the planet, which collects CO2 emissions triggered by the personal lifestyle. This personal account should create visibility and a sense of urgency on a personal level; all CO2 emissions, also the ones from the global economy need to be allocated to the end consumer, who is finally responsible for all the impact of her/his consumption pattern.
- Intensify research along the lines outlined above: Further develop the concept of energy value chains in more detail and adjust the established macro economic theories and specifically growth theories (not labor, capital and innovation define the boundaries but just energy availability and innovation). Describe the relation between GDP, primary energy consumption and workplaces. Develop concepts to distribute work amongst a growing world population with a higher degree of automation (digitalization) and less energy input. Provide for statistical data to describe the efficiency of our global world in detail (Input: Primary energy sources; Output: Well-being).
7 Summary
The article presents a holistic view on our global energy supply/demand situation and argues that in today’s world, economic activity and hence our prosperity is just primary energy consumption (besides the knowledge to utilize such energy). This fundamental understanding allows to link energy consumption directly with economic and financial development and vice versa. Each and every US$, Euro, Yen, etc. spent or invested creates energy demand, secures workplaces and, unfortunately, causes also CO emissions, which stem from the 85 % fossil fuels in the global primary energy mix. All economic activities require energy input and, consequently, any economic growth results in even higher energy demand. On a global level, a decoupling of GDP and energy consumption is neither obvious in available data (except for some efficiency gains) nor does it have a theoretical justification. As a result global energy demand will continue to grow and can be expected to even outpace the ambitious implementation plans for renewable energies. Based on today’s economic growth expectations and political concepts, fossil energy demand must be expected to grow further leaving no realistic opportunity to achieve IPCC goals by 2050. The only way forward is a) a very significant increase of renewable energy (especially from wind and photovoltaics) and b) to create transparency in CO2 consumption for each and every person on the planet. The author opts for a radical new way of thinking along the lines of Energy Value Chains and associated CO2 generation, involuntary investments in renewable energy funds by the wealthy parts of our societies, measures to create transparency on CO2 emissions associated with personal life style and a significantly better communication of related facts across our global society.
References
BP (2019): BP Statistical Review of World Energy, available at https://www.bp.com/ content/dam/bp/business-sites/en/global/ corporate/pdfs/energy-economics/statistical- review/bp-stats-review-2019-full-report.pdf, accessed 19 June 2019.
BP (2019b): BP Energy Outlook 2019, availa- ble at https://www.bp.com/content/dam/bp/ business-sites/en/global/corporate/pdfs/ energy-economics/energy-outlook/bp-energy- outlook-2019.pdf, accessed 19 June 2019.
Frauenhofer Institute for Solar Energy Sys- tems ISE (2018): Aktuelle Fakten zur Photovol- taik in Deutschland, dated 21 February 2018, available at https://www.ise.fraunhofer.de/ content/dam/ise/de/documents/publications/ studies/aktuelle-fakten-zur-photovoltaik-in- deutschland.pdf, accessed 19 February 2019.
Kopel, T. and Utikal, H. (2019): Zirkuläre Wirtschaft – Eine reale Geschäftschance, Nachrichten aus der Chemie, 67 (Februar 2019), pp. 27-29.
United Nations (2015): United Nations Gen- eral Assembly Resolution A/RES/70/1, Trans- forming our world: the 2030 Agenda for Sus- tainable Development, available at https:// www.un.org/en/development/desa/ population/migration/generalassembly/docs/ globalcompact/A_RES_70_1_E.pdf, accessed 19 February 2019.
United Nations (2015b): The Paris Agreement, available at https://unfccc.int/sites/ default/files/english_paris_agreement.pdf, accessed 19 February 2019.
World Bank (2018): World Development Indicators, available at https://databank.worldbank.org/source/world-development-indicators, accessed 19 February 2019.