How to evaluate the future business potential of innovation fields in the chemical industry
Abstract
Decisions about the further development or termination of innovation fields (IF) have a high relevance for companies. However, due to a lack of information in the front end of innovation (FEI) as well as missing evaluation methods and criteria, selection decisions are often based on personal “gut feeling”.
By identifying 24 indicators, which have a relevant influence on the business potential of IFs, the authors present a methodology to evaluate and determine the business potential of IFs in the FEI. This potential is determined by the newly developed Innovation Field Impact Factor (IFIF) combined with a Certainty Factor and depicted in a heat map. The heat map enables the identification of strengths and weaknesses in each IF as well as a comparison of the business potential of different IFs. After developing the methodology, its viability was verified using the example of eleven IFs at a specialty chemicals company. The presented methodology is an interesting approach for companies to develop their own specific indicators for the evaluation and selection of innovation projects and IFs in the FEI.
1 Introduction
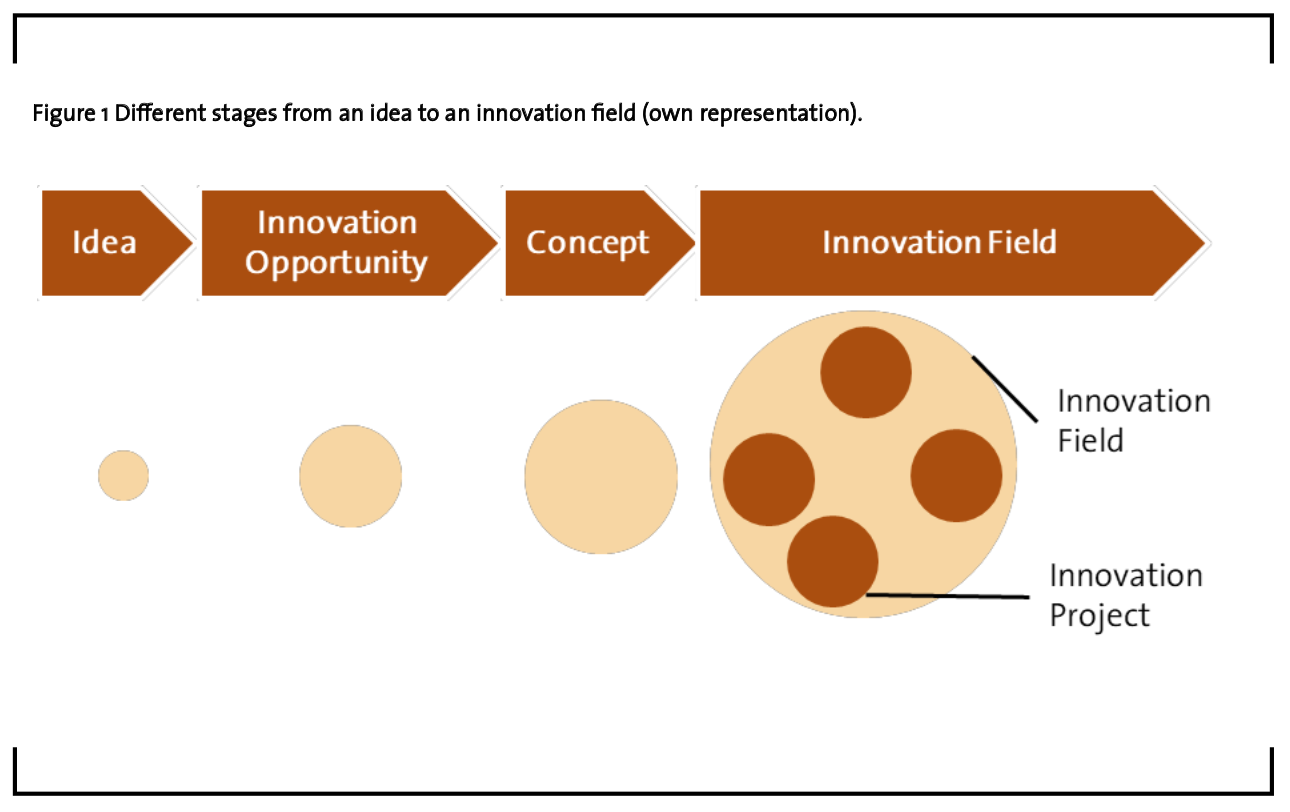
In order to generate successful innovations, several researchers like Cooper et al. (2004), Salomo et al. (2008) and Talke et al. (2010) suggest concentrating innovation activities in arenas or in innovation fields. “An innovation field consists of multiple, thematically related innovation projects, thus stimulating synergies among these projects” (Salomo et al., 2008). This field is an attractive market opportunity of strategic and long-term importance, linking trends and industry needs with own competences such as technologies, services and business models. The innovation projects, which exist within an innovation field (IF), are typically related by one common theme, which may be a customer need, a core competence, a technology platform, or any combination of these aspects (Salomo et al., 2008). Companies which concentrate their innovation activities in IFs may be characterized by thoughtful strategic choices concerning the focus of their innovation management (Talke et al., 2010). An IF develops out of an idea for an innovation. With an increasing knowledge about the idea’s business potential and its opportunities for application and with an advanced certainty about the innovation’s future success, this idea might evolve into an innovation opportunity and an innovation concept. If the concept offers enough business potential and if it is large enough for generating several single innovation projects, it may be transformed into an IF (Figure 1).
Instead of focusing on single innovation projects, Salomo et al. (2008) and Talke et al. (2010) suggest the establishment of a whole innovation portfolio in which several resources are bundled, and innovation projects are developed simultaneously.
Meanwhile, various companies and their R&D departments have established a portfolio focus and a process to identify and develop new IFs. The entrepreneurial aim of new IFs is generating successful innovations to increase the organization’s profitability and the success of the company in the long term. Martinsuo and Poskela (2011) and Kock et al. (2015) demonstrated in their research that the utilization of decision criteria may be beneficial for achieving future business potential and increases the probability of success in the early stages of the innovation process.
However, not all IFs turn out to be successful and due to the large amounts of spent resources, the failure of an already developed IF and its innovations may be severe. For this reason, the business potential of intended IFs and their probability of success should be evaluated and analyzed early in the innovation process in order to avoid spending too many resources such as time and money on potentially unsuccessful IFs.
Although the relevance and the advantages of focusing and developing innovations within IFs have been described and emphasized (Salomo et al., 2008), literature on the research and on the selection of IFs has been neglected. Consequently, there is no methodology available which evaluates and analyzes new IFs.
It is the authors’ aim to identify criteria and to develop a methodology to evaluate the business potential of IFs in the specialty chemicals industry at the beginning of the innovation process in the front end of innovation (FEI). The methodology’s purpose is a quick and simple evaluation of the IF’s business potential after the collection of relevant information during idea generation.
This paper is structured as follows: In the next section, a literature review presents the most important research about innovation management and decision-making. The following chapters outline the methods which have been used for the identification of the criteria evaluating the business potential of IFs and the weighting methods which were applied for the weighting of the identified criteria. In the fourth section, the identified business potential evaluation criteria and their weighting factors are demonstrated. In addition, the newly developed Innovation Field Impact Factor (IFIF), the heat map as well as the methodology’s application on the evaluation of eleven intended IFs are shown in this chapter. This article ends with a summary and an outlook.
2 Literature Review
This section gives an overview about the Fuzzy Front End (FFE), innovation portfolio management as well as selection and decision making methods used in innovation management.
2.1 Fuzzy Front End
Every innovation originates out of a stimulus and an idea for an innovation. If this idea or stimulus seems to be successful and worth for further analysis, it is further developed in the innovation process.
The first phase of the innovation process (Figure 2), in which a stimulus and an idea for an innovation is created, is called the front end of innovation (FEI). The FEI is often referred to as the Fuzzy Front End (FFE) (Montoya-Weiss and O’Driscoll, 2000; Koen et al., 2001) due to its chaotic, undefined and unstructured activities and processes. Kim and Wilemon (2002) define the front end as “the period when an opportunity is first considered and when an idea is judged ready for development”. Koen et al. (2001) describe the FFE as the mysterious portion of the innovation process. Therefore, the FFE is of very high interest in the literature and many researchers have worked and concentrated on the processes within the FFE.
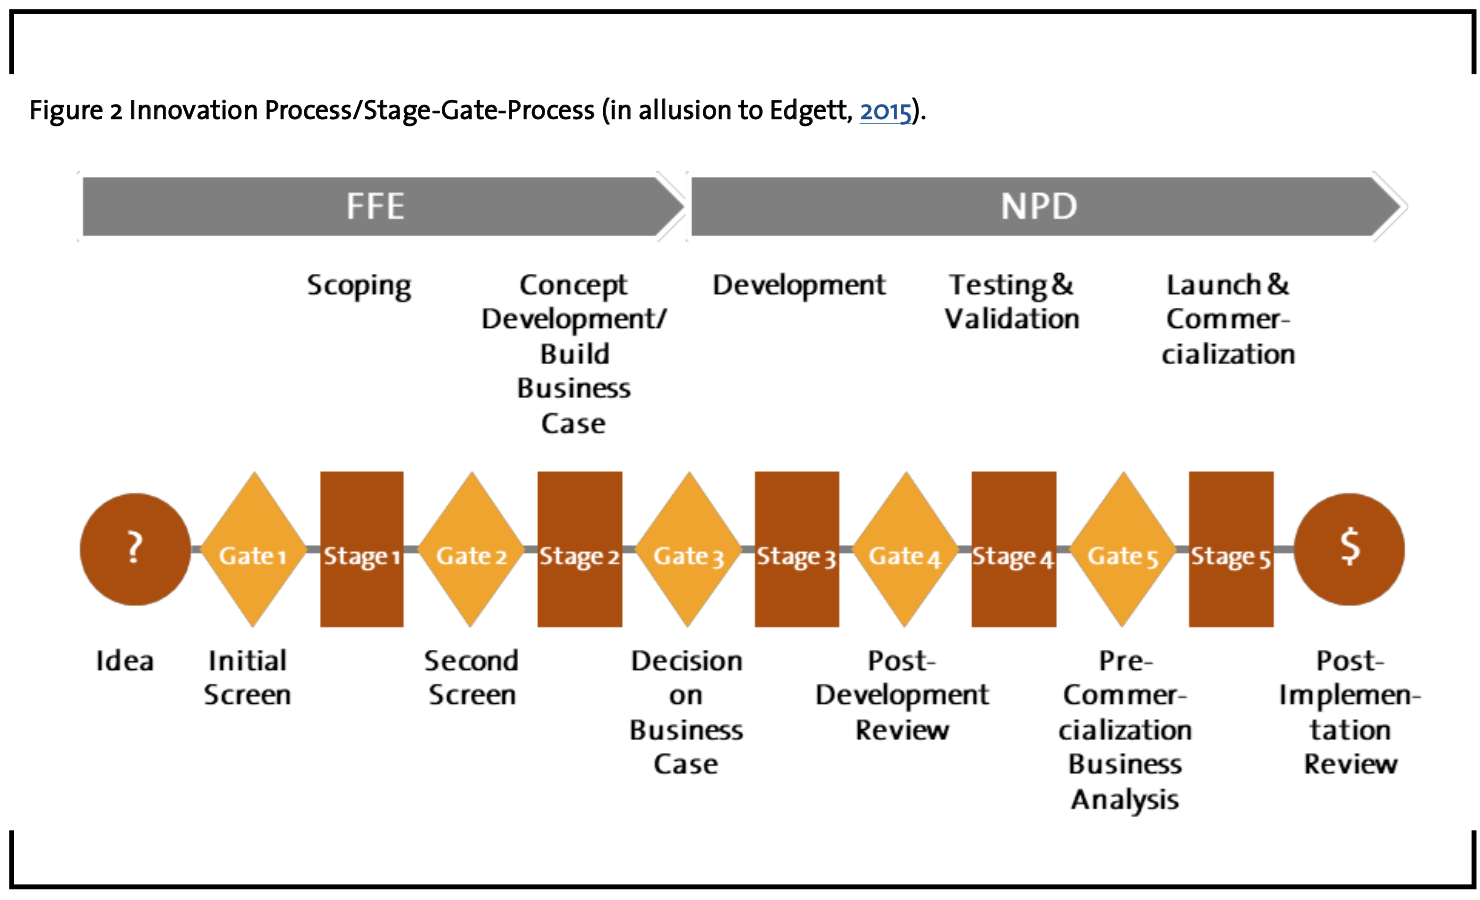
In contrast to the more chaotic FFE, the new product development (NPD) process, which follows after the FFE in the innovation process, is highly structured and organized. The processes and activities in the NPD are strictly based and orientated on goals and milestones which have been determined in the business plan. The achievement of these goals is controlled at the gates with the help of an increasing number of criteria which need to be achieved prior to the transfer into the next stage (Cooper, 1990; Edgett, 2015; Herstatt et al., 2004).
The FFE is recognized as a driver for successful product innovation and future business success (Khurana and Rosenthal, 1998; Verworn, 2009). It is considered to be the first phase of the innovation process and covers the stages from idea generation until its approval for development, funding and the launch of a new product development project or its termination. In this phase first ideas are generated, developed and evaluated, opportunities are identified, potential concepts are developed and formulated, products are defined and also first plans for further potential development projects are initiated (Khurana and Rosenthal, 1998).
Figure 3 shows typical characteristics of the innovation process. In the FFE, there are many opportunities for the development. On the one hand, the degree of freedom for the design and the influence on information and on the cost structure is very high. On the other hand, the amount of information concerning the new product or service, is usually low compared to the following phases of the innovation process (Herstatt and Verworn, 2004). Especially, the level of uncertainty concerning the innovation’s market and technology is high (Herstatt and Verworn, 2004). Due to the lack of information, symbolizing the main limiting factor in the FFE (Herstatt and Verworn, 2004), decisions in the FFE are often just made on the basis of the managers’ “gut feeling” which is based on subjective evaluation and therefore is not conducive to a comparative analysis (Montoya-Weiss and O’Driscoll, 2000).
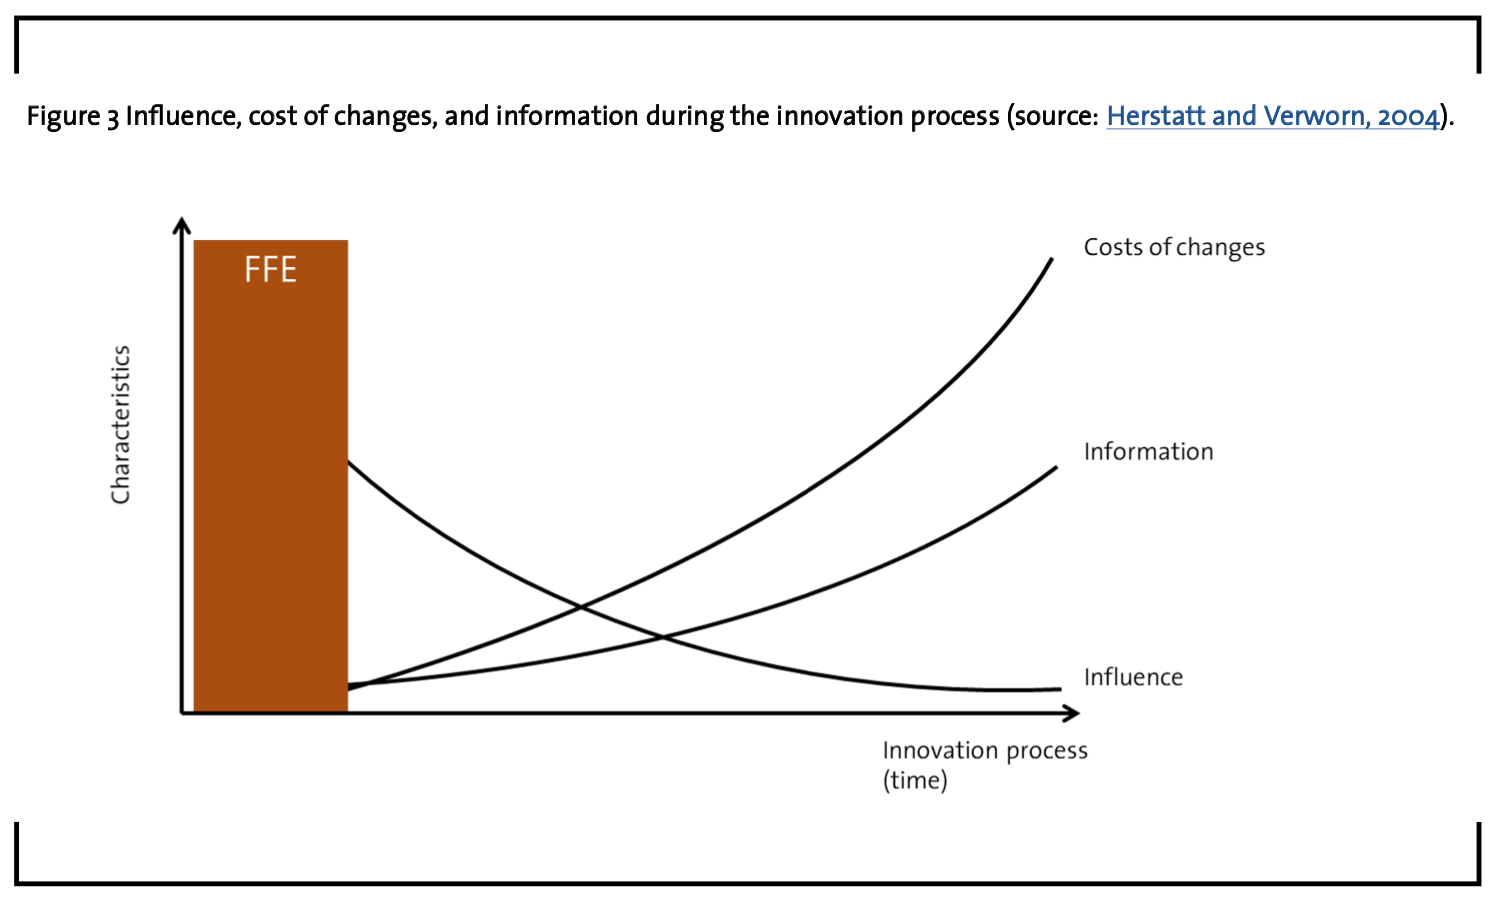
The costs for processes in the FFE are quite low compared to the following phases, but a high amount of costs for the further development of the innovation and its design are already determined in this early phase of the innovation process. Thus, it is worth to invest more money, time, intelligence and resources in the early stages of the innovation process to avoid having spent money on innovations which turn out to be unsuccessful in the later phases of the innovation process (Reid and de Brentani, 2004; Verworn et al., 2008).
Since future products, services, quality and costs are already defined in the FFE, it has a key role in the innovation process. The decisions and processes executed in the FFE may have an enormous impact on the subsequent innovation process and the innovation itself and determine to a great extent which projects will be executed and continued. For this reason, the company’s success largely depends on the success of the innovation activities and processes in the FFE.
By developing a method to evaluate the future business potential of IFs, it is the approach of this research to bring visibility to the FFE and to make decisions taken in the FFE more objective, transparent and comparable so that decisions taken in the FFE do not need to be taken just on the basis of “gut feeling”. Such a methodology is even supported by Kock et al. (2015) who suggest the introduction of formal processes in order to evaluate and select innovation ideas and concepts which might evolve to successful innovations and services.
2.2 Portfolio Management
In order to be successful, it is essential for companies to define an innovation strategy with a portfolio perspective on the ideation phase instead of developing several independent innovation projects (Kester et al., 2011; Kester et al., 2014; Kock and Gemünden, 2016). Companies need to continuously generate, develop and maintain a sufficient amount of high-quality and promising ideas and concepts to obtain a well-balanced portfolio of potential innovations. This portfolio may capture the portfolio value, leverage synergies and reduce risks at the portfolio level (Kock et al., 2015). These ideas and concepts should be strictly evaluated, selected and prioritized (Kock et al., 2015; Martinsuo and Poskela, 2011). The selection of ideas and concepts is of special importance and interest, since the companies’ resources for the development of new innovations are usually scarce, and only the most promising ideas may be further supported (Heising, 2012; Kock et al., 2015). For this reason, a strict evaluation and selection system of the ideas and concepts, which might offer the highest potential for success, must be developed to select the most promising ones out of the large pool of ideas generated in the ideation phase (Martinsuo and Poskela, 2011). Therefore, a systematic portfolio management is needed for the early stages of idea generation and concept development in order to ensure that only appropriate and promising opportunities for further development are selected and supported (Meifort, 2016). Kock et al. (2015) state that a portfolio perspective and the formalized evaluation and selection of ideas and concepts are beneficial for the company’s front-end success. The right management of front-end activities within the portfolio management has a huge impact and relevance for the performance of subsequent phases in the innovation process. The successful management of activities in the FFE might lead to innovation portfolio success and successful innovation projects and IFs (Kock et al., 2015; Verworn, 2009).
Portfolio Management may be divided into two subtypes which need to be clearly distinguished from each other: Innovation Portfolio Management (IPM), also including Ideation Portfolio Management, and Project Portfolio Management (PPM).
Ideation portfolio management concentrates on the formulation and the development of a portfolio strategy and the selection of promising concepts in the FFE which might evolve into successful innovation projects (Mathews, 2010). Ideation portfolio management is a central process for turning the corporate strategy into action and is defined as dynamic decision-making process in which innovation concepts and projects are constantly evaluated, updated and selected, and resources are allocated to them (Cooper et al., 1999; Meifort, 2016). IPM needs to provide a fast, unbiased decision-making process, in which the concepts with the highest business potential among the large pool of ideas that may originate in the ideation are quickly identified (Mathews, 2011). The management of an innovation portfolio is quite complex, since the uncertainty in the early stages of the innovation process concerning the ideas and concepts is very high (Mathews, 2011; O’Connor and Ayers, 2005; Paulson et al., 2007).
A systematic portfolio management is needed for the early stages of idea generation and concept development in order to ensure that only appropriate and promising opportunities and concepts for further development are selected and supported. If the selections and decisions are performed properly and if the ideation portfolio is well integrated into the subsequent PPM, the support and funding of the selected projects may be increased and projects may be implemented faster (Heising, 2012). Thereby, the probability that supported projects may lead to successful innovations is increased (Say et al., 2003). IPM should emphasize the focus on ideas and concepts in the phases of the FFE as well as the integration of these projects into the company’s innovation portfolio.
In contrast to the IPM, PPM is focused on managing and delivering projects in the NPD and is managed in a linear process (Cooper et al., 2000; Mathews, 2011). PPM deals with the coordination, and control of multiple projects pursuing the same strategic goals and competing for the same resources (Martinsuo, 2013). Companies have adopted several frameworks such as the utilization of project evaluation and decision criteria, project evaluation and control routines and other means to formalize their PPM and to improve product success rates (Hunt et al., 2008; Martinsuo, 2013). Managers use these methods to prioritize the different projects for achieving strategic benefits (Cooper et al., 1997).
2.3 Decision Making and Idea Selection
Due to scarce resources and the possible failure of innovations, an innovation portfolio management is required in order to strictly evaluate and select the most promising opportunities and concepts. Thus, besides the requirement for an efficient and effective portfolio management for the evaluation and selection of innovation concepts in the FFE, a reliable decision-making mechanism is needed for the transparent and effective evaluation of innovation ideas and concepts. Several researchers suggest the introduction of formal processes to evaluate and select innovation ideas for increasing the probability of success in the FFE (Carbonell-Foulquié et al., 2004; Hart et al., 2003; Martinsuo and Poskela, 2011). In addition, the usage of certain criteria might offer a high benefit for achieving future business potential (Martinsuo and Poskela, 2011). A well-managed innovation portfolio may increase the amount and quality of new innovation concepts which can be turned into innovation projects and IFs. According to Mathews (2011), criteria for decision-making should be uniform, broadly-comparable, objective and verifiable, independent, sufficient for effective decision-making and quantitative to allow the calculation of additional value metrics in order to ensure a transparent selection and decision process.
The quality of decision-making in innovation portfolio management is of high importance since the way decisions are made determines whether the right opportunities and concepts are chosen and whether the portfolio is in alignment with the strategy (Kock and Gemünden, 2016).
Since the 1950’s, innovation research has shown several different methods and multiple sets of criteria and indicators for the evaluation of innovation projects – yet only in the New Product Development (NPD) phase of the innovation process.1 Widespread and established criteria are e.g. the amount of patents, patent citations, patent family classes, publications, the possible amount of applications or the estimated market size. Up to this point, no criteria have been developed to evaluate concepts and innovation opportunities in the FFE.
1 The authors refer to the methods developed by Davis et al. (2001), Dodgson and Hinze (2000), Henrikson and Traynor (1999), Mathews (2011), Paulson et al. (2007) and Say et al. (2003).
3 Methodology for identification and weighting of criteria
In this chapter, the process to identify relevant criteria for the evaluation of the IFs’ business potential is shown. Furthermore, the methodology for weighting these criteria is demonstrated.
3.1 Qualitative expert interviews
For the development of a methodology to evaluate the future business potential of IFs, a set of criteria needed to be identified at first. In order to identify suitable and relevant evaluation criteria, qualitative expert interviews have been conducted. In the description of their method to identify a set of criteria for weighting proposed projects, Henriksen and Traynor (1999) state that the most correct set of criteria is the one the majority of stakeholders finds most accurate and comfortable and which captures the relevance of the company’s innovation and R&D goals. Hagedoorn and Cloodt (2003) suggest to use several criteria for the evaluation of innovation opportunities, too. Instead of assuming the ‘correctness’ of a single indicator, the utilization of multiple criteria in an evaluation system allows the measurement of the innovation opportunity’s innovative performance in a more complex and informative approach (Hagedoorn and Cloodt, 2003).
The criteria, which determine the business potential of IFs in the chemical industry, were derived from expert interviews. In this study, 35 experts have been selected from a group of innovation managers, all working in lower and middle management positions in a specialty chemicals company.
By asking the innovation managers for their opinion on the indicators, the set of criteria might be very accurate and might capture the organization’s goals and its innovation strategy (Henriksen and Traynor, 1999).
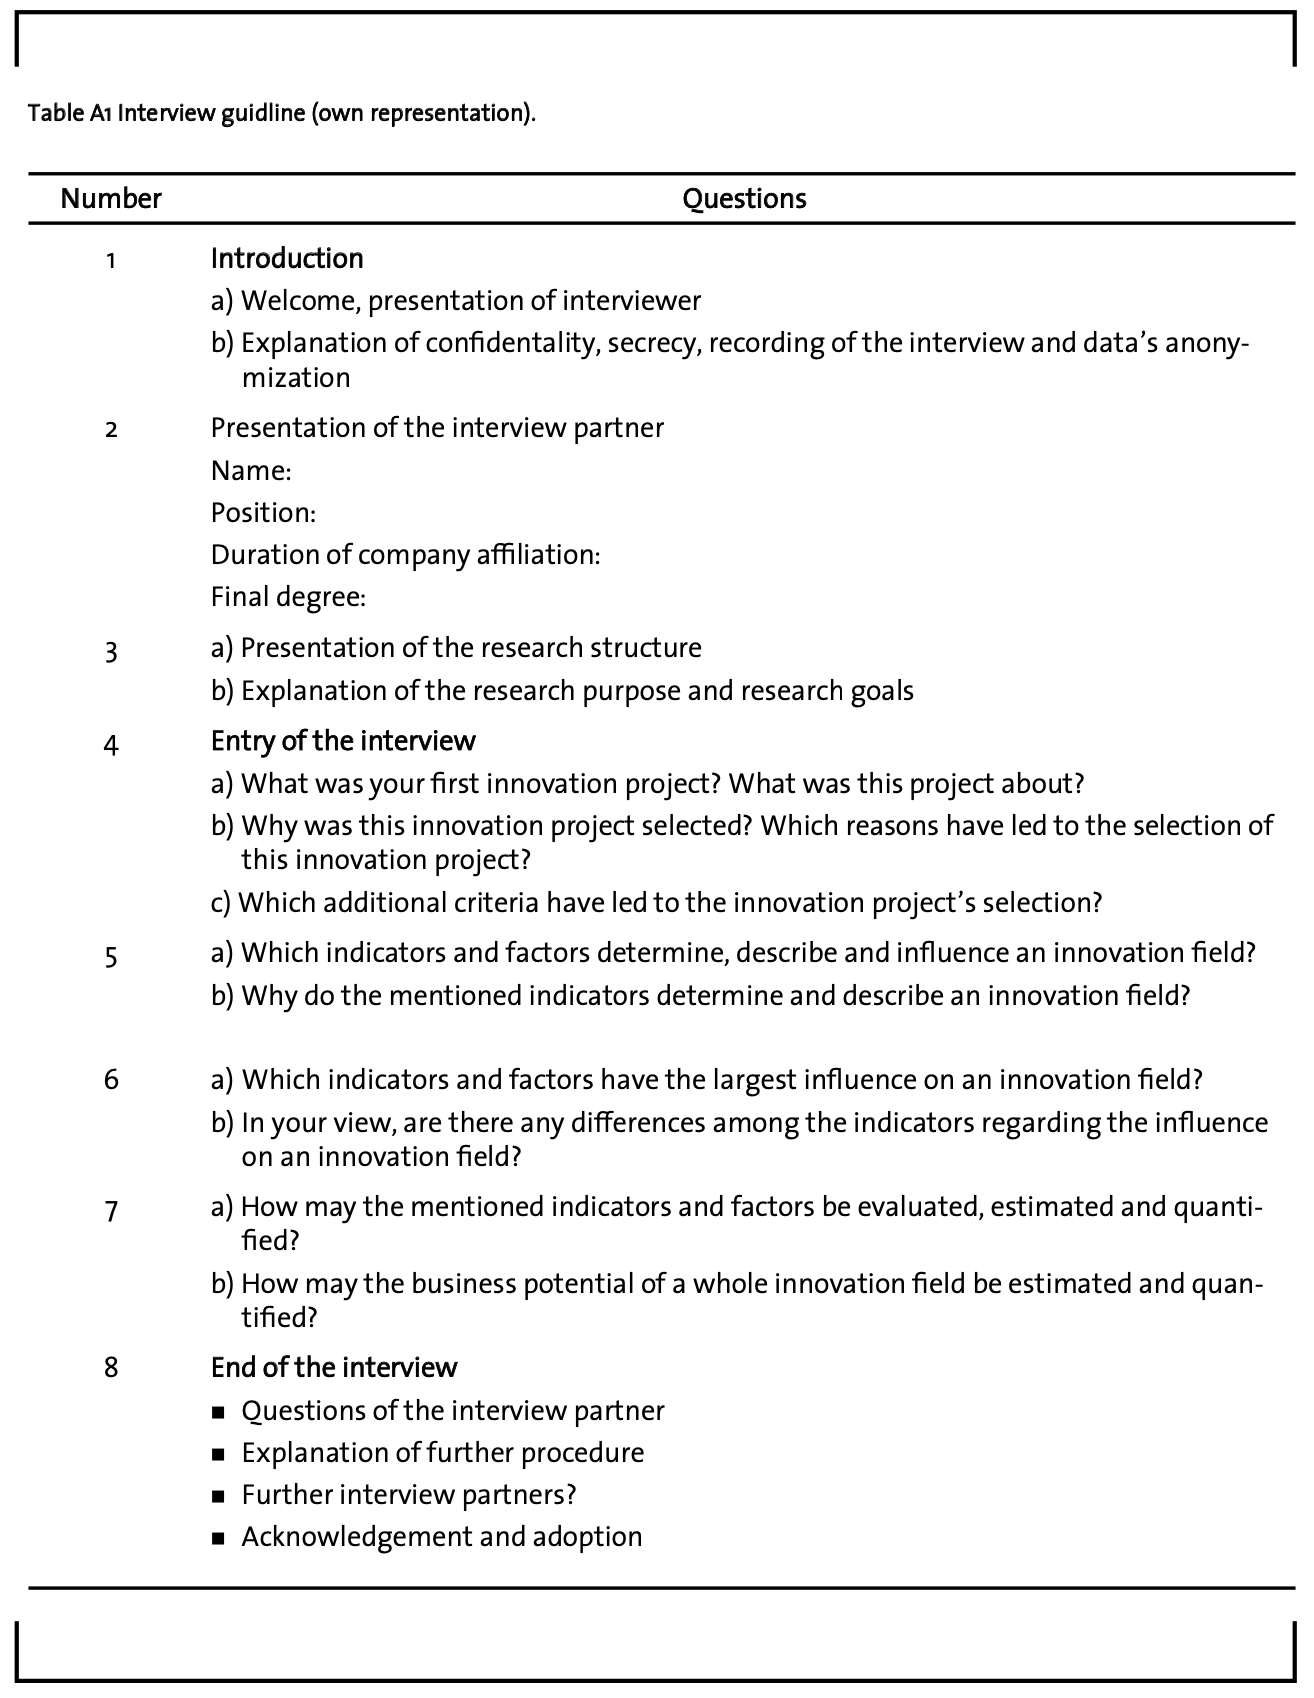
The expert interviews were conducted as systematic, semi-structured expert interviews, in which the experts were regarded as advisers telling a large amount of process and technical knowledge voluntarily to the interviewer (Qu and Dumay, 2011). This interview format enables interviewees to provide responses in their own terms and in the way that they think and use language (Qu and Dumay, 2011). In order to structure the research field’s topic and the interviews themselves, a guideline with a set of pre-defined questions was prepared prior to the interviews. This guideline was utilized to lead through the conversations (Bogner et al., 2014). All experts were asked the same questions and the managers were enabled to answer freely without any restrictions and thus, enabling the interviews to become open, trustful conversations (Qu and Dumay, 2011).
3.2 Quantitative questionnaire survey
3.2.1 Weighting Method
The relevance and the importance of the different indicators mentioned during the expert interviews might differ. Therefore, the mentioned indicators were weighted in order to reflect the preferences of the organization (Henriksen and Traynor, 1999). The distribution of the weights may be used to develop and generate a balanced portfolio of multiple innovation projects that possess the favored and preferred characteristics (Henriksen and Traynor, 1999).
Weighting and determination of the weighting factors was executed with the help of a survey. Project and innovation managers from the company’s strategic innovation unit as well as the interview partners served as respondents. By asking several innovation and product managers, on the one hand, the management is given the possibility to influence the outcome of the methodology and, on the other hand, the acceptance of the developed methodology may be increased (Henriksen and Traynor, 1999).
In the literature, several methodologies to weigh different criteria and to solve multiple criteria decision making (MCDM) are available. These selection methods may vary from unstructured question lists (Cooper et al., 2002), structured scoring models (Henriksen and Traynor, 1999) and anchored scales (Davis et al. 2001), to analytic hierarchy processes (Calantone et al., 1999), simple additive weighting (Afshari et al., 2010) and to mathematical models such as the Conjoint-Analysis (Martinsuo and Poskela, 2011).
In this study, the scoring method described by Henriksen and Traynor (1999) was selected for utilization in order to weight the indicators and clusters which have been identified for the evaluation of the business potential of IFs.
Scoring methods are widely used to weight different attributes and clusters. These methods are simple, flexible and yet quantitative. They are most often used for the evaluation of R&D projects since they are less timeconsuming and require less resources than the other above-mentioned methods. With the help of the scoring method, also non-quantitative criteria may be evaluated by the usage of a constructed ordinal scale for the question responses in the selection process. In addition, the criteria may be customized and selected by the organization in accordance with its strategy and its preferences which shall be emphasized (Henriksen and Traynor, 1999).
One common approach for scoring methods is to rate and evaluate potential projects against a set of criteria (Henriksen and Traynor, 1999). The criteria’s importance is evaluated with the help of an algorithm. By using such an algorithm, the potential projects will receive their final score and may be ranked. Thereby, decisions regarding scarce resources may be facilitated and project managers may evaluate and compare different promising and potential projects or IFs (Henriksen and Traynor, 1999).
3.2.2 Questionnaire design
The mentioned indicators from the expert interviews were summarized in four clusters after the interviews’ analysis (see Chapter 4.1). In the survey, the respondents were asked to distribute 100 points per cluster among the cluster’s indicators with regard to their importance and relevance. The clusters’ relevance for the evaluation of the IF’s future business potential was weighted, too. By the distribution of 100 points among the indicators and clusters in order to weight their relevance for the evaluation of the business potential, the authors followed the weighting technique used by Davis et al. (2001).
The survey was sent to 84 employees from a specialty chemicals company which currently work or have worked within the innovation department. The survey was active for three weeks and a reminder was sent after two weeks. However, unfortunately, the survey was only completed by 45 employees, resulting in a response rate of 54 %. Since the survey was conducted in June, the start of the vacation time and thus, a bad timing as some employees were either very busy or already on vacation could be a reason for the low internal response rate.
4 Results and Discussion
In this section, the identified criteria and clusters determining the business potential of IFs and their relevance are presented. The equation for the calculation of the Innovation Field Impact Factor (IFIF) is deduced and the heat map, in which the business potential is classified, is depicted. In addition, the applicability of the methodology is demonstrated in eleven innovation opportunities.
4.1 Identified criteria
In total, the 35 expert interviews yielded in 337 indicators which have been reduced to 76 single indicators after doublets were eliminated.
These indicators were carefully analyzed, categorized and summarized into four clusters: Technology, Market, Resources and Organization. The categorization into these four clusters is also advised and suggested by researchers and is beneficial for the future business potential of the promising innovations which will defend the company’s competitiveness (Calantone et al., 1999; Carbonell-Foulquié et al., 2004; Englund and Graham, 1999; Hart et al., 2003; Martinsuo and Poskela, 2011; Montoya-Weiss and O’Driscoll, 2000). According to Martinsuo and Poskela (2011), Hart et al. (2003) and Carbonell-Foulquié et al. (2004) it is important to evaluate innovations in the FEI on the basis of several different criteria. Furthermore, these authors demonstrated in their research that the technical feasibility, market criteria, the market size and the strategic fit are very important for future business potential and are the most frequently used criteria in the FFE (Carbonell-Foulquié et al., 2004; Hart et al., 2003; Martinsuo and Poskela, 2011). The reason for the high relevance of technical and market criteria is that market and technical conditions are the main uncertainties in product innovation (Kleinschmidt and Cooper, 1991; Martinsuo and Poskela, 2011).
Obviously, not all of these indicators could have been considered and implemented in the final methodology, since its purpose is a quick and simple application after the collection of information about the intended IF during idea generation. Thus, the amount of indicators, which need to be determined and investigated, was reduced to meet the methodology’s purpose.
After screening and evaluation of the 76 indicators, 24 were considered to be relevant for the utilization. A list of these relevant indicators is shown in Table 1.
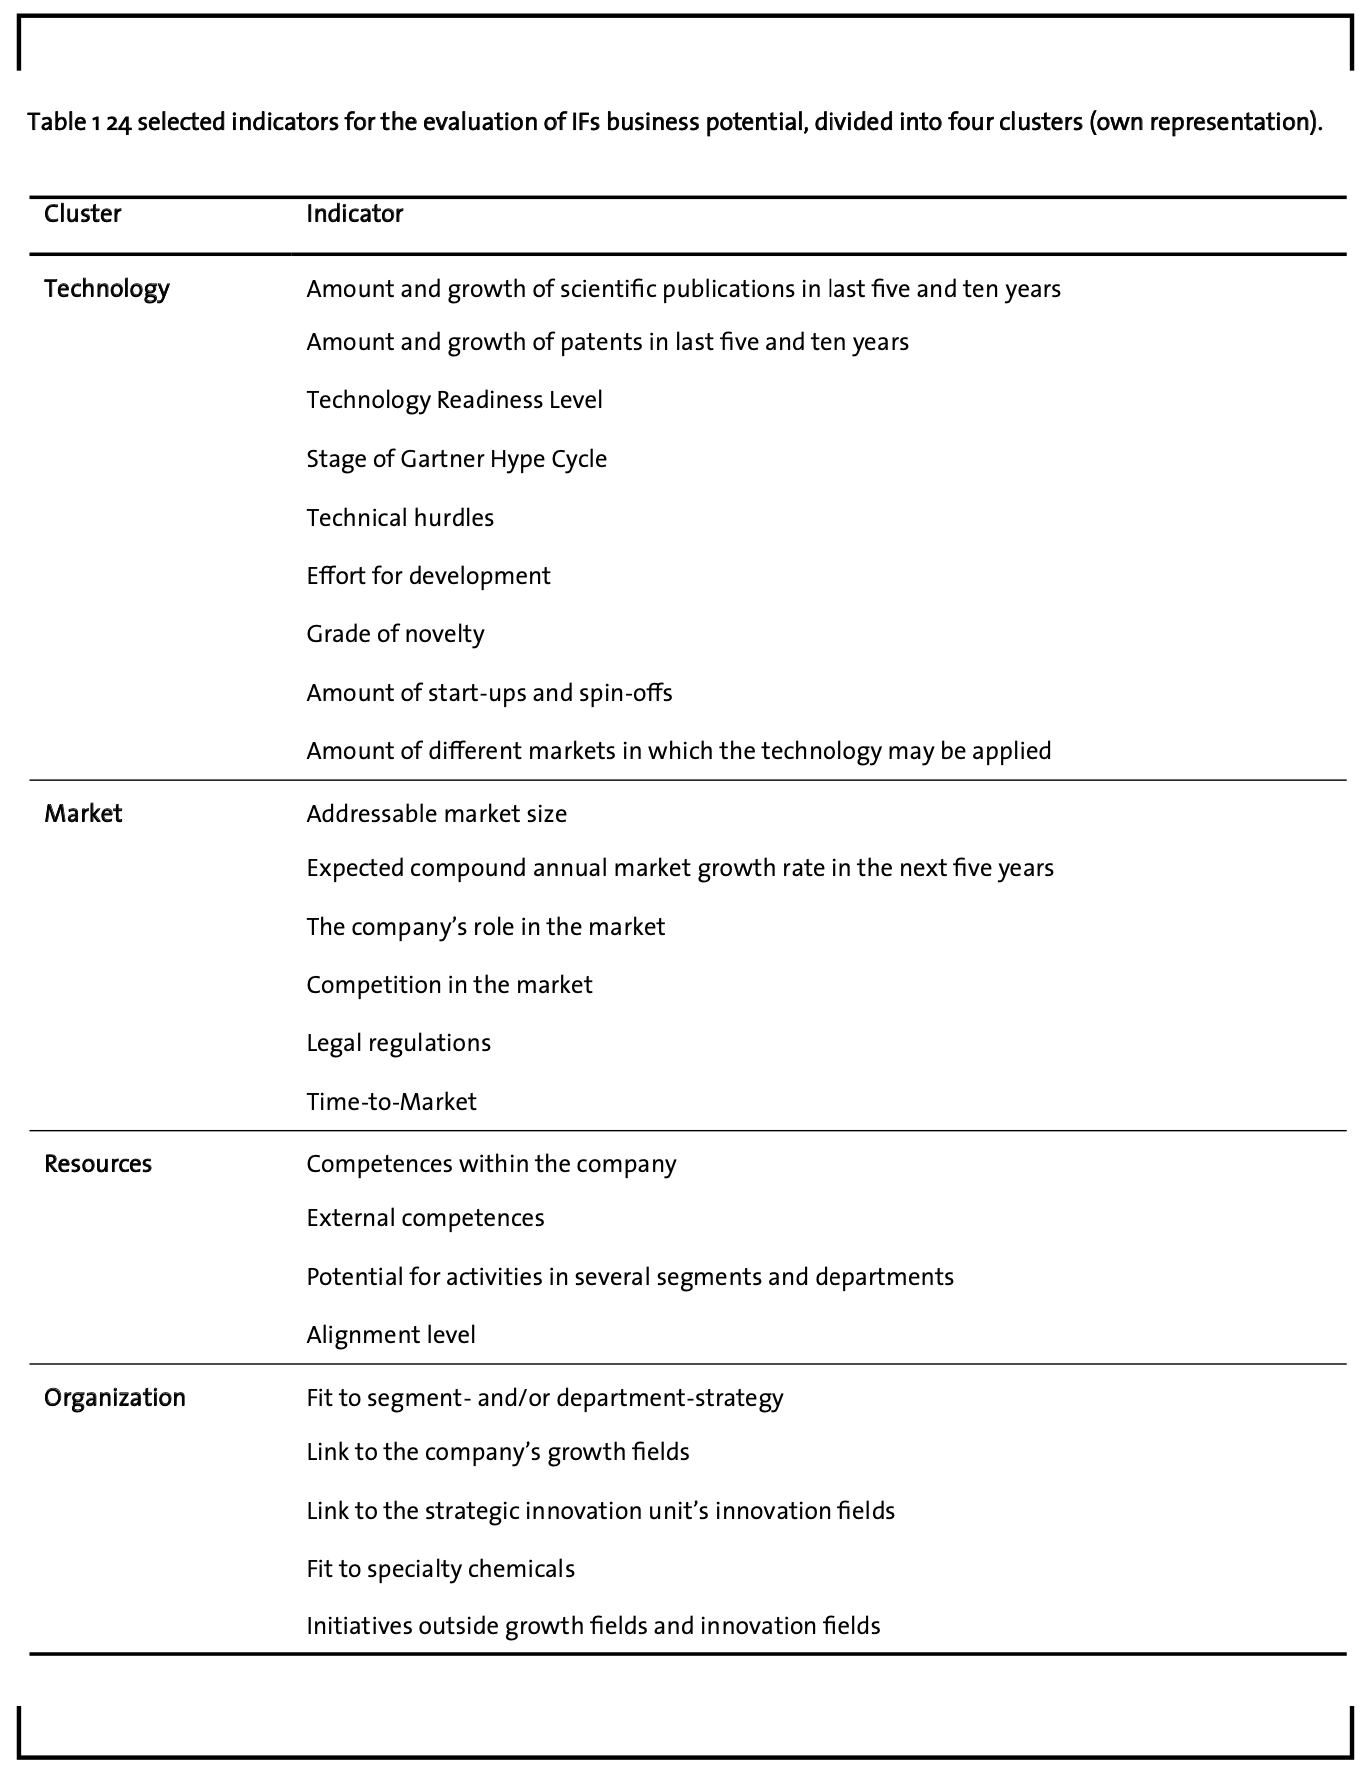
Due to the fact that the interviews have been conducted in a specialty chemicals company, the indicators summarized in the cluster Organization are clearly focused on the specialty chemicals company. However, all 24 indicators build up a strong basis for the determination and evaluation of the business potential. The identified indicators may be worth to consider for practitioners dealing with IFs – especially in the specialty chemicals and chemicals industry, but also in other industries and branches.
4.2 Determination of weighting factors
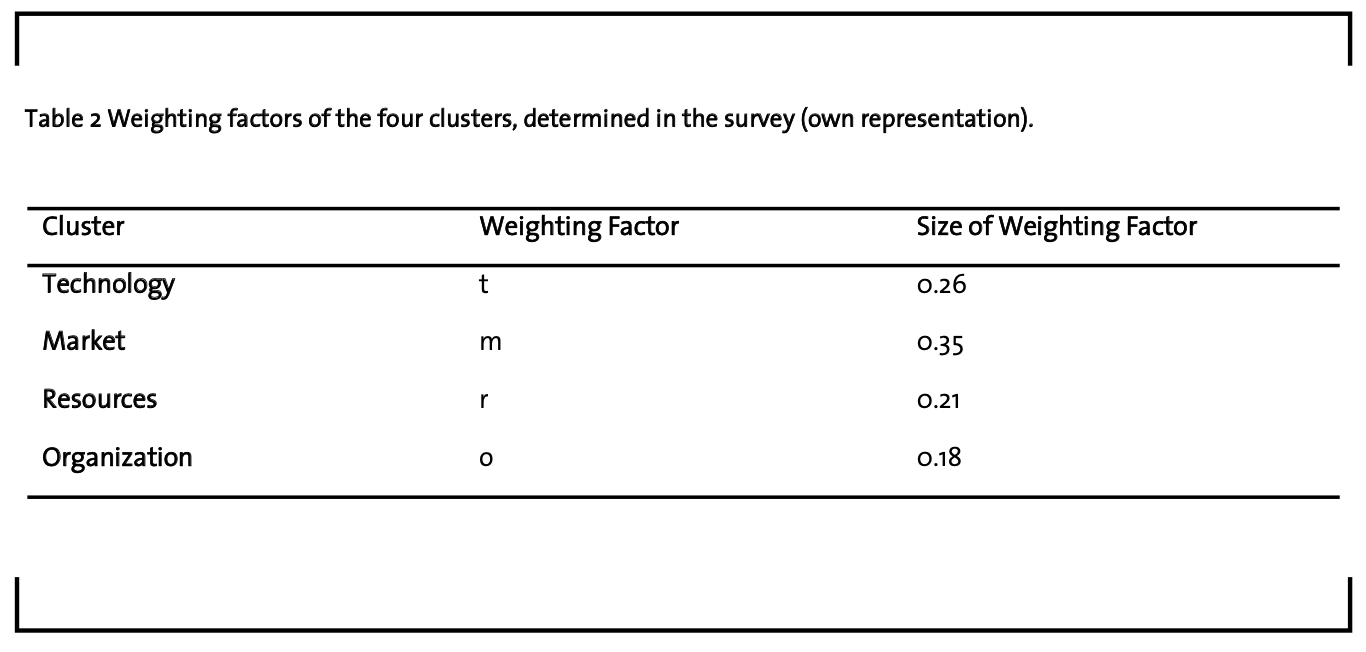
In the survey, the cluster Market was weighted from the respondents as the most relevant cluster (0.35). In the view of the respondents, the second most important cluster is Technology (0.26) followed by Resources (0.21) and Organization (0.18). As a result, one may notice that in the view of the respondents, all clusters are important and relevant for the business potential of IFs and that there is no strongly dominating cluster. Nevertheless the respondents have a market-orientated focus.
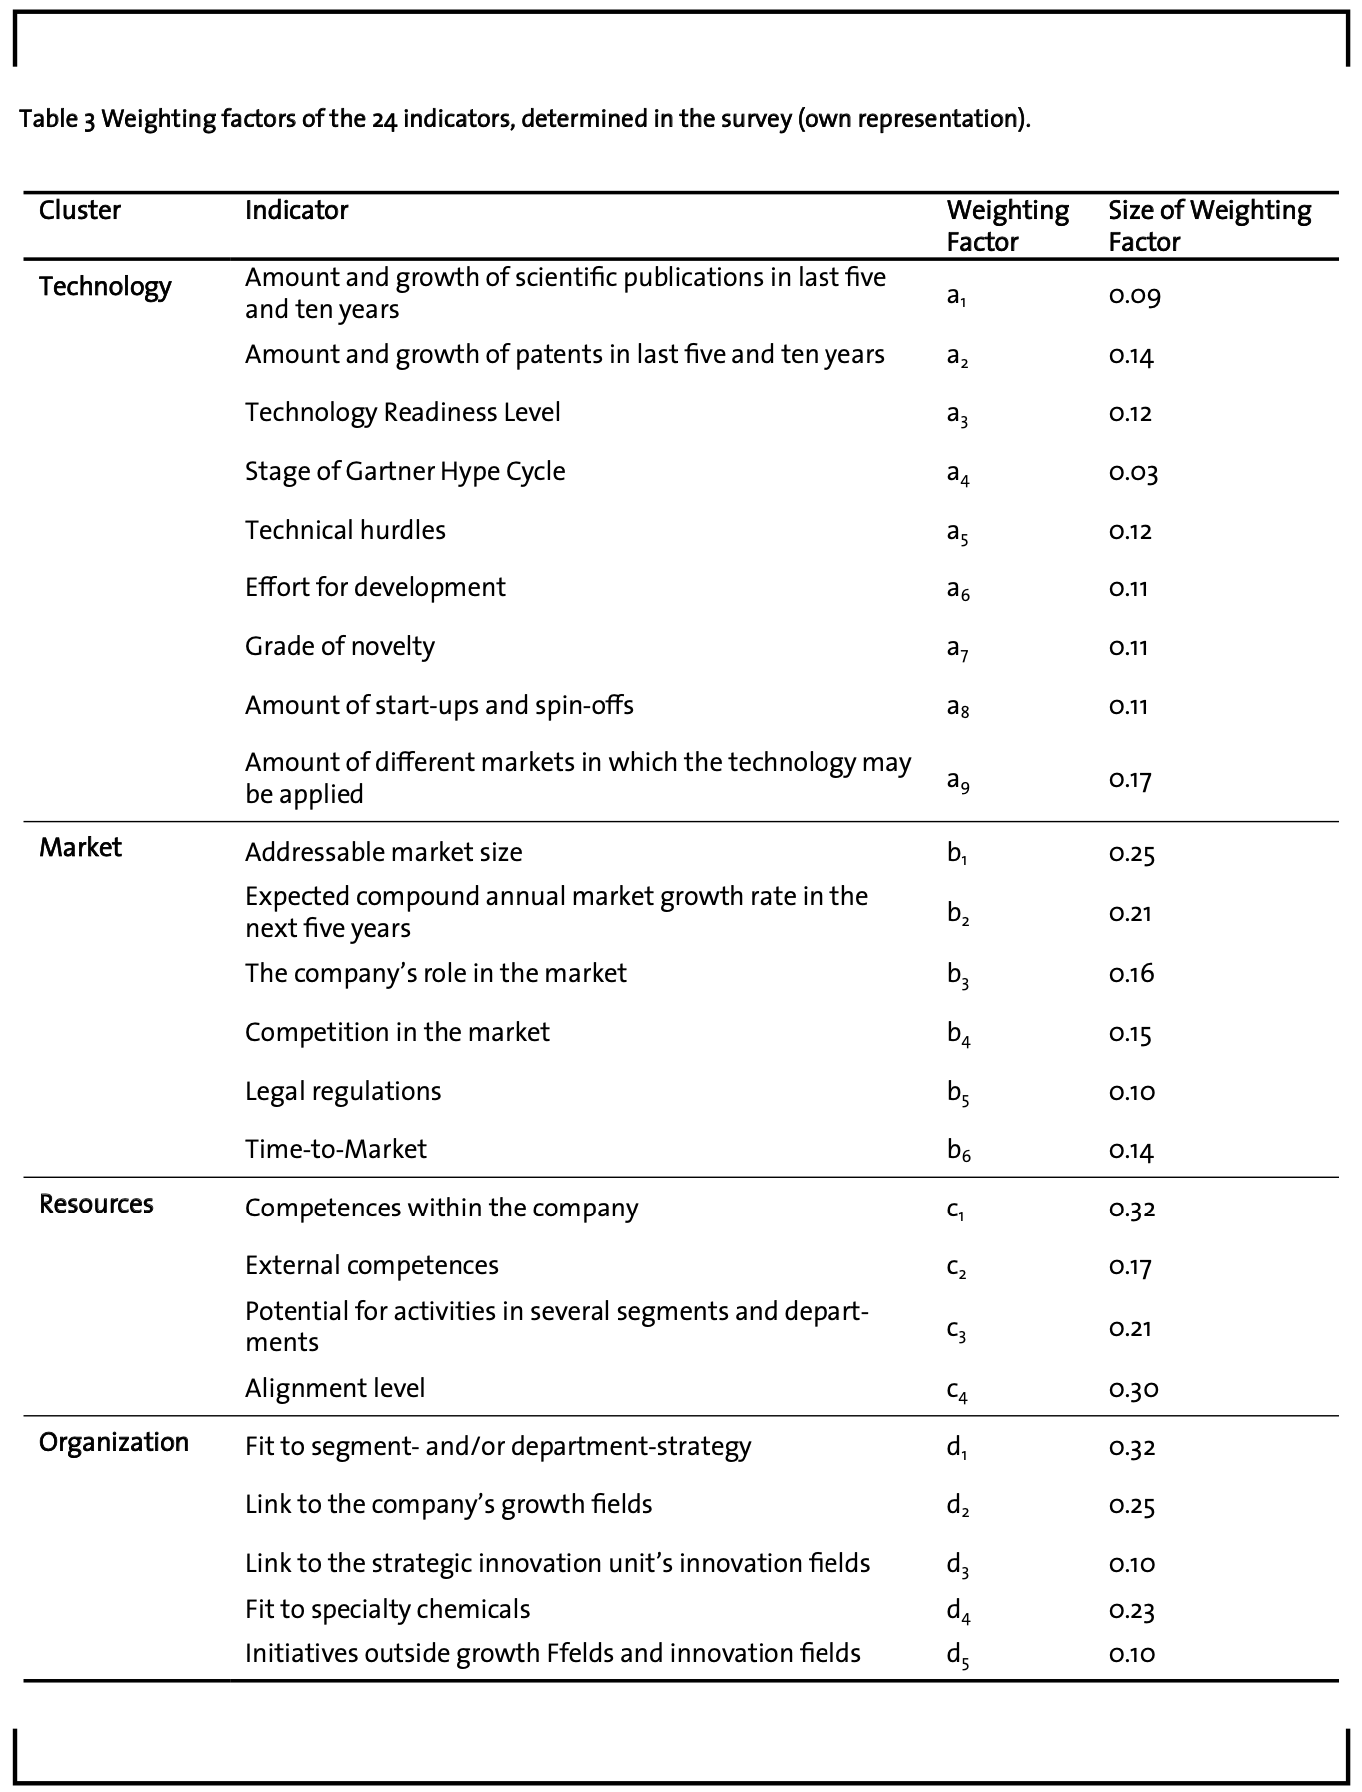
In addition, in the survey, the respondents also had to weigh the indicators of the four clusters. The indicators “Amount of markets in which the technology may be applied” (Technology), “Addressable market size” and “Expected compound annual market growth rate in the next five years” (Market), “Competences within the specialty chemicals company and the alignment level” (Resources) and “Fit to the Segmentand/or Department-Strategy” (Organization) were considered as most important. The results of this survey may be found in Tables 2 and 3.
Since the amount of the survey’s respondents is below 50 (only 45 respondents), the results of the survey are statistically not representative and need to be regarded with caution. In addition, it needs to be considered that the survey was only sent to employees working in Germany and for this reason, the results from the survey must not inevitably represent the opinion of the whole company. Essentially, it needs to be emphasized that the data and the results of the survey only represent the views and the opinions of a group of innovation managers.
Nevertheless, the data enable interesting insights into the opinions and views of the innovation managers working at the specialty chemicals company. Therefore, these data were utilized for the development of the methodology to evaluate the future business potential of IFs.
4.3 Innovation Field Impact Factor
After the execution of the survey, in which the identified indicators and clusters have been weighted, the final score for the evaluation of the future business potential of IFs can be calculated. This score is called Innovation Field Impact Factor (IFIF). The calculation of the IFIF follows the following formula:

The values T, M, R and O are the individual Impact Factors of the clusters Technology (T), Market (M), Resources (R) and Organization (O). The exponents t, m, r and o are the weighting factors of the four clusters, which have been determined in the survey.
The IFIF is a factor, which has not been published so far in the literature and which has been created, developed and introduced in this research. This factor is a core factor of this evaluation methodology, by which the objective business potential of future innovation fields is determined on the basis of 24 indicators summarized in four clusters.
In order to determine the Impact Factors of the four clusters Technology, Market, Resources and Organization (T, M, R, O), the methodology and the algorithm from Henriksen and Traynor (1999) are applied. These algorithms may be found in the equations 4.2 to 4.5.

When completing the methodology after having executed the initial research about the potential IF, the project manager will need to specify and select values, numbers and estimations in order to answer the questions which are linked to the 24 identified indicators. Depending on the answer given to the specific indicator, a value from a Likert-Scale ranging from 1 to 5 will be assigned to the given answer: Answers with a favoring estimation will get the value 5, weak ones will receive the value 1. The numbers from the Likert-Scale of the indicators in the cluster Technology are the values Tn. The values an symbolize the weighting factors of the individual indicators from the cluster Technology, which have also been determined in the survey. In the other clusters Market (M), Resources (R) and Organization (O), the indicators are evaluated and named accordingly (Mn, Rn, On). Each value of the indicator is then exponentiated with its weighting factor (an, bn, cn, dn).
Since the indicator “Competences within the company” in the cluster Resources contains two questions, which need to be answered and which were not weighted separately, the formula from Henriksen and Traynor (1999) was adjusted for the calculation of the impact factor of the cluster Resources. The final value of the indicator “Competences within the company” is calculated by extracting the square root of the product of both values which need to be answered for this indicator. It was decided, not to calculate the average mean, since extracting the square root has the advantage that small values are more emphasized and thus, have a higher influence on the result in comparison to the average mean. For the calculation of the Resources Impact Factor, the square root is also exponentiated with the weighting factor of the indicator “Competencies within the company”.
The final IFIF results from multiplying the respective impact factors of the four clusters, which are exponentiated by their individual weighting factors (equation 4.1).
4.4 Certainty Factor
As already outlined in chapter 2.2, the FFE is characterized by a high amount of uncertainty regarding the available information. Thus, the information, which is needed to complete the evaluation methodology, may also be neither available nor completely uncertain. Due to the limited amount of available information and the high uncertainty, decisions in the front end are still to a high extent based on the decision maker’s “gut feeling”. Even, if the required information was available, it may be uncertain and decision makers or project managers may not trust this information. Thus, the “gut feeling” may still have an important role.
In order to take into account the high uncertainty about available information, a Certainty Factor (CF) was implemented in the methodology. On the one hand, it should symbolize the uncertainty concerning the gathered and analyzed information about the potential IF and on the other hand, this factor is used to display the “gut feeling” of the project manager working on the IF.
The average CF of the potential IF is based on the individual certainty factors of the four clusters and is calculated according to equation 4.6:
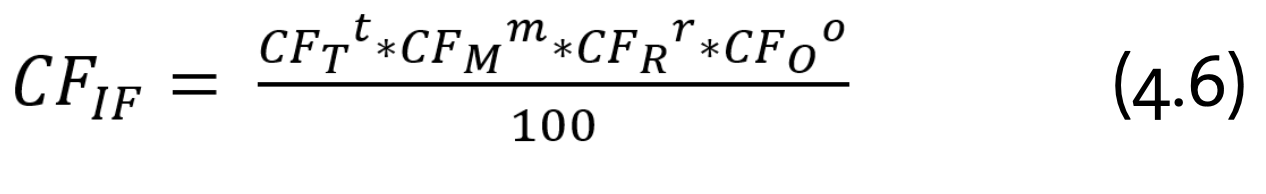
In this formula the weighting factors, and thus the relevance of the clusters, are considered, too.
The formula for the determination of the CF was developed by the utilization and adjustment of the formula for calculating the IFIF (4.1). In the formula determining the CF, the weighting factors, and thus the relevance of the clusters, should be considered, too. Therefore, the clusters’ certainty factors were exponentiated with the determined weighting factors. The certainty factors for the individual clusters are not determined in an objective process. The values ranging from 0 (high uncertainty) to 1 (low uncertainty) are estimated by the innovation manager on the basis of the certainty about the analyzed information and his own “gut feeling”.
Hence, the Certainty Factor of the potential IF offers the possibility to include a personal, subjective opinion by considering the personal view and the “gut feeling” in the structured process of the determination of the IF’s business potential.
4.5 Innovation Field Heat Map
In order to simplify the analysis of the future business potential, the final business potential is visualized in a heat map. In the following, the design and the methodology’s application on eleven intended IFs is demonstrated.
4.5.1 Design
Within this research, two factors which affect the business potential have been developed: The IFIF and the CF. The Innovation Field Impact Factor (IFIF) describes the researched information and thus the potential of an IF from an objective perspective. The Certainty Factor (CF) includes a subjective view about the IF. Since both factors are completely independent, it does not make sense to combine both factors in one value or score. Thus, for the determination of the IF’s business potential and for the useful visualization of the IFIF and the CF, both factors are represented in a heat map (Figure 4).
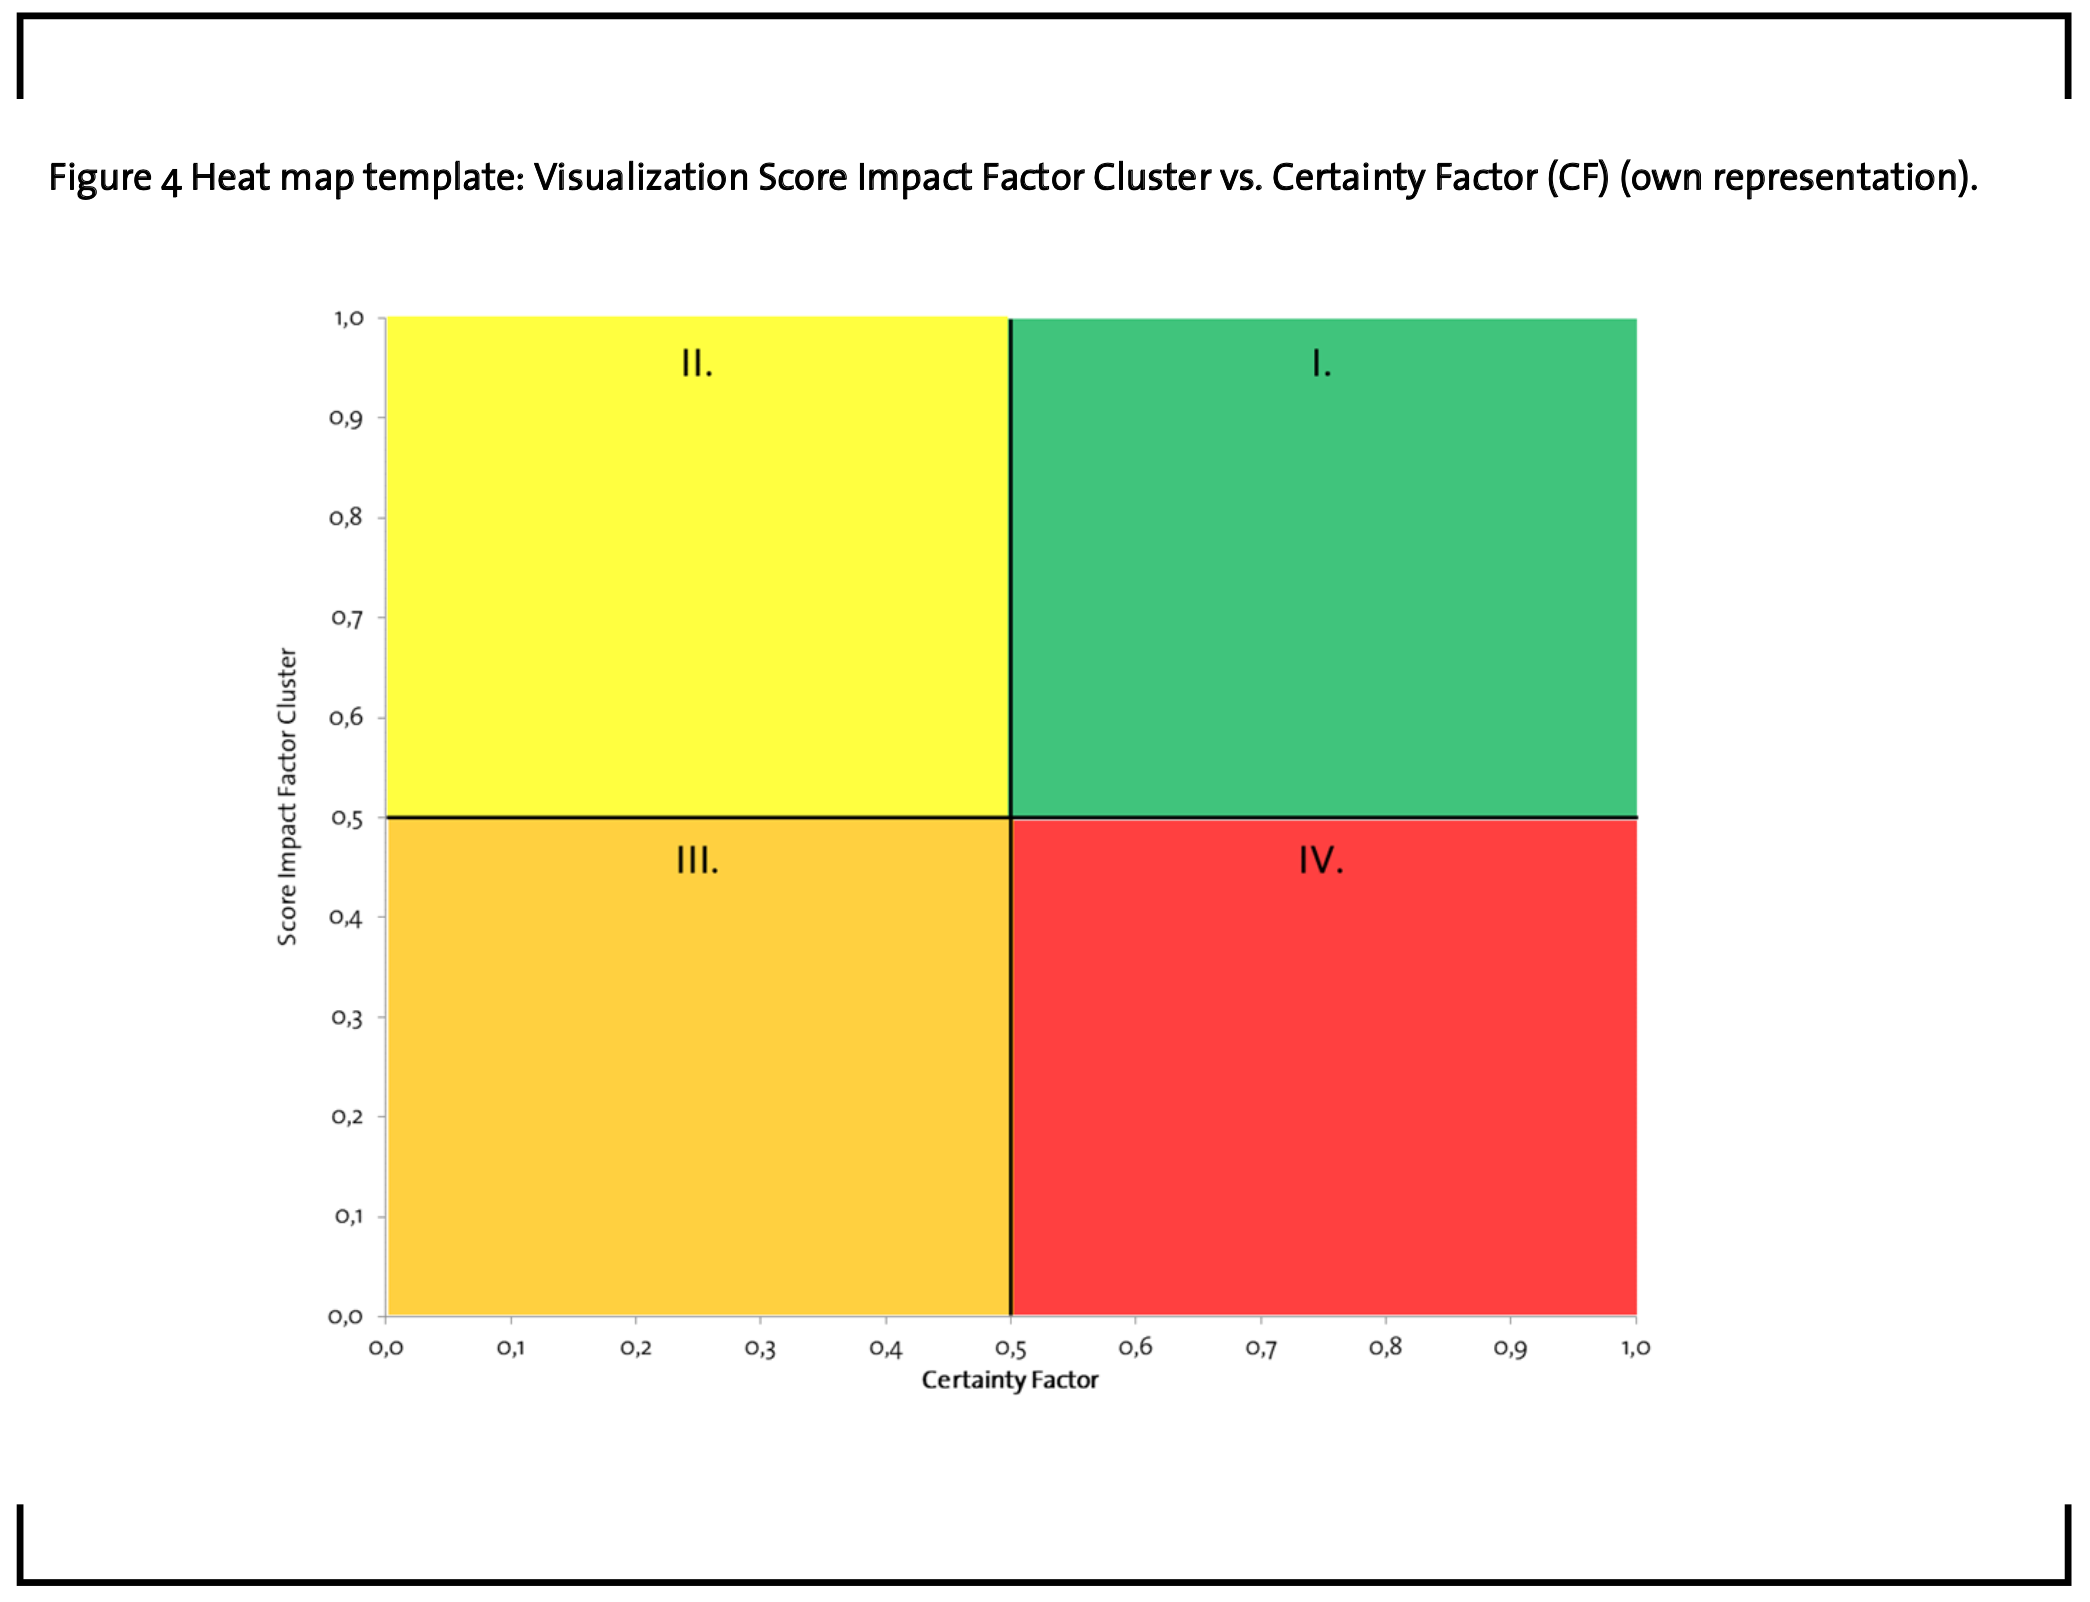
On the heat map’s X-axis, the Certainty Factor (CF) from equation 4.6 is plotted. The values for the CF may range from 0 (completely uncertain) to 1 (very certain). The value of the IFIF (equation 4.1) is marked on the Y-axis. The value of the IFIF may also range from 0 (low potential) to 1 (high potential). The heat map may be used for two purposes:
First, after the methodology has been completed for one specific intended IF, the business potential of each cluster of the innovation opportunity may be depicted in the heat map. Thereby, clusters offering high or low business potentials may be identified and differentiated. Moreover, out of the clusters’ business potentials, the average business potential of the intended IF may be calculated.
Second, by the evaluation of many different innovation opportunities and by the determination of the average business potential of those opportunities, these innovation opportunities may be compared according to their business potential. By directly comparing the business potential of different innovation opportunities in the heat map in the FFE, this evaluation methodology suggests which innovation opportunities might be worth to develop at first. Hereby, the evaluation methodology may support innovation managers in decision-making.
The heat map is divided into four quadrants: Quadrant I (upper right corner), which is depicted in a green color, is most promising. Clusters and innovation opportunities which are classified in this corner seem to offer a high business potential since they have a high impact factor (higher than 0.5) and in addition, the project manager is certain about the collected information (certainty factor higher than 0.5). Thus, potential IFs which are located in this corner should be considered for further development and support since they may lead to successful innovations.
Clusters and innovation opportunities which are classified in quadrant II (upper left corner) are characterized by a high impact factor, but also a low certainty. At the first glance, these clusters and innovation opportunities seem to offer a high business potential, but further research is required to confirm the first estimation.
Quadrant III (lower left corner) shows the business potential of clusters and innovation opportunities which received a small impact factor. But still, this value is very uncertain according to the responsible project manager. The cluster or innovation opportunity remains a “question mark”, since the impact factor may increase with an increasing amount about the information’s certainty and the business potential may even develop towards the quadrant I. Further research is needed for increasing the amount of certainty in order to see in which direction the business potential of the cluster or the innovation opportunity might develop and if a further development seems to be promising.
Clusters and innovation opportunities which are depicted in quadrant IV (lower right corner) only offer a small business potential. The impact factor is low and the project manager is reasonably certain about the values. Thus, this cluster or innovation opportunity is not promising and may include weaknesses. Therefore, this innovation opportunity should be terminated since it only offers small business potential, according to the IFIF and the manager’s estimation about the certainty.
The four quadrants are separated from each other at an impact factor and a certainty factor of 0.5. The separation of the quadrants at these values is a guideline and 0.5 was selected as a reference value. If the heat map shall be applied in other branches and industries or for other models, the value where the quadrants are separated from each other, might be adjusted.
It needs to be emphasized that the developed methodology described above is just an evaluation methodology. It is only suitable for the evaluation of the business potential of clusters and potential IFs. The results depicted in the heat map may only give a first indication about the business potential. Thus, the heat map and the indicated business potentials may only be considered as an advice and support for the project managers. The methodology is not a selection methodology and no potential IF should be selected or terminated on the single basis of the heat map. Even innovation opportunities in the green area may be terminated just as the ones in the red area may be further supported if the project manager decides in this way.
Nevertheless, the visualization of the business potentials in the heat map might be helpful for practitioners and may be a valuable contribution to the literature since it shows a simple and quick methodology to evaluate the business potential of IFs.
4.5.2 Application
After the completion of the developed methodology, its suitability and applicability was tested and determined. For this reason, innovation managers from the company’s strategic innovation unit determined the business potential for innovation opportunities which have already been executed or which were just executed at the time during this research. In total, eleven innovation opportunities were evaluated and classified. The results and the values for the opportunities’ evaluation may be found in Table 4.
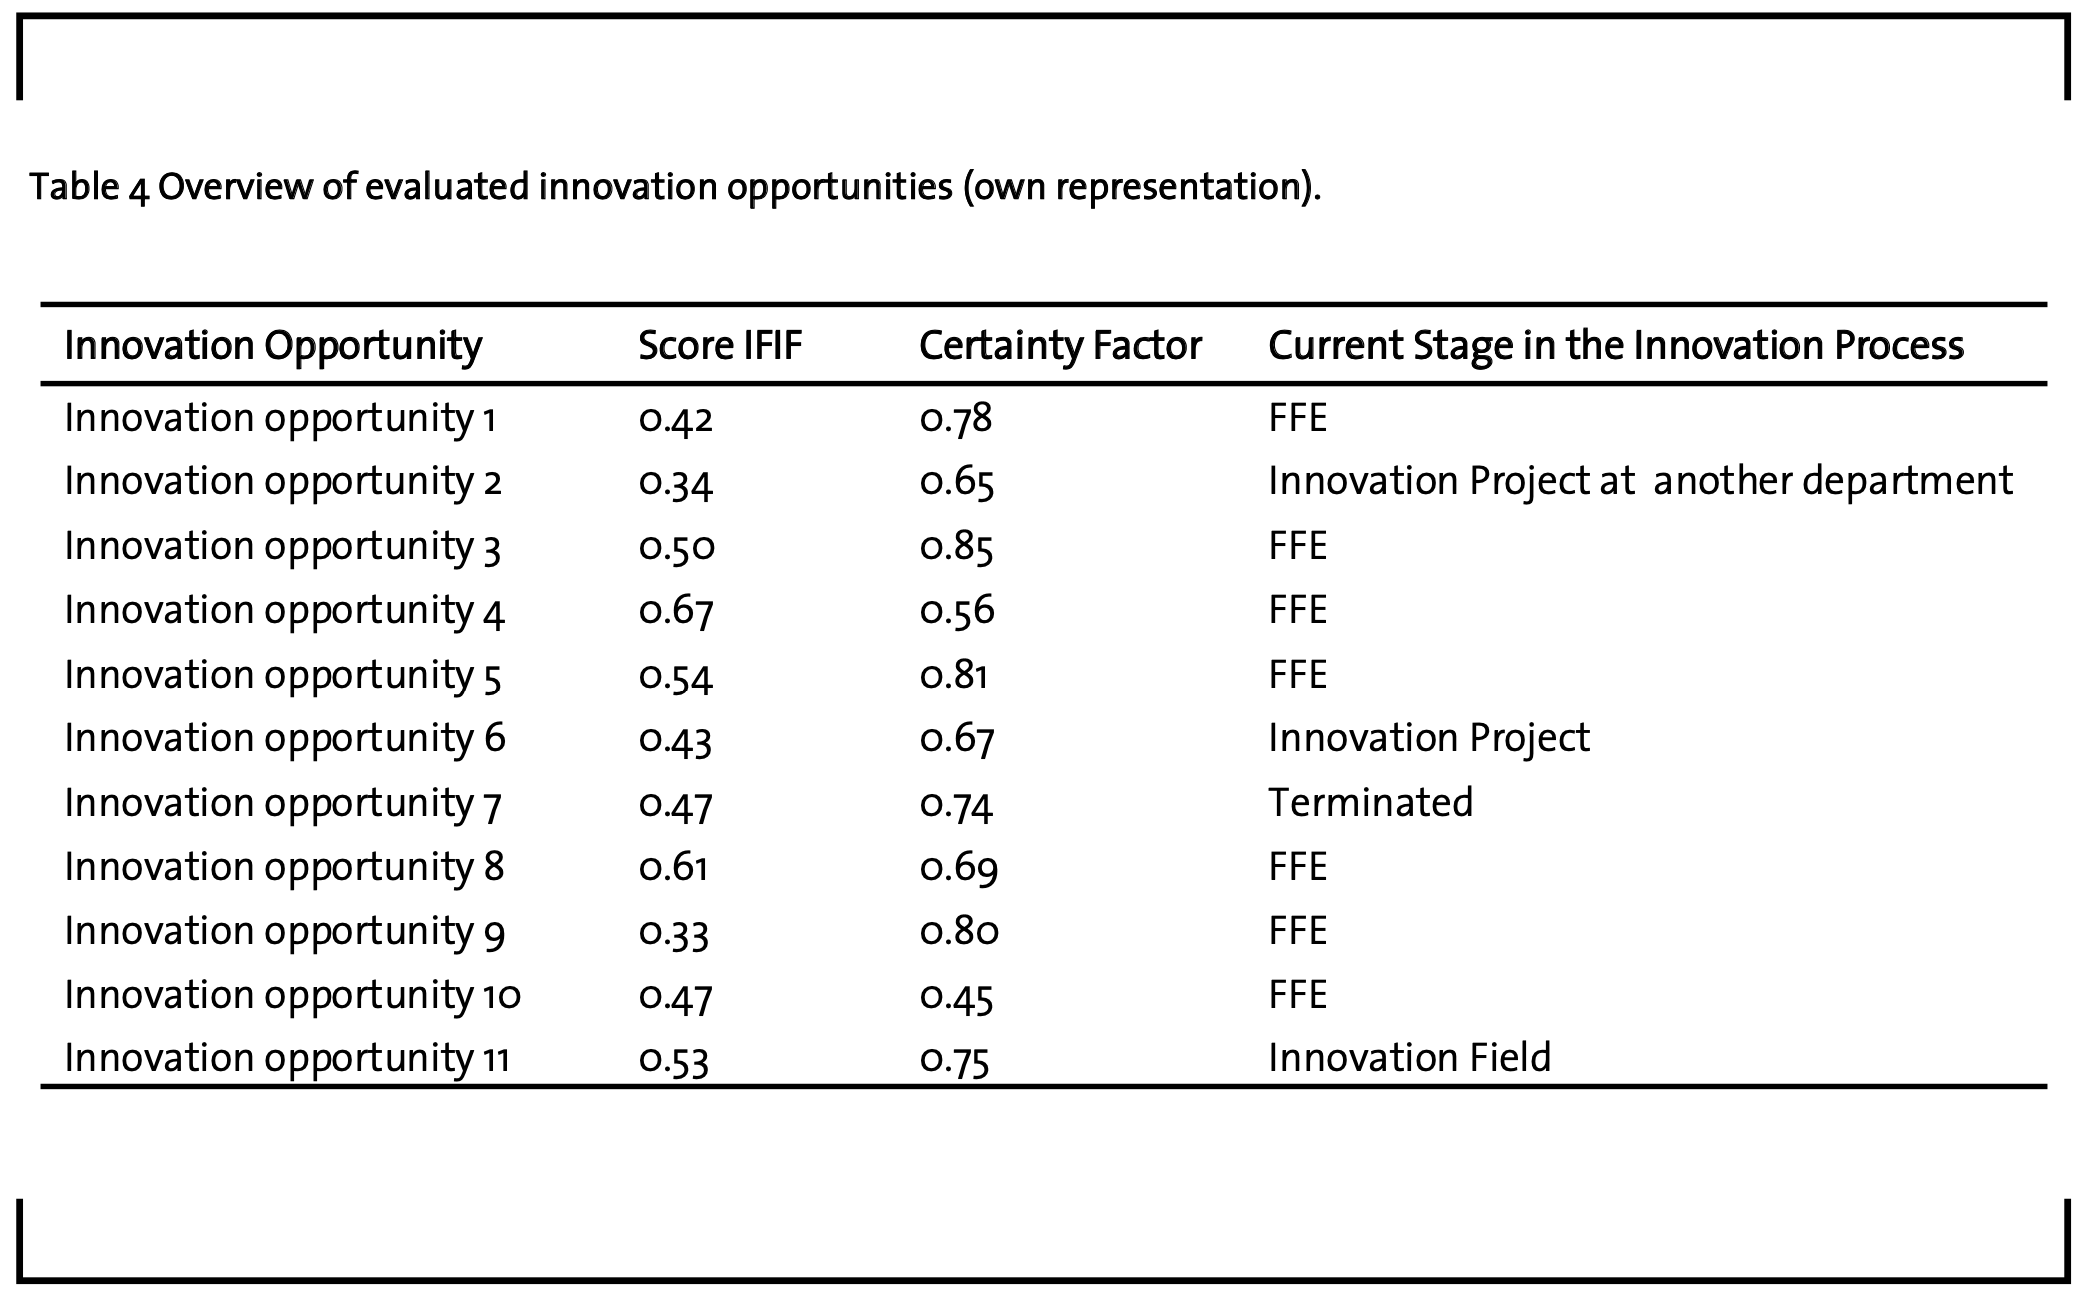
With the help of the methodology, two purposes may be realized: On the one hand, the business potential of the different clusters of one innovation opportunity may be displayed in the Innovation Field heat map. The Innovation Field Heat Map, generated for the innovation opportunity 11 based on the estimation of the project manager, may be found in Figure 5. This innovation opportunity has an IFIF of 0.53 and a CF of 0.75. Thus, the innovation opportunity is classified in the first quadrant of the heat map, symbolizing an advanced business potential. In the heat map, which was generated for this opportunity, the clusters Resources and Organization are very strong and have a high business potential. In contrast, the clusters Market and especially Technology show less business potential and may contain some weaknesses.
After the opportunity’s evaluation, the clusters Technology and Market were further analyzed. However, the opportunity’s weaknesses and uncertainties were not considered as such remarkable that the further development of the innovation opportunity would have needed to be terminated. The innovation manager was aware of the weaknesses and thus, the innovation opportunity had been transformed into an IF.
On the other hand, the average business potentials of multiple innovation opportunities may be calculated. These average business potentials may be displayed and compared in another heat map to evaluate which innovation opportunity might be worth for further development or which one should be prioritized. The results and the classification of the IFs are depicted in Figure 6.
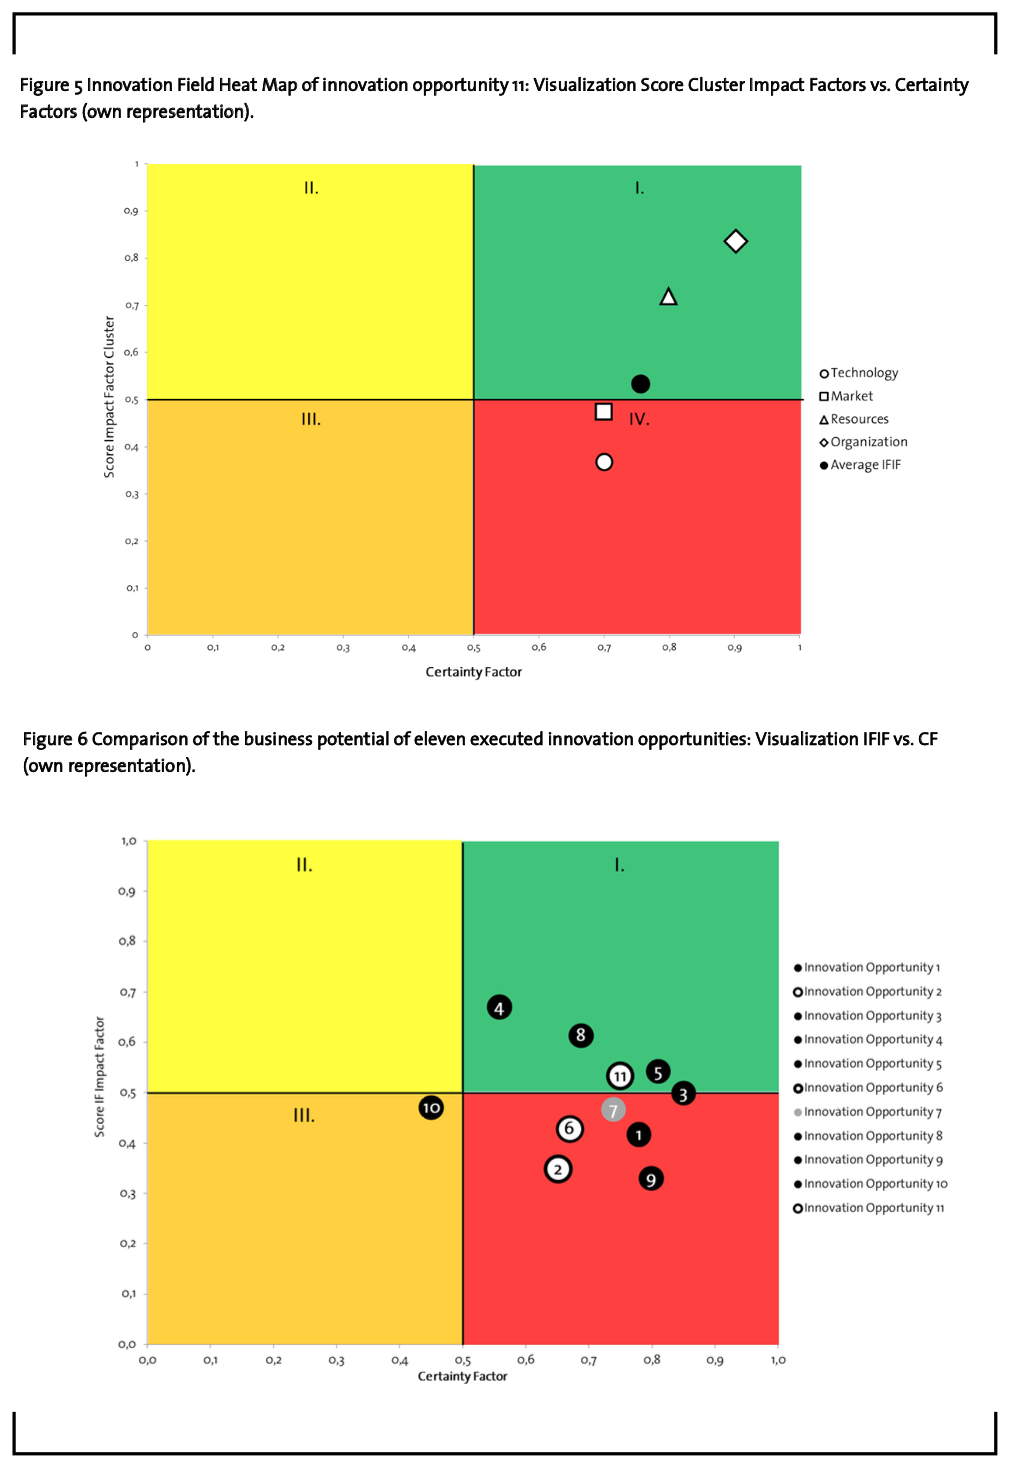
The business potential of the analyzed innovation opportunities is depicted in different colors: black, grey and white. The innovation opportunities colored in black have been evaluated and analyzed in the FFE during the research. The innovation opportunity 11 has now been transformed into a real IF, the innovation opportunity 6 has been transformed into an innovation project and the innovation opportunity 2 has been handed over to the segment. Thus, these opportunities are colored white. The innovation opportunity 7 (grey) has been terminated due to weak market opportunities and a low potential for applications.
It is obvious, that the innovation opportunities 3, 4, 5, 8 and 11 are displayed in the green area (first quadrant of the heat map) which means that they might have a higher business potential and are promising candidates for further development in order to generate and develop successful innovations. Five other innovation opportunities (1, 2, 6, 7 and 9) are classified in the fourth quadrant (red area) signaling only less business potential. The innovation opportunity 10 which is classified in quadrant III, is a “question mark” and thus requires much further analysis before it may be transformed into an IF.
Having applied the methodology to examples from a specialty chemicals company, it becomes clear that there are several innovation opportunities which are classified in the first quadrant and therefore, have enough business potential to be transformed into an IF. The innovation opportunities which are treated and analyzed in the company’s strategic innovation unit mostly contain an IFIF between 0.3 and 0.7 and a CF of 0.5 to 0.9 (except innovation opportunity 10). Thus, it can be concluded that after few weeks of research, the uncertainty regarding the opportunities’ information may be reduced but not completely eliminated, so that the opportunities’ CF is higher than 0.5. As the IFIF of the analyzed innovation opportunities is higher than 0.3, it may be assumed that the opportunities which are developed in the strategic innovation unit contain an advanced level of business potential.
From the results and the classifications of the analyzed innovation opportunities in the heat map, several final conclusions may be drawn:
The business potential of several evaluated innovation opportunities is classified in the green area (Quadrant I). These opportunities may be candidates for further development and transformation into IFs since, as they offer a high business potential.
Innovation opportunities classified in the yellow field (Quadrant II) show less business potential as there is a high uncertainty regarding the good results of the IFIF. In addition, opportunities which are depicted in the orange area (Quadrant III) show less business potential at a first glance, since the IFIF is lower and there is a higher level of uncertainty. But since it is the task of a strategic innovation unit to develop innovations with a higher disruptive potential focusing on new markets and technologies and including a higher level of risk, one might argue that IFs classified in these quadrants are those, which the innovation unit should focus on and should further support. If IFs develop more towards the first quadrant, they might be ready for transfer to other departments or to the operational segments.
When taking decisions about the further proceeding of the innovation opportunities which are classified in the red area (Quadrant IV), these opportunities and especially their weaknesses should be carefully evaluated. Still, if these opportunities might be selected for further development, the introduction of critical assumptions and milestones, which need to be eliminated at first in the next stage of the innovation process, might be reasonable. Critical assumptions are those aspects of an innovation opportunity or a project which are most critical and uncertain. If those assumptions are wrong, the project has a high risk to fail. Therefore, it is the task of the innovation manager to identify critical requirements and thus, determine critical assumptions which need to be verified prior to further development and further spending of resources. If the innovation opportunity is transferred to the next stage of the innovation process, these assumptions must be verified at first, before the field is further investigated. The critical assumptions for this opportunity may be derived from the 24 identified indicators. Thereby, effectivity may be increased and resources might be saved, since innovation managers will at first focus on the execution of the uncertainties and the solution of the critical assumptions.
The results of the evaluation of the already executed innovation opportunities once again reveal that the developed methodology is only designed for evaluation, not for selection: As the examples of the innovation opportunities 2 and 6 reveal, opportunities which are classified in the Quadrant IV. (red area) may not automatically be terminated. Although the opportunities in this quadrant may contain weaknesses and do not seem to have large business potential at first glance, they may still be worth for further development or the transformation into an innovation project or an IF after careful analyzation. Therefore, the methodology may not be taken for final selections. The innovation opportunity 2, only showing less business potential was considered to be relevant by an organizational department, and thus, directly handed over to the department. In addition, the innovation opportunity 6 was transformed into an innovation project as the opportunity was considered to be worth for further development despite its weaknesses.
These examples clearly demonstrate that the intention of this methodology is a simple and quick evaluation of an innovation opportunity’s business potential after a short analysis.
The methodology is not suitable for the final selection of innovation opportunities. Moreover, the methodology is not able to forecast the profitability and the success of the innovation field.
However, it might seem peculiar that no innovation opportunity is classified in the top right corner showing a certainty factor of more than 0.9 and at the same time an impact factor that is close to one. Even the innovation opportunities which have been selected for further development do not reach such values and are classified close to the border of the first and fourth quadrant (green vs. red) or even in the red area.
There may be two interpretations for this phenomenon: On the one hand, after a few weeks of research, there remains a high amount of uncertainty concerning the further development of the innovation opportunity as it is still part of the FFE. Thus, the innovation managers made realistic and responsible estimations concerning the innovation opportunities and showed that after the first screening, uncertainty may not be completely eliminated. For this reason, it is very unlikely to achieve certainty factors higher than 0.9.
On the other hand, when looking at the 24 indicators which need to be completed for the determination of the IFIF, it seems virtually impossible to reach a high value for all indicators. Every innovation opportunity shows weaknesses or medium values for some indicators. Therefore, it is quite hard to find innovation opportunities which receive an IFIF close to one. Consequently, an innovation opportunity which is classified in the very upper right corner may be an ideal state offering a very high business potential. An explanation for this assumption might be that the opportunities and IFs classified in the top right corner could be characterized as rather incremental, since the level of certainty as well as the IFIF are high. As above-mentioned, the analyzed innovation opportunities which have been developed and processed in the strategic innovation unit have an IFIF of 0.3 to 0.7 and a CF higher than 0.4 but not exceeding 0.9. Since it is the unit’s goal to focus and develop more disruptive innovations and IFs, it might be assumed that disruptive innovations and innovation opportunities might have an IFIF between 0.3 and 0.7 and a CF higher than 0.4 and not exceeding 0.9. Thus, the analyzed innovation opportunities due to rather being disruptive than incremental did not reach high CFs exceeding 0.9 and also no IFIF close to 1. Consequently, when having a look at the results of the methodology’s application, promising incremental opportunities might be classified in the top right corner of the heat map, whereas the more disruptive innovation opportunities might contain a lower IFIF and even a lower CF.
The developed methodology may be utilized for two purposes: First of all, by the classification of the business potential of the innovation opportunity’s clusters, weak and strong clusters may be identified. Thereby, the innovation manager may get an indication which clusters need to be focused and especially developed before the opportunity can be transferred to the next stage of the innovation process. Hence, the methodology offers the possibility to speed up the innovation process, since project managers may directly concentrate on the investigation of weak clusters and improve or verify their values. By the execution of iterative cycles and the early focus on the investigation of weak clusters, the methodology offers the application of agile methods in the early stages of the innovation process. The utilization of an agile approach in the management of innovations and projects offers an increased flexibility and speed to the innovation process in order to adapt to changes in the innovation’s environment (Kester et al., 2011; Meyer and Marion, 2010). Companies which use an agile framework may improve the effectivity of their predevelopment and innovation activities (Gonzalez, 2014). Thus, this methodology may lead to iterative processes, which may accelerate the development of IFs, reduce the uncertainties concerned with IFs and develop more effective innovations and IFs.
Secondly, by calculating the innovation opportunity’s average business potential, the innovation manager gets the possibility to compare the analyzed innovation opportunity to other innovation opportunities. Thereby, the methodology may support the innovation manager in the decision which opportunity might be worth for further development and which potential IF should be selected for further support and development at first.
This comparison of different innovation opportunities is very important and useful and might be valuable to departments or groups with scarce resources. By classifying and comparing several innovation opportunities, the opportunity with the highest business potential might be identified and thus, should be further developed. The most promising innovation opportunity can be selected for further development within the innovation process, due to its high potential to generate new successful innovations. The other opportunities are put on hold and will only be further developed if there are further resources available.
5 Conclusion
In this chapter, results of the practical application of the evaluation tools are summarized. Ideas for future research which might be based on this methodology are given in the outlook.
5.1 Summary
In the course of this research, a methodology was developed and applied which enables a quick pre-screening as well as analysis and evaluation of the business potential of potential IFs after only few weeks of research about related topics and literature. Criteria and indicators, which determine the future business potential of IFs were identified in expert interviews. The interviews resulted in 24 individual, relevant indicators, which build a strong basis for the determination of the business potential of IFs in the chemical industry. These indicators were summarized in the four clusters Technology, Market, Resources and Organization.
The importance and the relevance of the indicators’ and clusters’ individual influence on the evaluation of the innovation opportunity’s and IF’s business potential were determined in a survey. In the view of the respondents, the market was weighted to be the most important cluster. The addressable market size, the internal competences, the alignment level and the fit to the segment- or department-strategy were weighted as most relevant indicators.
The business potential of innovation opportunities and IFs may be estimated and evaluated on the basis of objective criteria which are summarized in the Innovation Field Impact Factor (IFIF) and on the basis of the subjective Certainty Factor (CF).
The visualization of the business potential was realized in a heat map. With the help of this visualization, it is possible to identify the business potential of both, the four clusters and the complete innovation opportunity. In addition, it allows a comparison of several intended IFs to select the most promising IF. Evaluation, analysis and classification of certain innovation opportunities within the heat map may give an indication of the opportunity’s business potential and thereby, may support innovation managers in their decision-making.
The developed method was applied by evaluating the business potential of eleven executed and completed innovation opportunities. With the help of the methodology, it was possible to identify weak and strong clusters within the innovation opportunities and to compare the opportunities’ business potential.
Thereby, it became obvious that the developed methodology may only give an indication about the business potential of possible future IFs. It is another basis for decision-making using information on technology, market, required resources, the organization and the analyst’s certainty. The methodology is only a decision guidance and should not be seen as stand-alone solution for final go- or stop-decisions.
This research shows that the developed methodology for the evaluation of IFs is a valuable tool for practitioners innovating in IFs, not only within the chemical industry.
5.2 Outlook
The methodology and the criteria utilized for the evaluation of the business potential of IFs offer the possibility for further investigation and analyses. Besides adjustments in the utilization of the demonstrated methodology, future research might investigate the long-term impact and the consequences, the utilization of the methodology within the strategic innovation unit might offer. It would be interesting to analyze and evaluate the methodology’s influence and the impact on the innovation portfolio. How might the utilization of the evaluation lead to changes within the unit’s innovation portfolio? Which impact might this have for the specialty chemicals company as a whole organization? Does the demonstrated methodology symbolize a competitive advantage for the specialty chemicals company? Following these ideas concerning the methodology’s impact, in case of a successful utilization of the methodology, a comparison of the company’s innovation portfolio and the innovation portfolios of other (specialty) chemical(s) companies might be the core of future research. Future studies might identify if the investigated specialty chemicals company becomes more successful in the development of IFs and commercialization of innovations by using the new evaluation methodology.
References
Afshari, A., Mojahed, M., Yusuff, R. M. (2010): Simple additive weighting approach to personnel selection problem, International Journal of Innovation, Management and Technology, 1 (5), pp. 511–515.
Bogner, A., Littig, B., Menz, W. (2014): Interviews mit Experten: eine praxisorientierte Einführung, Springer, Wiesbaden, pp. 27-48.
Calantone, R. J., Di Benedetto, C.A., Schmidt, J.B. (1999): Using the AHP in New Product Scoring, Journal of Product Innovation Management, 16 (1), pp. 65-76.
Carbonell-Foulquié, P., Munuera-Alemán, J. L., Rodríguez-Escudero, A. I. (2004): Criteria employed for go/no-go decisions when developing successful highly innovative products, Industrial Marketing Management, 33 (4), pp. 307–316.
Cooper, R. G. (1990): Stage-gate systems: A new tool for managing new products, in: Business Horizons, 33 (3), pp. 44–54.
Cooper, R. G., Edgett, S. J., & Kleinschmidt, E. J. (1997): Portfolio management in new product development: Lessons from the leaders—I, Research Technology Management, 40 (5), pp. 1628.
Cooper, R.G., Edgett, S. J., Kleinschmidt, E.J. (1999): New Product Portfolio Management: Practices and Performance, Journal of Product Innovation Management, 16 (4), pp. 333-351.
Cooper, R. G., Edgett, S. J., Kleinschmidt, E. J. (2000): New problems, new solutions: making portfolio management more effective, Research Technology Management, 43 (2), pp. 18– 33.
Cooper, R.G., Edgett, S. J., Kleinschmidt, E. J. (2002): Portfolio Management: Fundamental to New Product Success, The PDMA ToolBook 1 for New Product Development, 9, pp. 331–364.
Cooper, R.G., Edgett, S.J., Kleinschmidt, E.J. (2004): Benchmarking best NPD practices II, Research-Technology Management, 47 (3), pp. 50-59.
Davis, J., Fusfeld, A., Scriven, E., Tritle, G. (2001): Determining a Project’s Probability of Success, Research-Technology Management, 44 (3), pp. 51–57.
Dodgson, M., Hinze, S. (2000): Indicators used to measure the innovation process: defects and possible remedies, Research Evaluation, 9 (2), pp. 101-114.
Edgett, S. J. (2015): Idea to Launch ( Stage-Gate ® ) Model: An Overview, Stage-Gate International, pp. 1–5.
Englund, R.L., Graham, R.J. (1999): From Experience: Linking Projects to Strategy, Journal of Product Innovation Management, 16 (1), pp. 52-64.
Gonzalez, W. (2014): Applying agile project management to predevelopment stages of innovation, International Journal of Innovation and Technology Management, 11 (4), pp. 1–22.
Hagedoorn, J., Cloodt, M. (2003): Measuring innovative performance: Is there an advantage in using multiple indicators?, Research Policy, 32 (8), pp. 1365–1379.
Hart, S., Hultink, E. J., Tzokas, N., Commandeur, H. R. (2003): Industrial Companies’ Evaluation Criteria in New Product Development Gates, Journal of Product Innovation Management, 20 (1), pp. 22–36.
Heising, W. (2012): The integration of ideation and project portfolio management A key factor for sustainable success, International Journal of Project Management, 30 (5), pp. 582– 595.
Henriksen, A. D., Traynor, A. J. (1999): A practical R & D project-selection scoring tool, IEEE Transactions on Engineering Management, 46 (2), pp. 158-170.
Herstatt, C., Verworn, B. (2004): The ‘fuzzy front end’of innovation, Bringing technology and innovation into the boardroom, Palgrave Macmillan, London, pp. 347-372.
Herstatt, C., Verworn, B., Nagahira, A. (2004): Reducing project related uncertainty in the ‘fuzzy front end’ of innovation: a comparison of German and Japanese product innovation projects, in: International Journal of Product Development, 1 (1), pp. 43–65.
Hunt, R., Killen, C. P., Hunt, R. A., & Kleinschmidt, E. J. (2008): Project portfolio management for product innovation, International Journal of Quality & Reliability Management, 25 (1), pp. 24-38.
Kester, L., Griffin, A., Hultink, E. J., Lauche, K. (2011): Exploring Portfolio Decision-Making Processes, Journal of Product Innovation Management, 28 (5), pp. 641–661.
Kester, L., Hultink, E. J., Griffin, A. (2014): An empirical investigation of the antecedents and outcomes of NPD portfolio success, Journal of Product Innovation Management, 31 (6), pp. 1199-1213.
Khurana, A., Rosenthal, S.R. (1998): Towards holistic “front ends” in new product development, Journal of Product Innovation Management, 15 (1), pp. 57-74.
Kim, J., Wilemon, D. (2002): Focusing the fuzzy front-end in new product development, R&D Management, 32 (4), pp. 269–279.
Kleinschmidt, E. J., Cooper, R. G. (1991): The impact of product innovativeness on performance, The Journal of Product Innovation Management, 8 (4), pp. 240–251.
Kock, A., Gemünden, H. G. (2016): Antecedents to Decision-Making Quality and Agility in Innovation Portfolio Management, Journal of Product Innovation Management, 33 (6), pp. 670–686.
Kock, A., Heising, W., Gemünden, H. G. (2015): How ideation portfolio management influences front-end success, Journal of Product Innovation Management, 32 (4), pp. 539–555.
Koen, P., Ajamian, G., Burkart, R., Clamen, A., Davidson, J., Amore, R. D., … Karol, R. (2001): Providing clarity and a common language to the “fuzzy front end”, Research-Technology Management, 44 (2), pp. 46-55.
Martinsuo, M. (2013): Project portfolio management in practice and in context, International Journal of Project Management, 31 (6), pp. 794-803.
Martinsuo, M., Poskela, J. (2011): Use of Evaluation Criteria and Innovation Performance in the Front End of Innovation, Journal of Product Innovation Management, 28 (6), pp. 896–914.
Mathews, S. (2010): Innovation Portfolio Architecture, Research-Technology Management, 53 (6), pp. 30-40.
Mathews, S. (2011): Innovation portfolio architecture Part 2: Attribute selection and valuation, Research-Technology Management, 54 (5), pp. 37-46.
Meifort, A. (2016): Innovation Portfolio Management: A Synthesis and Research Agenda, Creativity and Innovation Management, 25 (2), pp. 251–269.
Meyer, M. H., Marion, T. J. (2010): Innovating for effectiveness: Lessons from design firms, Research Technology Management, 53 (5), pp. 21–28.
Montoya-Weiss, M. M., O’Driscoll, T. M. (2000): From experience: applying performance support technology in the fuzzy front end, Journal of Product Innovation Management, 17 (2), pp. 143-161.
O’Connor, G.C., Ayers, A. D. (2005): Building a Radical Innovation Competency, ResearchTechnology Management, 48 (1), pp. 23–31.
Paulson, A. S., Connor, G. C. O., Robeson, D. (2007): Evaluating radical innovation portfolios, Research-Technology Management, 50 (5), pp. 17–29.
Qu, S. Q., Dumay, J. (2011): The qualitative research interview, Qualitative Research in Accounting and Management, 8 (3), pp. 238–264.
Reid, S. E., De Brentani, U. (2004): The Fuzzy Front End of New Product Development for Discontinuous Innovations: A Theoretical Model, Journal of Product Innovation Management, 21 (3), pp. 170–184.
Salomo, S., Talke, K., Strecker, N. (2008): Innovation Field Orientation and Its Effect on Innovativeness and Firm Performance, Journal of Product Innovation Management, 25 (6), pp. 560-576.
Say, T. E., Fusfeld, A. R., Parish, T. D. (2003): Is your firm’s tech portfolio aligned with its business strategy? Research Technology Management, 46 (1), pp. 32–38.
Talke, K., Salomo, S., Rost, K. (2010): How top management team diversity affects innovativeness and performance via the strategic choice to focus on innovation fields, Research Policy, 39 (7), pp. 907-918.
Verworn, B. (2009): A structural equation model of the impact of the “fuzzy front end” on the success of new product development, Research Policy, 38 (10), pp. 1571–1581.
Verworn, B., Herstatt, C., Nagahira, A. (2008): The fuzzy front end of Japanese new product development projects: Impact on success and differences between incremental and radical projects, R&D Management, 38 (1), pp. 1–19.
Appendix