Morphological Analysis of Technologies using Multidimensional Scaling
Abstract
This study focuses on the applicationofMorphologicalAnalysis to making technology analyses. In this study, Morphological Analysis is used as a framework for applying expert opinion, bibliometrics, text mining, and multidimensional scaling to problem structuring. We describe the method used as well as its application and apply it to a case of portable fuel cell technology. The results demonstrate the practicality of using Morphological Analysis in structuring complex problems and offer an example of its application in assessing the status of technology.
1 Introduction
Different quantitative, semi-quantitative, and qualitative methods have been used to analyze socio-technical change through current state analysis and foresight. An abundance of methods, such as Morphological Analysis (MA), Trend extrapolations, Key technologies analysis, and SWOT, have often been used to elaborate on technological development and to give tools for strategic management decisions. Despite having been suggested early on as a tool for technological analysis (Zwicky, 1969), MA has only been used by a small number of scholars (Popper, 2008).
MA, as explained by Zwicky (1947) and Ayres (1969), has significant value in structuring highly complex problems. As our technological world is becoming more complex, our need for methods that enable us to structure these problems has increased (Van Wyk, 1988). However, as MA has often been used as a purely expert opinion approach, adding an evidence-based component to MA could be valuable, thus broadening the knowledge sources used in the foresight effort (refer to Popper, 2008 for a theoretical framework of foresight knowledge sources). Additionally, although Zwicky elaborated on the method through several studies (1947; 1948a; 1948b; Zwicky and Wilson, 1967) and a few scholars have used the method (Wissema, 1976; Ritchey, 1998; Ritchey, 2006; Ritchey, 2004; Ritchey, 2006; Yoon and Park, 2004), studies validating the applicability of the method is needed (Yoon and Park, 2005).
To address the challenges mentioned above, we have focused on demonstrating the use of evidence-based methods as a part of MA, simultaneously demonstrating a practical application of MA to technical analysis. In this study, we have applied bibliometrics, text mining, and Multidimensional Scaling (MDS) to MA, striving for structure and a more evidence-based approach. Thus, we have significantly broadened the knowledge base compared to a study applying only expert opinion. Using a case study on Fuel Cell (FC) technology, we extended the expert opinion based MA with evidence-based data and statistical analysis. This case study strives to demonstrate the application of MA to a practical problem.
Using the case study, the work elaborates on the methodological possibilities and limitations of MA. Using bibliometric data and expert opinion, we created a valuable dataset for the analysis. MA was used as a methodological approach for data gathering and analysis. The method was able to cross-validate expert opinion findings and bibliometric results, which made the expected result clear to the stakeholders. However, complexities in structuring different complex morphological structures are argued to require computer-aided tools that would be able to better integrate evidence-based data and expert opinion. This might partly explain the limited use of the method.
Our study is structured as follows: Section 2 will present the theoretical background for Morphological Analysis and its historical applications. Section 3 will elaborate on the case study at hand, followed by the application of the method to the case study. Section 4 will discuss the benefits and challenges of the approach, while the final section will conclude the study.
2 Theoretical background
The conceptual background for this study is based on a MA performed for the study. In the MA, expert opinion, bibliometrics, text mining, a co-occurrence matrix and Multidimensional Scaling (MDS) were applied to the structuring of a case study problem. This MA thus forms the theoretical framework for the study.
2.1 Morphological analysis
The background of MA can be traced back to the term morphology,which comes from a classic Greek term referring to the study of shape and form. An extensive discussion of the historical background of the morphologies used in different disciplines exceeds the scope of this study (for a review, refer to Ritchey, 2006). In Zwicky’s work, however, Morphological Analysis was used to study “interrelations among phenomena, concepts, and ideas, whatever their character might be.” (Zwicky, 1969) Zwicky described the approach in a number of papers ranging from case study work on astrophysics (1948a) and rocket propulsion (1947), to more conceptual studies (1948b, 1967) laying the foundation for a wider adoption of MA. In 1969, Ayres described the use of MA in a technological forecasting. According to his work, MA is “A technique for identifying, indexing, counting, and parameterising the collecting of all possible devices to achieve a specified functional capability. The method can be used for identifying and counting all possible means to a given end at any level of abstraction or aggregation.” Elaborating the definition further, Ayres sees Morphological Analysis as a tool to structure and map the space of feasible solutions to a given problem at any abstraction level, weeding out the unfeasible to focus the work on more practical solutions.
Since the 1960’s Morphological Analysis has been tested as a methodological approach in several fields, such as economic and knowledge management (Shurig, 1984; Shurig, 1986; Edwards et al., 2009; Champon and Wilson, 2010; Levin and Barnard, 2008), technological analysis (Foray and Grubler, 1990; Ritchey, 2002; Ritchey, 2006), the last mile problem (Levin, 2011), corporate strategy (Higgins, 1996), product creation in a service (Kim et al., 2008) and in bibliometrics (Yoon and Park, 2004; Yoon andPark, 2005; Yoon and Park, 2007). However, the practical use of MA remains scarcely demonstrated. (Yoon and Park 2005; Popper 2008)
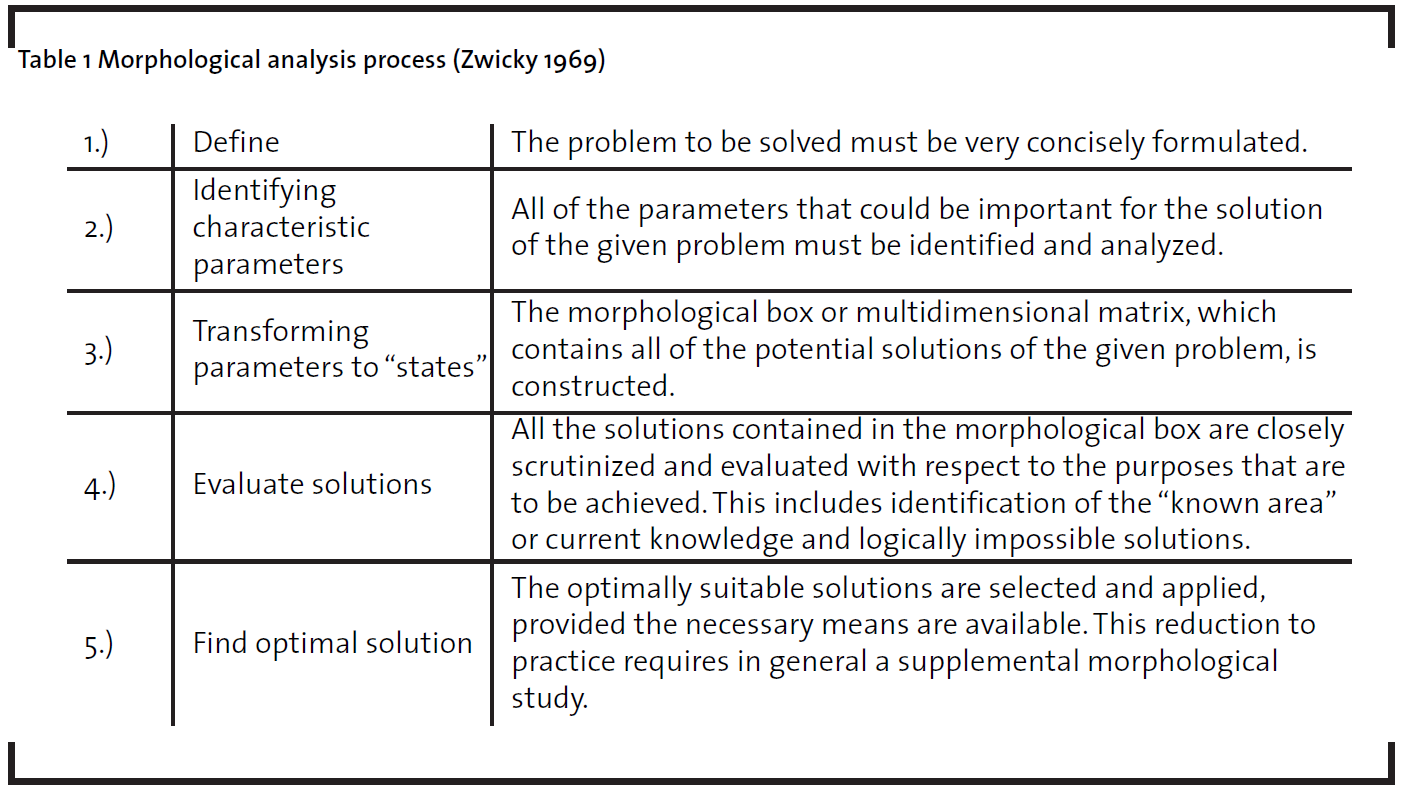
In a more practical approach, Zwicky (1969) summarizes the five steps of the MA process as seen in Table 1. Ayres (1969) and Ritchy (1998) have, based on Zwicky´s work,further elaborated on the process.
Morphological Analysis can be seen as beginning from clearly defining the problem and creating parameters for the characteristics of the problem (Zwicky,1969; Ayres,1969; Ritchy, 1998). These parameters are then assigned a range of relevant conditions or values called states, which are transformed to a morphological box of all possible combinations of states. This can be exemplified using a problem with three parameters: size, weight, and color, which all have three states. This creates 27 possible solutions to the given problem, seen in Figure 1 as a morphological box. This can easily be understood as the elements of a set, which we can define as Set A, containing 27 members.
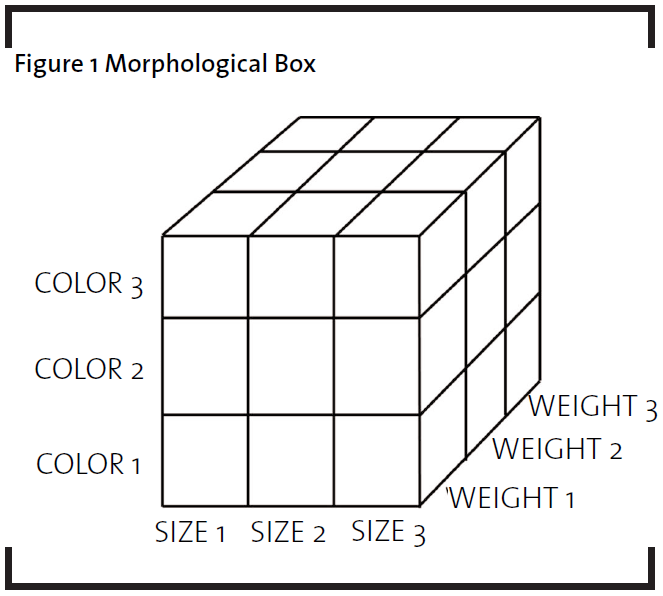
The Morphological box thus presents all of the 27 possible configurations, or potential solutions to the problem. Returning to Zwicky’s original idea that “…nothing can be discarded a priori as being unimportant” (Zwicky 1969) the box shows all of the options not taking to account their feasibility.
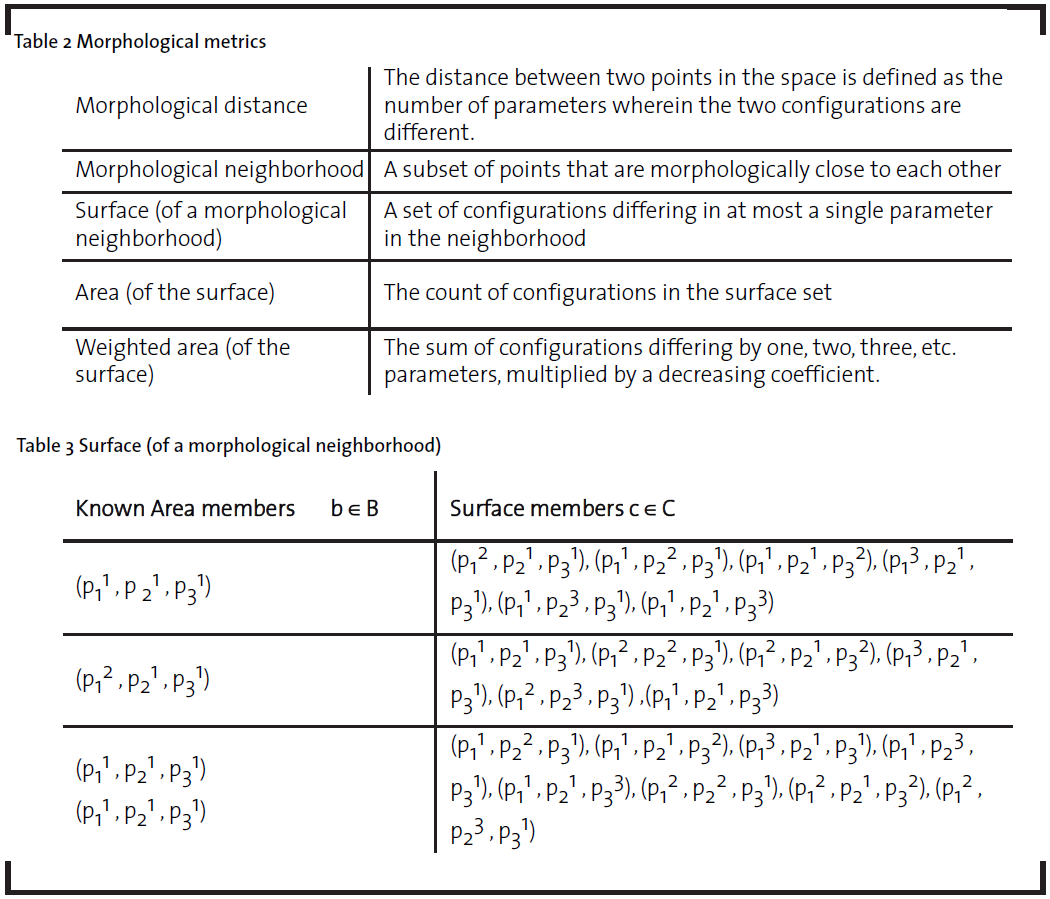
Within the created box, or Morphological space, each parameter is defined by pkj , where k is parameter and j is state, and the space has as many dimensions as there are variables. For the morphological space, Ayres (1969) has described several metrics, seen in Table 2, to further define the problem.
Using the earlier concrete example of a morphological box, we suppose that two configurations are actually developed, these being (p11, p21, p31) and (p12, p21, p31). We can define these as Set B. These developed configurations are described by Ayres (1969) as the “known or occupied” space, arguing that the probability of a technological breakthrough, let’s assume that would be (p13, p22, p31), is a decreasing function of its morphological distance. In the given example, the distance would be two from a maximum of three. Using the example, we can also define the surface of the morphological neighborhood of the known space. We can define these as Set C. Seen in Table 3, Ayres argues that most of the advancements will occur on the surface, or active perimeter, as it is defined.
The surface, in addition to the two known states, forms a perimeter of 10 possible configurations, which forms the “area” defined in Table 2. Although a different sized surface might be feasible by using the weighted area, taking into account the all of the distances and weighing them with a selected coefficient, this possibility has been excluded from this study due to difficulties in defining a suitable coefficient. After this we are left, in the practical example, with an additional 15 variations as unknown or “Terra incognita”. Using the Set analogy we then define B⊂A, C⊂A. This defines Set D (Terra incognita) as A∖(B∪C).
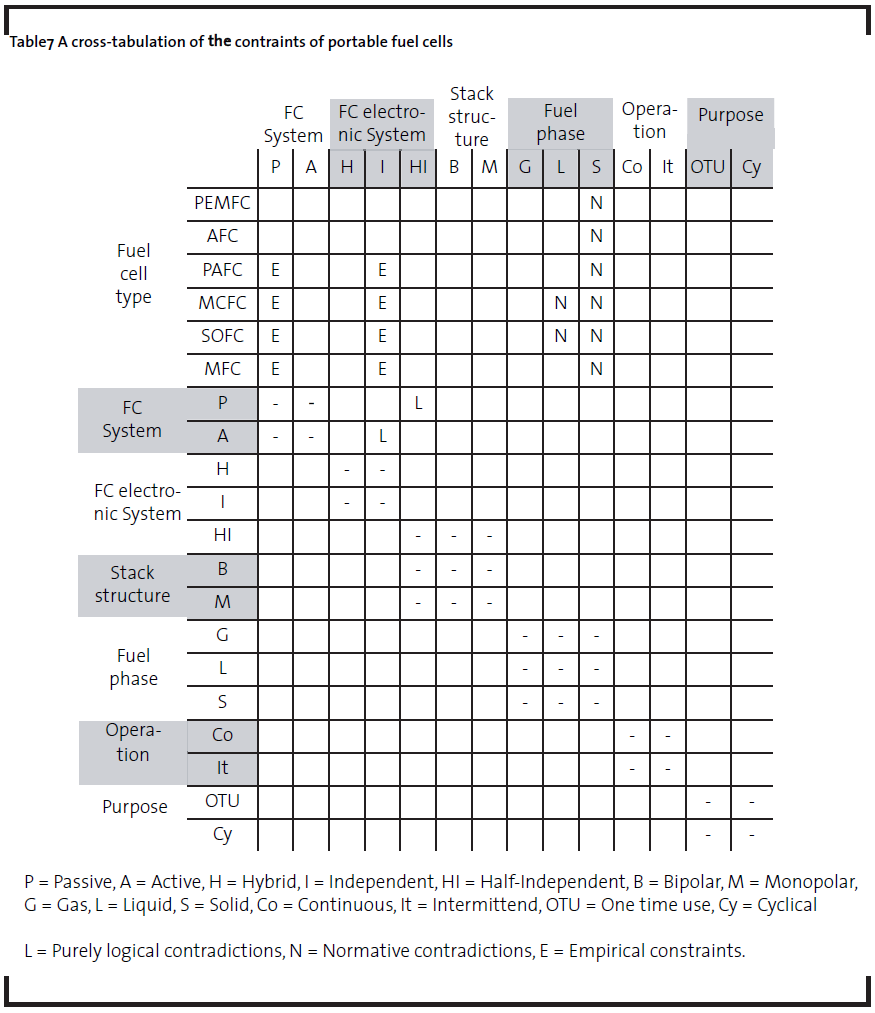
In addition to the aforementioned definitions, Ritchey (1998) states that unfeasible solutions may be included in the group of untested solutions. He argues that there are three types of unfeasible solutions: 1) purely logical contradictions, 2) normative contradictions and 3) empirical constraints. Ritchey (1998) states that logical contradictions are those based purely on the nature of the concepts being evaluated. Normative contradictions, on the other hand, are based on outside influence such as politics or ethics. Empirical constraints are those that are, with current knowledge, seen as improbable or implausible.
A process of cross-consistency assessment is achieved through a screening process, which was also used by Ritchey. All of the parameter values are compared with each other as a crossimpact matrix. Analyzing each pair of conditions, a judgment has to be made on whether a pair can coexist. The technique of using pair-wise consistency relationships between conditions, in order to weed out internally contradictory configurations, is made possible by a principle of dimensionality inherent in the morphological approach.
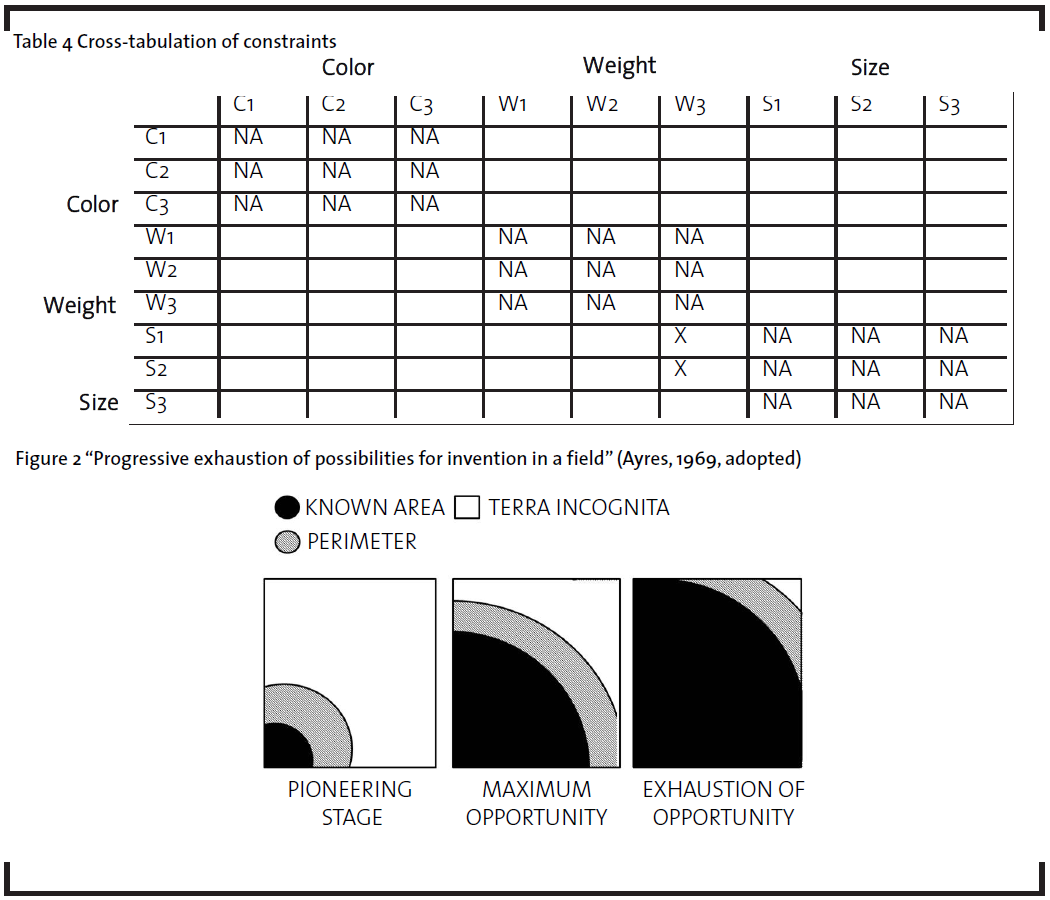
In our simple example we defined a constraint restricting certain weight – size combinations, marked in Table 4 with “X”, making combinations (p11, p2j ,p33) and (p12, p2j, p33) impossible. For this, F is F⊂A. Considering these constraints, Set F is formed by 6 members.
The conceptualization of “progressive exhaustion of possibilities for invention in a field” (Ayres, 1969) seen in Figure 2 exemplifies the practicality of approaching a problem using MA. MA, with a systematic and practical approach, enables a researcher to analyze a technology by categorizing what is known, how that could lead to different incremental advancements (surface), and where we can expect to find radical solutions (Terra Incognita).
Ayres claims that “…it is possible to construct a morphological space for any well-defined technology…” and further argues that the process is relatively straightforward up to the point of creating the known area. However, the process becomes more challenging when the known area and perimeter remain small. In this study, we have created the known area utilizing expert opinion and then evaluated the results using bibliometric data analyzed through text mining and MDS.
2.2 Methodological approach
2.2.1 Expert opinion
Expert opinion was used to define the problem area in the case study. With expert opinion we aimed to define the problem to be structured with MA. In addition, we used it to identify characteristic parameters and to transform parameters to “states”.We used expert opinion as a guideline to define the parameters that were of interest regarding the problem and then listed each of the states of the parameters. The result was a table of words with their interconnections, which suggested possible synonyms or abbreviations.
2.3 Bibliometric data and text mining
Bibliometrics is defined as a method of analyzing textual databases with quantitative methods (Borgman and Furner, 2002). We used the aforementioned vocabulary created using expert opinion to perform a bibliometric quantification of case data. We downloaded data from published journal and conference articles from the ISI Web of Science by using a search algorithm of “fuel cell” or “fuel cells” being mentioned in the title or topic. This resulted in a dataset of 47,837 articles, from which the bibliographical data was downloaded.
We used the SPSS Modeler software for text mining to further study the dataset. We analyzed the abstract field of the dataset by first searching for any reoccurring words. We compared the expert opinion vocabulary and the text mining results to identify possible synonyms of words missing from the expert opinion vocabulary. Thereafter we used the corrected expert opinion vocabulary as the library for the text mining. This resulted in a co-occurrence matrix, which was further analyzed with MDS.
2.4 Multidimensional Scaling (MDS)
The analysis of co-occurrence data is a part of author co-citation analysis (ACA). McCain (1990) describes author co-citation analysis as a set of data gathering, analytical and graphic presentation techniques that can be used to create results like empirical maps about noticeable authors in different disciplines. Statistical analysis of co-occurrence data is widely studied in academia. For example,White and Griffith (1980) studied the use of different multivariate methods, MDS and factor analysis for analyzing author co-citation data. MDS is a mathematical tool that presents similarities of data spatially in a map (Schiffman, Reynolds et al., 1981).
Leydesdorff and Vaughan (2006) suggested the use of the symmetric co-citation matrix as a proximity matrix directly for MDS. This is based on Kruskal and Wish (1981), who argued that proximity is only a number which indicates how similar or dissimilar two objects are. Cox and Cox (2001) argued that proximity matrices could be either similarity or dissimilarity matrices. However, Borg and Groenen (2005) have a more specific definition for the direct application of the co-citation matrix.
Borg and Groenen (2005) explained that the direct use of co-occurrence data as proximities depends on the definition of ‘direct’. In many cases, this definition of direct is mainly related to the researcher interpretation. They suggested that the direct use of co-occurrence data is usually not acceptable. Instead, it is better to norm co-occurrence data before the analysis. Several academics like McCain (1990), Peters and van Raan (1993), Waltman and van Eck (2007; 2007) share this opinion and they explain that the direct use of co-occurrence data as a proximity matrix is not acceptable.
Instead, they argue that a similarity measure for this kind of data should be calculated, suggesting that the data must be normalized before the analysis with MDS.
There are many possible methods for normalizing co-occurrence data. These are Pearson’s correlation coefficient, Salton’s Cosine, Jaccard index or its extension, Tanimoto index (for nonbinary situations), inclusion index, proximity index or the association strength. (White and Griffith, 1980; McCain, 1990; Peters and van Raan, 1993; Ahlgren et al., 2003; Leydesdorff, 2008; van Eck and Waltman, 2008; van Eck & Waltman, 2009) As several scholars have written about the different methods for normalizing co-occurrence data, there has been a lot of debate concerning which method is the best and which method should be used. Alhgren et al. (2003) as well as van Eck and Waltman (2008) have argued that the use of the Pearson correlation as a measure of similarity might be problematic. Alhgren et al. (2003) agreed that the use of Salton’s cosine instead of the Pearson correlation as a measure of similarity should be considered. Van Eck and Waltman (2009) and van Eck et al. (2010) have argued that the use of Salton’s cosine and the Jaccard index have been very popular among academics. Our work follows van Eck et al. (2010), as they argued that the most appropriate measure for normalizing co-occurrence frequencies is the association strength:

where cij indicates the number of items in which scholar i and j both occur and ci represents the number of items in which scholar i occurs (van Eck and Waltman, 2007a).
Typically co-citation or more generally cooccurrence type of data is analyzed using MDS (Leydesdorff and Vaughan, 2006). MDS is based on the work of Torgerson (1952; 1962). MDS is a set of mathematical methods that could be used for finding uncovered structures of data (Kruskal and Wish, 1981). MDS analyzes similarities or dissimilarities between objects in datasets. This kind of similarity data might consist of, for example, similarities between political candidates. MDS tries to model this kind of data as distances between points in geometric space. The distance between the points in this space corresponds to the original similarities or dissimilarities (Borg and Groenen, 2005).
There are two versions of MDS, metric MDS and non-metric MDS. Metric MDS analyzes objects with dissimilarities σrs and tries to find a set of points in a space where one point represents one object. The distances (drs) between points could be defined according to the following equation (Cox and Cox, 2001):
![]()
According to Cox and Cox (2001) the function in the previous equation is a continuous parametric monotonic function. It is possible for the function to be a transformation function or a special transformation function that transforms dissimilarities into distances. For metric MDS, it is assumed that proximities are ratio scaled values. In many cases, for example in social sciences, rank order of proximities is assumed. In these cases where proximities are rank order data, non-metric or ordinal MDS is a suitable method for data analysis (Borg and Groenen, 2005).
3 Morphological analysis of portable FC system designs
3.1 Define
Due to their versatility, portable FCs have been seen as a future energy source for smaller devices (Cropper et al., 2004). Analysed in several studies (Agnolucci, 2007; Broussely and Archdale, 2004; Dyer, 2002; Hellman, 2007; Suominen and Tuominen, 2010) scholars have tried to form a view on the future development of portable scale fuel cells. Studies have pointed out social and technical aspects inhibiting development. However, what is noteworthy with regard to fuel cells is the abundance of technological options available in designing a portable FC. In this study, we focus on portable fuel cells in the power range of 1-50 W.
3.2 Identifying characteristic parameters
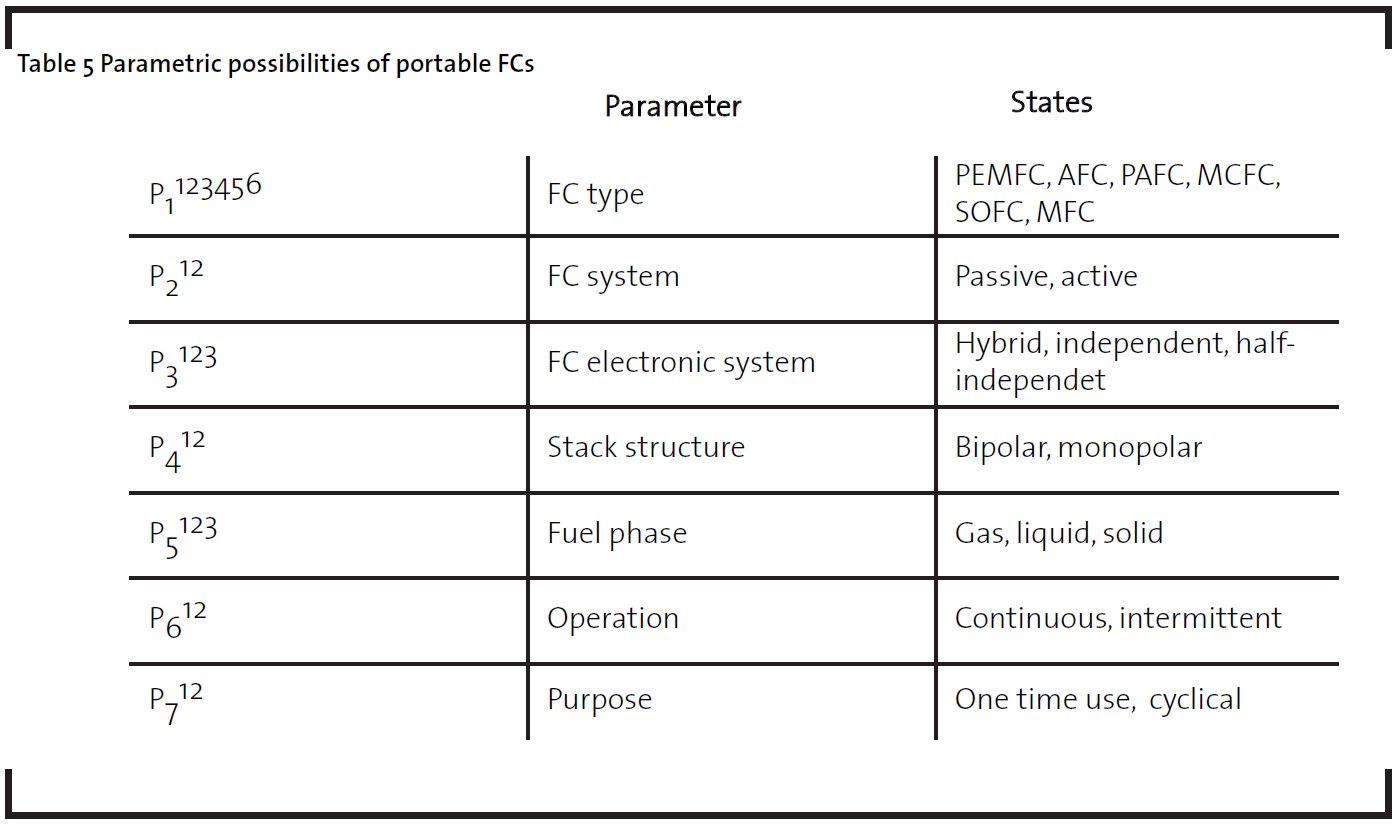
The parametric possibilities, based on a literature review, were classified according to seven characteristics, seen in Table 5. These were the overall type of the fuel cell, system type, control electronics system used, stack structure, fuel phase, operation modes, and operational purpose.
In regard to the type of fuel cell used, there are around 6 different types of FCs overall, and more than 20 sub-types. (Rayment and Sherwin, 2003) Not taking into account the subcategories, these are Polymer Electrolyte Membrane (PEM) FCs, Alkaline FCs, Phosphoric Acid FCs, Molten Carbon FCs, Solid oxide fuel cells (SOFC), and Microbial FCs.
These systems operate with different systems types, divided into an active and a passive system. In the passive system, without additional power-consuming active sensors and actuators for operation, the mass/heat transport is done by the natural capillary forces of diffusion; convection and evaporation are the driving forces behind all processes. The compactness, reliability, and relatively low cost are suitable for portable applications. A passive system is usually operated at a low current density because it is dependent on the operational conditions. Furthermore, a passive system requires more catalysts than active system. (Liu et al., 2006).
In an active system, the auxiliary system (heater, pump or fan), is used to help the mass and heat transport. It can offer a better operational environment for the device and thus produce more energy (Qian et al., 2006). An active system is more complex than a passive system, however it is better suited for solutions characterized by large power consumption. A passive system, with a simpler device structure, can offer a good solution for low energy requirement systems.
In addition to the requirement for auxiliary systems or control electronics, portable FCs might require a secondary power source in order to operate on a practical level. Systems are therefore divided into hybrid, independent or half-independent designs. In a half independent system, the FC system requires an auxiliary energy source to start the cell. In addition to these, a system can be designed as an autonomous system, where the ignition is given by, for example, a mechanical system. These are later referred to as independent.
In addition to the system design, there are several FC structures, referred to as stack structures. An FC stack, the basic unit cell, can be configured as a unit single cell, a unit bicell, or as a bi-polar structure. These structures, similarly to active or passive systems, vary in their power output.
In relation to the fuel used in FCs, a liquid, gaseous, or solid fuel can be used. The term ‘fuel state’ does not refer to the fuel’s state during storage but rather to the form in which the fuel is used. Usually the fuel supplied to a FC is a gas or a liquid fuel. However, high temperature FCs, such as the SOFC and MCFC, use gaseous fuel.
In addition to the above-mentioned characteristics, FCs are defined by the system’s ability to start and stop the chemical process during operation. In addition, the mode of use – one-time or cyclical – can be seen as design characteristics.
3.3 Transforming parameters into “states”
When transforming the parametric possibilities into the morphological box noted as (p1j, p2j, p3j, p4j, p5j, p6j, p7j), there are 864 distinguishable configurations of the parametric possibilities. The number of configurations is the result of multiplying 6*2*3*2*3*2*2. This means there are 864 distinguishable configurations of the above parameters, which define the total set of configuration. This is further noted as set A.
3.4 Evaluate solutions
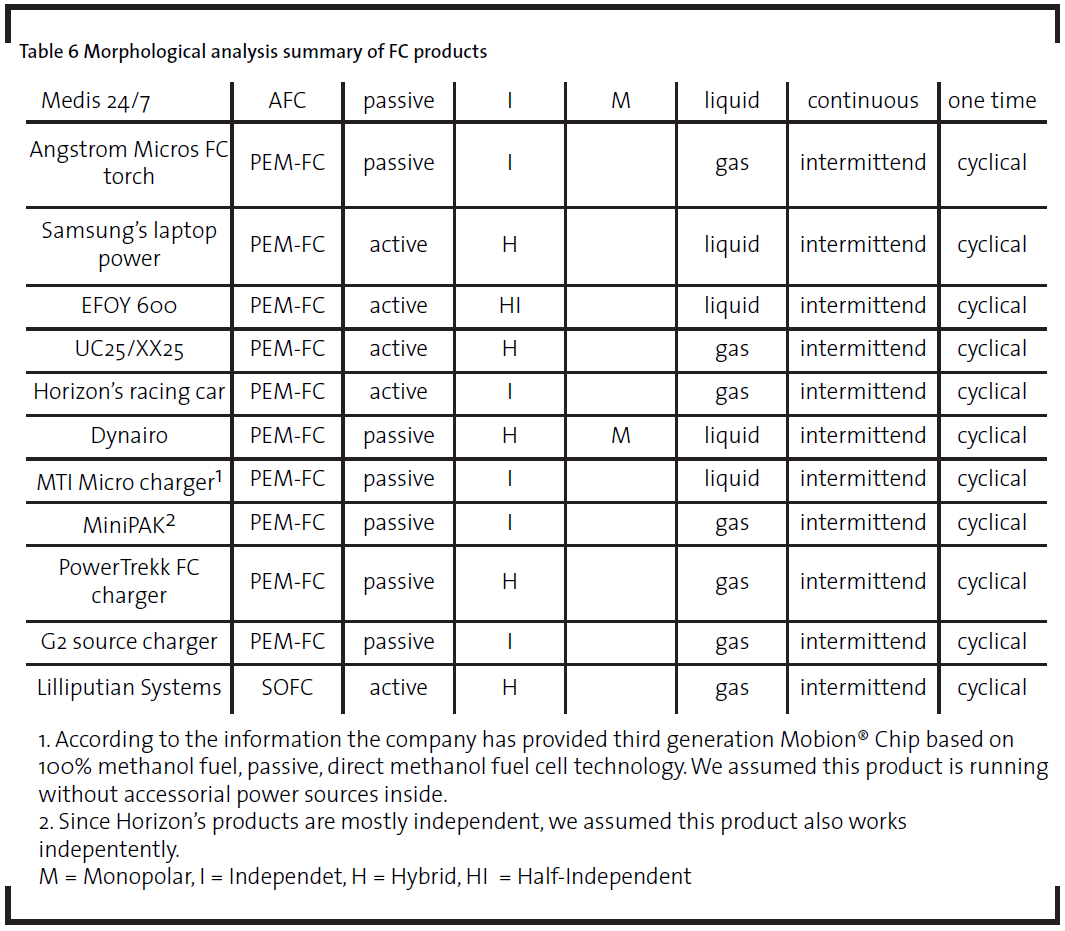
Currently, to the author´s knowledge, there are a variety of – mostly prototype based – portable FCs available. Demonstrational projects for several companies have shown promise, and this study focuses on the different published results as the “known” area. Products from, among others, Horizon, PowerTrekk, MTI Micro, and Toshiba have applied different morphologies in designing their products. As an example the MiniPAK device from Horizon is “a palm-size universal portable power charger and power extender for any electronic device requiring up to 2W of power” (Horizon, 2007). It is a passive air breathing H2 PEMFC charger, using a metal hydride storage unit due to the challenges in gas storage. It can be used to charge 1-2 smart phones. PowerTrekk FC charger is similar as the MiniPAK, but it has a Li-ion battery as a secondary energy source and buffer. Toshiba’s Dynairo FC charger is a passive air breathing DMFC charger with multiple cells. With a 14 ml fuel tank, the charger can charge two cell phones. The size of the Dynairo charger is similar to the MiniPAK, and both of them are using an USB port to charge the cell phones. Similarly to PowerTrekk, Dynairo uses a Li-based battery as a buffer zone and to supply the energy to start the DMFC. MTI Micro is producing a passive DMFC charger with 25 ml cartridge. It can be used for charging 10 phones. The difference between this one and the Dynairo is that the fuel (methanol) tank is a cartridge and filling the fuel can be done by changing the tank.
The following portable FC characteristic were collected from the literature review, which was based on professional literature and patent databases. Although we admit that this is not an exhaustive list of all possibilities, it is seen as capturing different prototyped systems, while keeping the exercise in a practical length to be demonstrated in a single study. The states of different systems can be seen in Table 6.
This creates Set B, which is defined by the 12 members of Set A. By using the definition in Table 2 the surface, or Set C, can be defined. In this case Set C, or the perimeter as defined by Ayres, is defined by the 118 permutation of the known area. Arguing that within Set C lays the most significant near future discovery. This table has been excluded to conserve space.
However, as noted by Ritchy (2002), Set A might contain members that are constrained from existing together. While being cautious of removing members that seem implausible but potentially practical in the future, several physically impractical solutions were excluded. These are designated as a Set F, to clearly state that these are noted as unfeasible with regard to the currently available knowledge, as seen in Table 7. Since portable FCs are a relatively new technology, their development and research is merely in its infancy, and what is empirically impossible now may be possible in the future. We should be wary of weeding out the possible solutions when analyzing the empirical constraints.
By definition, this leaves the “Terra incognita”, or Set D.
3.5 Statistical evaluation
Firstly,the gathered co-occurrence data was transformed into proximities. This transformation was carried out using the previously mentioned approach from van Eck et al. (2010) by using the measure of association strength. This transformed data could be used as proximities in MDS. Choosing the proper type of MDS might be challenging, because researchers of bibliometric data do not usually state which MDS method they have used. Ratio MDS is not a suitable method when proximities are similarities. In this kind of a situation, where researchers use MDS to create bibliometric maps, they usually apply ordinal MDS or interval MDS (van Eck et al., 2010). On the other hand van Eck et al. (2010) argue that when proximities are calculated using association strength, the use of MDS is not completely satisfactory. Instead, they propose the use of the visualization of similarities (VOS) method as proposed by van Eck and Waltman (2007b). However, we have chosen the traditional way of mapping similarities with MDS. According to van Eck et al. (2010) similarities that are calculated based on association strength could be treated as measurements on a ratio scale. Based on the previously presented facts about the proper type of MDS we have chosen interval MDS as our analysis method.
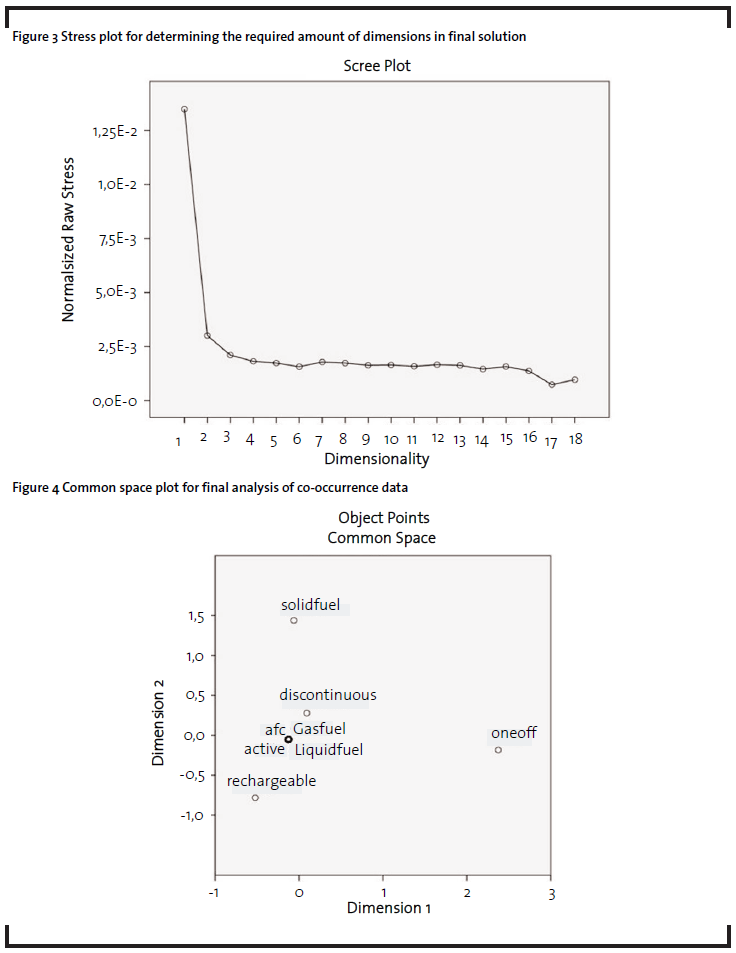
Figure 3 shows the scree plot with “elbow” between dimensions 2 and 3. According to (Borg and Groenen, 2005) that “elbow” corresponds to the number of dimensions included in the final solution. The interpretation is that two dimensions are enough for the final solution. Now we have recalculated using 2 as the maximum and 1 as the minimum amount of dimensions. The fit of the MDS model could be analyzed using Stress criterion. This criterion defines the best fit between distances in original input matrix and the estimated distances in low dimensional solution. Low stress values are required and usually values smaller than 0.2 are acceptable (McCain, 1990). The stress in our model is 0.02113 which is smaller than the required value.
The final analysis solution for our co-occurrence data can be easily visualized using a common space plot (Figure 4).
The common space plot (Figure 4) of the solution of our co-occurrence data in twodimensional space. Points that are near each other in a space can be interpreted as similar and points that are far from each other can be considered dissimilar. Based on this, there is a group of points in the space plot, close to each other, which means that these points are similar. There are also points that are separate from this group as well as each other. These variables are more dissimilar than anything else in our data.
The visualization produced by the MDS analysis should visualize the known area and we would expect that the solutions identified with the use of expert opinion should form a close group. In addition, new solutions should be either individual points in the visualization or non-existing. However, the visualization has only created one clear group with several dissimilar points. The closely formed group in Figure 4 clearly defines several of the existing prototypes described in Section 3.4.
4 Discussion
As Ayres claimed, “…it is possible to construct a morphological space for any welldefined technology…”. (Ayres 1969) Enabling the structuring of complex problems, the morphological approach has made it possible to make the different permutations of a problem at hand explicit. The value of the approach as a technology analysis tool is threefold. As a current state analysis tool, Morphological Analysis structures the existing solutions within a technology in a practical way. The future aspect of the approach enables the discovery of the perimeter, which shows the near field of discovery and finally approximates the unknown.
MA is, however, limited. The identification of characteristic parameters is limited by the existing body of knowledge, which we are aware of, and as Ritchy (1998) has clearly stated “…the output of a morphological analysis is no better than the quality of its input “. In the case study, the characteristics were extended to seven attainable characteristics, analyzing portable FCs at a high abstraction level. This was done partly to keep the length of the study practical, but also to show that the characteristics could be extended almost indefinitely. At a lower abstraction level materials, components, and secondary batteries used would be a valid extension to the parameterization. It is clear that at an overly high level of abstraction the analysis appears trivial. A more in-depth parameterization of the problem area will enable a more valid assessment. This would, however, increase the amount of data significantly. This would require computeraided analysis of permutations, as suggested by Ritchey (2006).
By using bibliometrics, text mining and MDS the research strove towards a more structured method of performing MA, which would make the method more applicable. The statistical analysis was used as a validating tool for the expert opinion analysis. We discovered that the statistical results were able to identify the most visible group in the dataset. However, new research avenues were not identified.
As a management implication, the communicative elements within the MA should be noted (Wissema, 1976). The method enables a vision to be created of the current state of the technology, which is visible as a simple matrix of permutations. The method also makes explicit different permutations, some of which might not come up when using other methods. This frees the development group to not discuss which solutions are possible but to exclude those solutions that are impossible. This way a number of out-ofthe-box ideas will remain, open for further analysis.
In conclusion, the method has received only mild interest since its “invention”. Although the method’s significant advantages in technology analysis were noted early on, (Wissema, 1976) and have been applied in different case studies (e.g. Ritchey, 2002; Yoon and Park, 2005; Lai, et al., 2005; Kim, et al., 2008) the method still requires more empirical studies in order to be validated. In addition, tools enabling the solutions of complex issues with a significant amount of parameters will require computerized tools and development of statistical analysis.
5 Conclusion
This study reviewed the MA method as a technology analysis tool. Although the method was first suggested decades ago, it has not been used actively. Only more recently several scholars have adopted the method. Through a case study, the paper exemplified its application and made several notions on practical limitations. In conclusion, MA is well suited to the structuring of complex problems. However, the use of computerized methods, as the number of parameters increases, is seen as practical.
References
Agnolucci, P. (2007): Economics and market prospects of portable fuel cells. International Journal of Hydrogen Energy, 32, p. 4319-4328.
Ahlgren, P., Jarneving, B. & Rosseau, R. (2003): Requirements for a cocitation similarity measure, with special reference to Pearson’s correlation coefficient. Journal of the American Society for Information Science and Technology. 54(6), p. 550- 560.
Ayres, R. U. (1969): Technological forecasting and long-range planning, McGraw-Hill, New York.
Borg, I. & Groenen, P. J. (2005): Modern Multidimensional Scaling: Theory and Applications, Springer.
Borgman, C. L., and J. Furner (2002): Scholarly communication and bibliometrics, Annual Review f. Information Science and Technology, 36, p. 3-72.
Broussely, M., & Archdale, G. (2004): Li-ion batteries and portable power source prospects for the next 5-10 years, Journal of Power Sources, 136, p. 386-394.
Champon, D., & Wilson, J. (2010): The impact of contingency factors on validation of problem structuring methods, Operational Research Society Ltd., 61, p. 1420-1431.
Cox, T. F. & Cox, M. A. (2001): Multidimensional Scaling, Chapman and Hall/CRC.
Cropper, M. A., Geiger, S., & Jollie, D. M. (2004): Fuel cells: a survey of current developments. Journal of Power Sources, 131, p. 57-61.
Dyer, C. (2002,): Fuel cells for portable applications. Journal of Power Sources, 106, p. 31-34.
Edwards, J., Ababneh, B., Hall, M., & Shaw, D. (2009): Konwledge management: a review of the field of OR’s contribution, Operational Research society Ltd., 60, p. 114-125.
Foray, D., & Grubler, A. (1990): Morphological analysis, diffusion and lockout of technologies: Ferrous casting in France and the FRG, Research Policy, 19, p. 535-550.
Hellman, H. (2007): Characterising fuel cell technology: Challenges of the commercialisation process, International Journal of Hydrogen Energy, 32, p. 305-315
Higgins, J. M. (1996): Innovate or evaporate: Creative techniques for strategists, Long Range Planning, 29, p. 370-380.
Horizon ( 2007): Minipak, available at h t t p : / / w w w . h o r i z o n f u e l c e l l . c o m / store/minipak.htm, accessed 27 April 2011).
Kim, C., Choe, S., Choi, C., & Park, Y. (2008): A systematic approach to new mobile service creation, Expert Systems with Applications, 35, p. 762-771.
Kruskal, J. B. & Wish, M. (1981): Multidimensional scaling, Sage publications, Inc.
Lai, H.-H., Lin, Y.-C., & Yeh, C.-H. (2005): Form design of product image using grey relational analysis and neural network models, Computers & Operations Research, 32, p. 2689-2711.
Levin, D. Z., and H. Barnard (2008): Technology management routines that matter to technology managers, International Journal of Technology Management, 41, p. 22-37.
Levin, M. S. (2011): Sellection of User’s Connection in LastMile Problem, IEEE Transactions on systems, man, and cybernetics – part A: systems and humans, 41(2), p. 370-374.
Leydesdorf, L. (2008), On the normalization and visualization of author co-ciation data: Salton’s cosine versus the Jaccard index, Journal of the American Society for Information Science and Technology, 59(1), p. 77-85.
Leydesdorf, L. & Vaughan, L. (2006): Co-occurrence matrices and their applications in information science: extending ACA to the web environment, Journal of the American Society for Information Science and Technology, 57(12), p. 1616-1628.
Liu, J. G., Zhao, T. S., Liang, Z. X., & Chen, R. (2006): Effect of membrane thickness on the performance and efficiency of passive direct methanol fuel cells, Journal of Power Sources, 153, p. 61-67.
McCain, K. W. (1990): Mapping authors in intellectual space: a technical overview, Journal of the American Society for Information Science, 41(6), p. 433-443
Peters, H. F. P. & van Raan, A. F. J. (1993): Co-word-based science maps of chemical engineering. Part I: Representations by direct multidimensional scaling. Research Policy, 22, p. 23-45
Popper, R. (2008): Foresight methodology. In L. Georghiou, J. Cassigena Harper, M. Keenan, I. Miles, & R. Popper, The handbook of technology foresight, Edwar Elgar Publishing, pp. 44-90.
Qian, W., Wilkinson, D., Shen, J., Wang, H., & Zhang, J. (2006): Architechure for portable direct liquid fuel cells, Journal of power sources, 154, p. 202-213.
Rayment, C., & Sherwin, S. (2003): Introduction to Fuel Cell Technology, University of Notre Dame, Notre Dame
Ritchey, T. (2004): Strategic Decision Support using Computerised Morphological Analysis, Swedish Morphological society
Ritchey, T. (1998): General Morphological analysis: A general method for non-quantified modeling, Swedish morphological Society.
Ritchey, T. (2002): Modelling Complex Socio-Technical Systems Using Morphological Analysis, Swedish Morphological Society.
Ritchey, T. (2002): Using Morphological Analysis for evaluating Preparedness for Accidents Involving Hazardous Materials, Swedish Morphological Society.
Ritchey, T. (2006): Futures Studies using Morphological analysis, Swedish Morphological Society.
Ritchey, T. (2006): Problem Structuring using computeraided morphological analysis, Operational Research society Ltd., 57, p. 792-801.
Schiffman, S. S., Reynolds, M. L., & Young, F. W. (1981): Introduction to Multidimensional Scaling Theory, Methods, and Applications, Academic Press, Inc. Shurig, R. (1984): Morphology: A tool for exploring new technology, Long Range Planning, 17, p. 129-140.
Shurig, R. (1986): Morphology: A knowledge tool, Systems Research, 3, p. 9-19.
Suominen, A., & Tuominen, A. (2010): Analyzing the Direct Methanol Fuel Cell technology in portable applications by a historical and bibliometric analysis, Journal of Business Chemistry, 7(3), p. 117-130.
Torgerson,W. S. (1952): Multidimensional Scaling: I. Theory and Method, Psychometrika, 17(4), p. 401-419.
Torgerson, W. S. (1962): Theory and Methods of Scaling, John Wiley & Sons, Inc.
Van Eck, N. J. & Waltman, L. (2007a): Bibliometric mapping of the computational intelligence field, International Journal of Uncertainty, Fuzziness and Knowledge Based Systems, 15(5), p. 625-645.
Van Eck, N. J. & Waltman, L. (2007b).: VOS: a new method for visualizing similarities between objects, In: Lenz, H.-J. & Decker R., eds., Proceedings of the 30th Annual Conference of German Classification Society, Studies in Classification, Data Analysis and Knowledge Organizations, Springer
Van Eck, N. J. & Waltman, L. (2008): Appropriate similarity measure for author co-citation analysis, Journal of the American Society for Information Science and Technology, 59(10), p. 1653-1661.
Van Eck, N. J. & Waltman, L. (2009): How to normalize co-occurrence data? An analysis of some well-known similarity measures, Journal of the American Society for Information Science and Technology, 60(8), p. 1635-1651
Van Eck, N. J. & Waltman, L., Dekker, R. & van den Berg, J. (2010): A comparison of two techniques for bibliometric mapping: multidimensional scaling and VOS, Journal of the American Society for Information Science and Technology, 61(12), p. 2405-2416.
Van Wyk, R. J. (1988): Management of technology: New frameworks, Technovation, 7, p. 341-351.
White, Howard D., and Belver C. Griffith, Autor Cocitation (1980): A Literature Measure of Intellectual Structure, Journal of the American Society for Information Science, 32, p. 163-171.
Wissema, J. G. (1976): Morphological analysis: Its application to a company TF investigation, Futures, 8, p. 146-153.
Yoon, B., & Park, Y. (2004): Morphology analysis approach for technology forecasting, 2, pp. 566-570.
Yoon, B., & Park, Y. (2005): A systematic approach for identifying technology opportunities: Keyword-based morphology analysis, Technological Forecasting and Social Change, 72, p. 145-160.
Yoon, B., & Park,Y. (2007): Development of New Technology Forecasting Algorithm: Hybrid Approach for Morphology Analysis and Conjoint Analysis of Patent Information, Engineering Management, IEEE Transactions on, 54, p. 588-599.
Zwicky, F. (1947): Morphology and nomernclature of jet engines, Aeronaut Eng Rev, 6(6), p. 49-50.
Zwicky, F. (1948a): Morphological astronomy, Observatory, 68(845),p. 121-143.
Zwicky, F. (1948b): The morphological method of analysis and construction, Courant, Anniversary Volume, p. 461-470.
Zwicky, F. (1969): Discovery, Invention, Research – Through the Morphological Approach, The Macmillan Company, Toronto
Zwicky, F., & Wilson, A. (1967): New Methods of Thought and Procedure: Contributions to the Symposium on Methodologies, Springer, Berlin