Three-Dimensional Valuation of IP Rights
Abstract: IP rights form the major part of the group of immaterial property assets which have been gain- ing importance for companies. The present paper provides a new method for valuating especially patents with respect to their monetary value, technological scope and legal importance. Several methods for value calcula- tion and technological evaluation are discussed and a 3D-analysis based on a concrete example is presented.1
Introduction
Intellectual Property (IP) rights and copyrights form part of the group of immaterial property assets which have been gaining importance for companies even though their balancing – at least according to German commercial and tax law – is only possible if they were acquired from third parties, in other words, in return for payment. This may lead to considerable distortions of competition because numerous companies, for example in the field of biotechnology, can hardly present any assets other than patents and patent applications. Their value, not only of start-up companies but also of many major players, is largely based on their treasure of patents and copyrights. According to a survey conducted by Cardoza et al. the intangible book value as a percentage of market capitalisation of the S&P 500 is approximately doubling since 1975 every 10 years and has now reached about 15 % [1]. In addition, property rights as immaterial property assets have been gaining increasing importance for the creation of liens, for example when financing R&D, or in M&A transactions.
From an accounting point of view, material and immaterial property assets may have a similar sig- nificance for a company, however, the difference, or should I say, the dilemma, becomes visible at the latest when a comprehensible valuation needs to be presented, which is able to resist the strict regulations of IAS 38 and IFRS. This can be shown by way of a simple example: If a company owns a gold mine, the deed of ownership embodies the difference between a profit amounting to “X” and no profit at all. In addition, if this company owns patents protecting a particularly environmentally sound method of extraction of the precious metal from the gangue, it is certainly obvious that no additional benefit may be generated without these patents; however, if any additional profits are generated by such patent protection depends on many other factors. Therefore, mate- rial assets exhibit a value of some or other nature in themselves, while immaterial assets, such as patents in particular, can also take the value of „zero“ if they are granted world wide and even enforceable in principle. Because of a vivid interest in determining the value of protective rights as immaterial assets, and due to the fact that existing approaches from literature either refer to single aspects of valuation and/or re by far too complicated to evaluate huge portfolios we shall in the following have a new look at the three valuation dimensions of
- Monetary value
- Technological value
- Value in the patent law sense
in order to develop a pragmatic and still sustain- able approach for valuating IP rights.
Monetary valuation of IP rights
In the past years, a variety of papers has been published dealing with the economic valuation of IP rights and IP portfolios, an issue of increasing importance, although the focus of these papers is on the entirely monetary valuation – we shall call it the first valuation dimension. At this point I should like to make a reference to the publication of Khoury [2] and particularly Rings [3] who has compiled an extensive list of factors which could be of significance for the value of an IP right. Ba- sically the existing methods of valuation can be traced back to any of the three following ap- proaches:
- Market orientation: Determination of the patent value using comparable patents or licenses by interac- tion of supply and demand on the market;
- Cost orientation or licence analogy: The sum of all real, fictitious and/or po- tential costs and expenses which accrue in connection with the development or acqui- sition, maintenance, defence and marketing of a patent;
Profit orientation: Discounted profits, earnings or cash flows, which have been generated with the patent or can be expected in the future.
Market-oriented approaches
Market-oriented approaches aim more at the consideration of the past then of the future. Their question is what price an IP right might reach if offered for sale. For real estate this may be a reasonable method as there are a sufficient number of possibilities of comparison for this kind of material assets. For patents, however, there is no mar- ket in this sense so that any value is speculative in the end. Therefore, market-oriented approaches usually do not yield reasonable results.
License analogy approaches
Approaches derived from license analogy can be regarded from the standpoint of both the licen- sor and the licensee. The first approach is compa- rably simple and sound provided it can use existing license income as its basis. With that, the value of the IP right (V) would result as the sum of annual license payments (l) over the duration (i) of all li- cense contracts, from which the sum of the costs (k) for the creation and maintenance of the IP rights needs to be deducted:
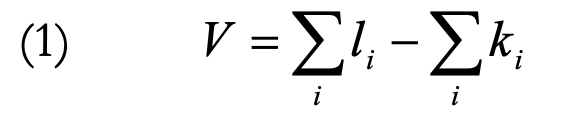
The only imponderability merely is the amount of annual license income.
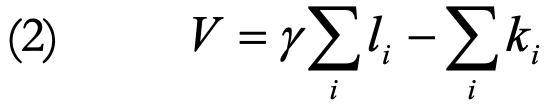
Things look different when we carry out the determination of value according to the method of license analogy without even having a licensee. Experience shows that an active search for a third party interested in a license is a difficult undertaking, the outcome of which can rarely be predicted, and in which very different ideas about the value of IP rights to be licensed collide time and again. Accordingly, the above formula shall be completed at least by a risk factor (γ) which is between 0 and 1, and which expresses the probability of finding a licensee at all.
If a contract is then concluded, the effective license income remains an arbitrary parameter even if we consider an average customary license factor because in this already hypothetic scenario we cannot make a statement on the license-relevant turnover a licensee would make. Hence the determination of value on the basis of fictitious license income significantly depends on mere assumptions on the probability of the granting of a license, on the license factor to be agreed, and on the income of the licensee. As usually none of these factors can be predicted with sufficient certainty, this method delivers completely hypothetical and therefore arbitrary values and is simply not meaningful.
On the other hand, we can use the method of license analogy in a different manner, namely by asking which costs have been saved by not de- pending on obtaining a license for the protected technology from third parties. The value results from formula (3)
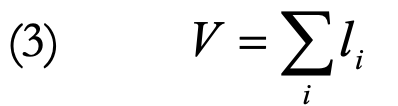
in which factor (l) stands for the fictitious license expenses. The approach to determine the value by way of saving costs has the charm that it is possible to state the turnover – at least in case of already existent business. If we assume an average license factor which is customary for the technol- ogy, it is possible to keep uncertainty low, which is always involved with mere estimates. Admittedly, this approach requires that the absence of a com- pany’s own patents would imperatively entail pat- enting by competitors who would be willing to grant licenses at standard, and therefore bearable, conditions, which nobody can tell for sure.
Profit-orientated approaches
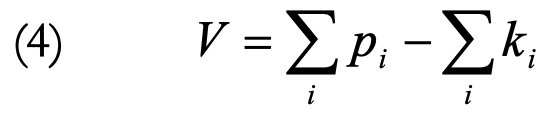
Amongst the approaches orientated at profits, the one is certainly of particular simplicity which implies that income and existence of a patent would stand in a direct connection, i.e. by plainly linking profits to patent protection. So the value of an IP right (V) would result as sum of the annual profit (p) over the number of years (i) in which in- come is received, whereby the sum of the costs (k) associated with application and maintenance of the IP right obviously needs to be deducted for the same period in time:
We shall at this point ignore how reliably we can estimate the earnings performance history over the duration of an IP right or the life-time of the product. It should be clear though that this approach presents the “roughest possible“ gener- alisation that we can make for the correlation be- tween patent protection and gains, and which in 99.9 % of all cases is certainly inappropriate as it requires two preconditions:
- A product or a product group must be al- ready available so that reasonably realistic estimates of value can be carried out, and
- In case of lapse of patent protection, gains would approach zero.
Firstly, from the above it follows that this ap- proach can not be applied to new technologies at all or remains completely speculative because any speculation regarding gains would be based on a hypothetic business performance, and risks in connection with product or market development would be completely ignored. However, also for established products, this approach is too short- sighted because in the majority of cases turnover and gains are not exclusively based on a patent monopoly; price, quality, production safety and technical service, etc. are of the same importance. A typical example is the generics: after termination of patent protection the profits of the previous patent holder are considerably reduced because other market mechanisms are decisive for the per- formance, but they rarely approach zero.
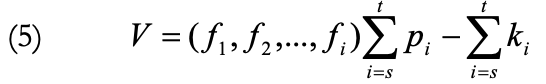
In order to evade this problem, literature sug- gests compensating the imponderability of this method by introduction of weighting factors, which can take values between 0 and 1. This can easily be explained by way of an example. Assum- ing that patent protection would cease to exist, we shall now contemplate what influence this would have on the competitive environment. If the mar- ket is attractive and strongly influenced by our monopoly, it would well be possible to assume that competitors would appear instantly, i.e. the correction factor for the likelihood of competition (f1) would be 1. It could, however, also be possible that nothing would change in the competitive en- vironment, e.g. because the market is not very at- tractive, or the technology is very specific. In an extreme case, the weighting factor and subse- quently the value would equal zero because the patents would not contribute to the profit at all. Even if competitors enter the market, this does not automatically have to lead to the loss of the whole business. It is more probable that market shares need to be surrendered, and that business will stabilise at a lower level. In this case the weighting factor for the market share (f2) might be 0.5. Similarly, more and other factors can be de- fined depending on the case. At this opportunity it is recommended to further take into account that the value of an IP right or a group of IP rights is usually not 20 years but it is linked to the lifetime of the respective product which can be much shorter. Therefore, summation needs to be carried out from the priority date of the patent(s) – or the beginning of use – up to the end of industrial use (t), which then leads to the modified formula (5):
Even if the formulae become more and more complex, there cannot be any doubt, though, that the suggested objectivity is, and will always remain, pseudo-objectivity. May turnover and lifetime be comparably reliably calculated – otherwise every business plan would be obsolete from the start – however, the assumptions connected with the weighting factors are always speculative and „soft“. The more such factors are introduced into the formula, the more we need to hope that the er- rors are balancing each other out. Incidentally, with the number of factors the value of the IP right automatically diminishes, which shall be illus- trated by the following example:
The starting point shall be the fictitious patent- protected product „Emulgade X“, which is expected that it would not assert itself on the market for more than five years. For this period we shall as- sume an annual turnover of 10 million € with a profit contribution of 35 %. As it is a small patent family, the costs for application and maintenance shall be estimated to be not more than 100 T€, which means that we may ignore this amount, to simplify matters, in the further value calculation. Thus the value is calculated according to equation (5) as follows:
0.35⋅(10M €)⋅5a =17.5M €
Now we need to compare the situation with and without patent protection, which requires a further few assumptions. If we act on the assump- tion that the probability of a competitor entering the market as soon as patent protection ceases is 50 %, this means that the result firstly needs to be multiplied by correction factor f1 = 0.5. If we further assume that, in case a competitor appears, he would take from the patent owner 50 % of the market share at a constant price, or the patent owner would lose 50 % of his profits due to a fall in prices, then the result will have to be multiplied another time with a correction factor f2 = 0.5:
17.5M €⋅0.5⋅0.5 = 4.275M €
It is obvious that the result can be shifted into any direction by suitable „readjustment“ of the soft parameters. Although this method of calcula- tion of value does consider market factors, it is only reliable to the extent of our willingness to ac- cept the given conditions, namely kind and amount [4].
Approach of the market share
Poredda and Wildschütz [5] pursue an interest- ing profit-oriented approach, in which they assume that the value of an IP right is primarily propor- tional to its market share which can be controlled by the patent. To this end, they employ a model of a mountain situated between the potential supplier and the market product (cf. Fig. 1).
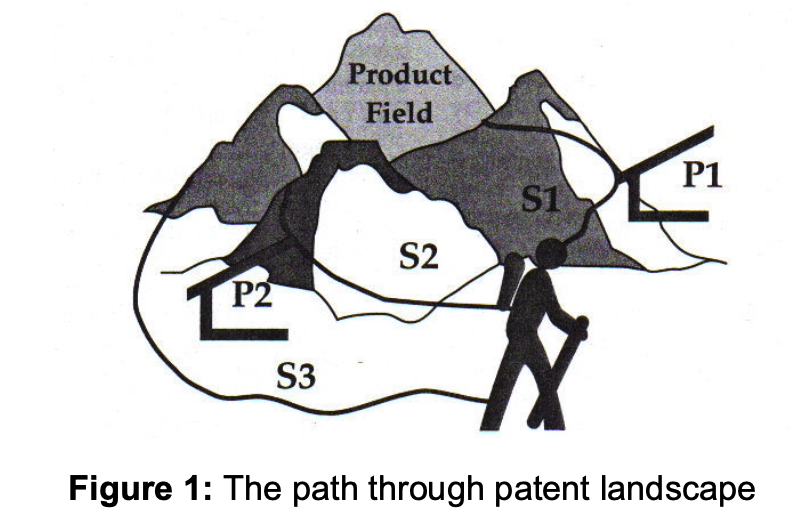
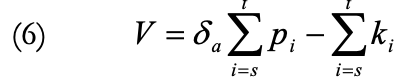
According to this nice model there are various paths (S1, S2 and S3) over the mountains leading to the desired product, which vary in steepness or length and due to this are more or less attractive. In addition, paths S1 and S2 are blocked by cus- toms facilities P1 and P2 (= patents), so that as the only working alternative path S3 remains, which however is the longest (= most expensive). The value of an IP right (equation 6) is again calculated according to this proposal over the sum of the profit aimed at multiplied by a factor δ, which results in the attractiveness of the relevant technol- ogy (a) in relation to other alternative technologies as well as forms of circumvention over the actual time of exploitation:
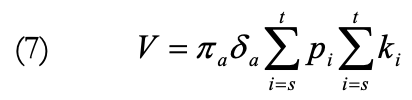
Furthermore, the proposed method of calcula- tion takes into account that a product usually does not utilize just a single technology. A car, for ex- ample, comprises a motor, gearbox, braking sys- tem, electronics and much more, and all – pro- tected – technologies behind it contribute to the profit of the finished product. Therefore, a further correction factor π is required describing the share the technology (a) contributes to the creation of the finished product:
Ultimately, the authors point out an issue which receives far too little attention in the monetary or, respectively, technological valuation of IP rights: the patent strength, which is described by weight- ing factor λ for technology (a), and itself is com- posed of a sum of individual factors, for example, the extent of protection, patentability, the possibil- ity to prove infringements, remaining duration, etc. In closing, the following equation results (8):
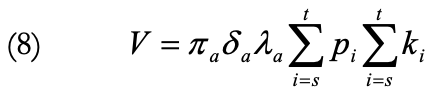
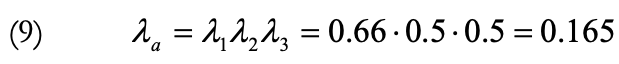
However, at the end of the day this calculation method does also constitute nothing more than a profit-oriented approach, in which merely the se- lection of correction parameters is different. The inclusion of a parameter that corresponds to the strength of the IP right is certainly reasonable, but only if set in suitable proportion to the remaining control parameters, as the following example shows. Patent strength λa, accordingly, is the product of only three sub-parameters, to simplify matters, which are defined as „Probability to grant λa1“, „Scope of protection λa2“ and „Remaining lifetime λa3“, each of which may take any value be- tween 0 and 1. The considered IP right is in the 7th year of its duration (λa3 = 0.66), and an opposi- tion has been filed. After restricting the original claims version to a preferred form of embodiment (λa2 = 0.5), novelty is established, and the chances that the Opposition Division recognises inven- tiveness, however, are 50:50 (λa1 = 0.5). For patent strength (9) there would result:
If patent strength according to formula (9) were incorporated as an additional correction factor in the calculation of value for Emulgade X according to equation (5), in the above calculation example the value of the IP right would diminish from 4.275 M€ to a little more than 700 T€. If this ap- proach is followed consequently, the introduction of only a few additional control parameters – each of which may have its merit – will ultimately bring the result to zero. This should not be the result of a reliable valuation.
Technological valuation of IP rights
As shown in the previous considerations, the monetary valuation of immaterial assets which aims at assigning them a value in Euro and Cent, exhibits the generic problem that the calculation basis largely depends on assumptions and is therefore reliable to the extent of how reliably the propositions can be regarded. However, this also provokes the question whether it is possible to at least support the monetary valuation by a kind of counter calculation. Therefore, a further valuation dimension is required.
To this end, business-oriented valuation meth- ods for the valuation of IP rights have been catch- ing on since the 1980ies. The following ap- proaches have proved to be particularly interesting for it:
- Patent audits
- Life cycle analysis
Portfolio analysis
Auditing of patents
The patent audit firstly aims at the compilation of the patents available in a company, and then to determine technological, legal and value-relevant information on an individual basis [6]. Up to now, however, this method has basically been used to facilitate decisions on maintenance or abandonment of IP positions, and to determine the poten- tial of licensing out a company’s own technologies.
Life cycle analysis
The success of a product on the market shows, over time, a characteristic bell-shaped course which passes through 5 stages:
1. Introduction (investments still prevail)
2. Growth (above-average growth rates)
3. Maturity (growth rates decrease, profits consolidate)
4. Stagnation (turnover and profits de- cline)
5. Decline (turnover and profits collapse).
The life cycle of a product can be associated to the life cycle of the respective IP right which, however, shows a slightly different course:
- Application (benefits are still low be- cause it is not clear yet whether and in which form a patent grant will occur).
- Maximum benefits as soon as patent grants
- Decline (abandonment, revocation, ex- piration)
Due to the different gradients it is not possible to make the life cycles congruent, however, they can be harmonised – with varying success – as the three following examples demonstrate. Fig. 2-4 show the sales of the respective product in [T€] and the corresponding patent protection for this product over the time. Patent protection starts at a low level at the time the application is filed and increases to a level of 100 % until the patent is finally granted and valid. It goes down to zero once the patent application is finally rejected, abandoned or the patent has been revoked or is expired.
- In the first case, product A displays a broad bell-shaped gradient of gains over quite long earnings performance duration of 20 years. At the time of market launch, however, the pertaining IP right was filed 8 years ago and granted 5 years ago. Protection expires in the phase when the company makes the biggest gains with the product. In the following, the company faces the danger of competitors appearing and of market shares declining. This example shows that the market launch simply occurred too late.
- In the second case, product B shows a short success story and thus a narrow bell- shaped curve. Also this product is profiting from patent protection only to a small degree because it is already in decline when patent protection displays its biggest effect due to grant. As a consequence, the IP right should rather be abandoned because it cannot be exploited any more.
In the third example, maximum gains and maximum protection coincide temporally. Hence, market success and patent protection are synchronising.
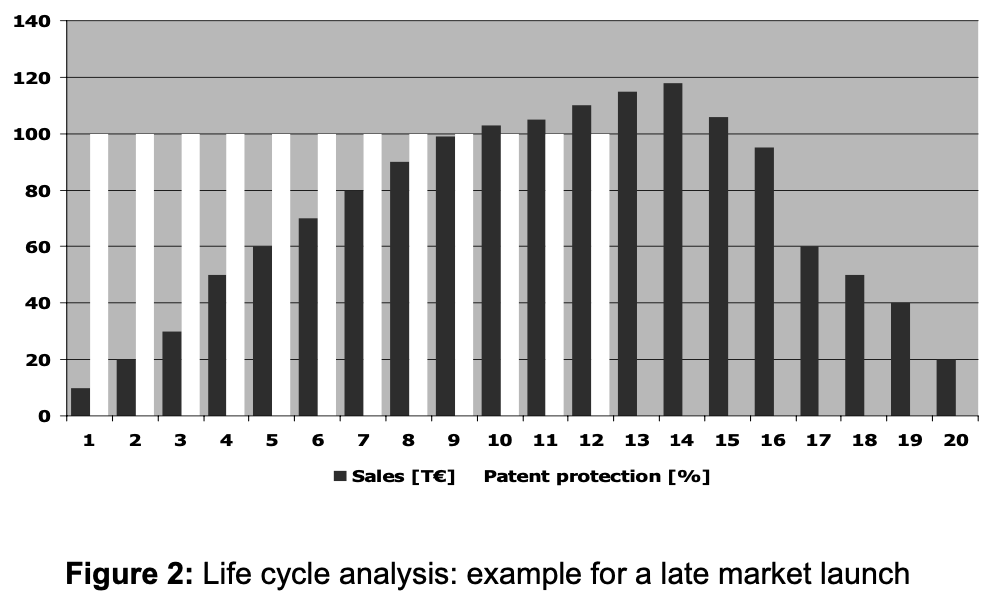
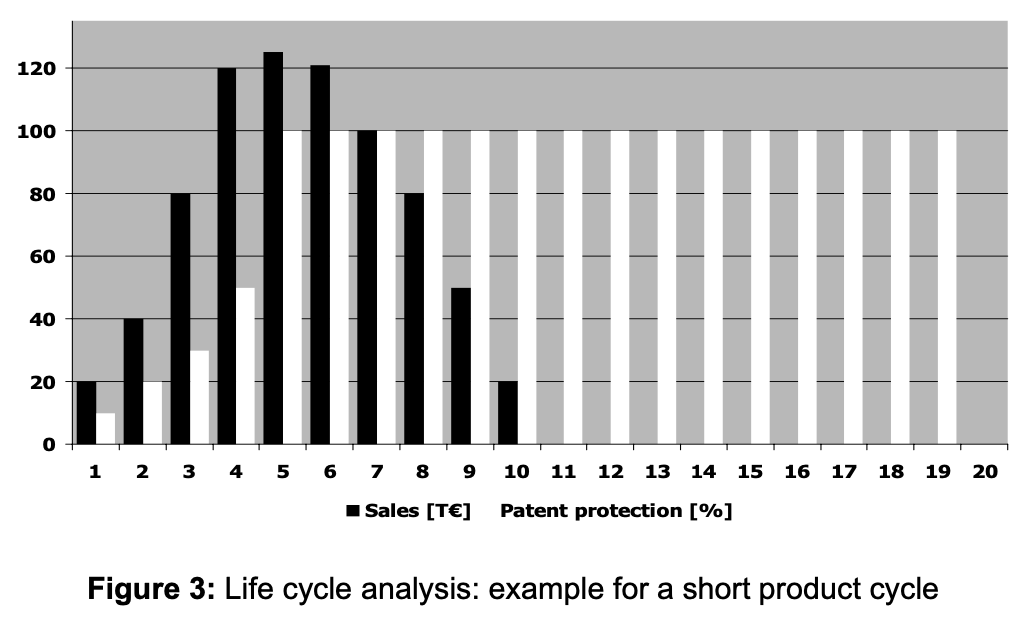
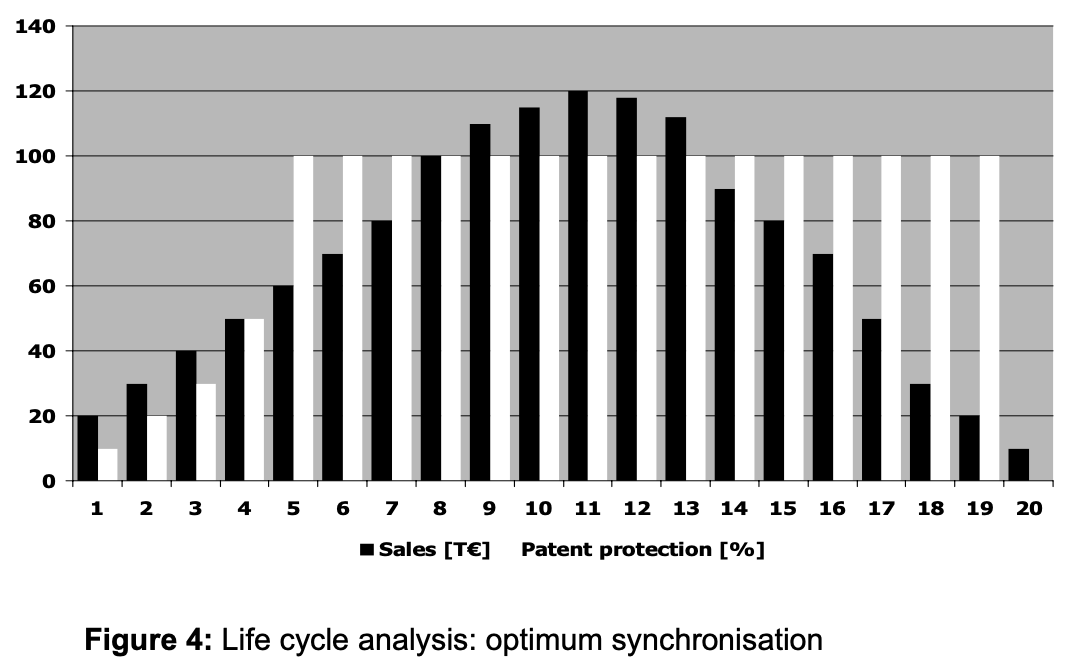
Life cycle analysis is an interesting tool for the visualisation of the connection of market mechanisms and patent factors. In addition, it is useful when evaluating the question whether to maintain or to abandon IP positions as it considers market- relevant aspects. However, for valuation purposes it gives only limited information as it does not reveal any causal interrelation between market success and patent protection.
Portfolio analysis
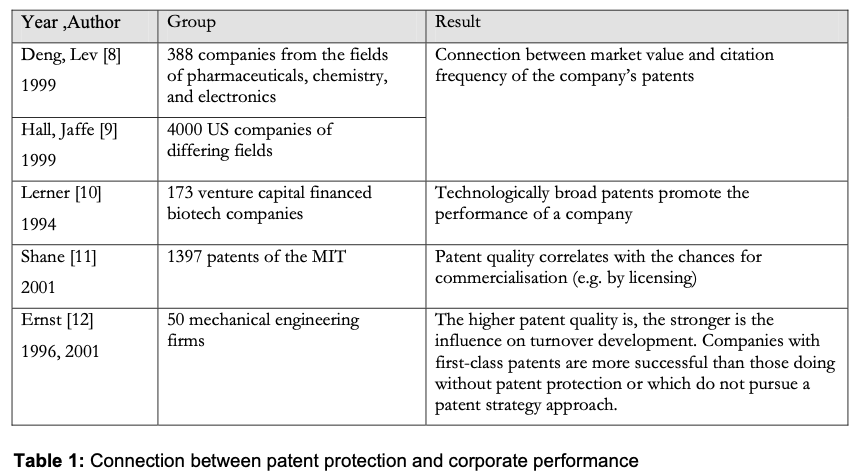
Systematic evaluation of patent information for the valuation of patent portfolios is a discipline at the interface of business administration and intellectual property law which has been gaining increased significance in the past years. Meanwhile, there exist a number of studies revealing a direct connection between patent protection and corporate performance (cf. Table 1):
In addition, in a further empirical examination that was carried out in 2003 at the Graduate School of Management in Vallendar, Ernst und Omland could show that a direct correlation exists between a professional patent management, technological leadership, and corporate performance, particularly considering ROI aspects [7].
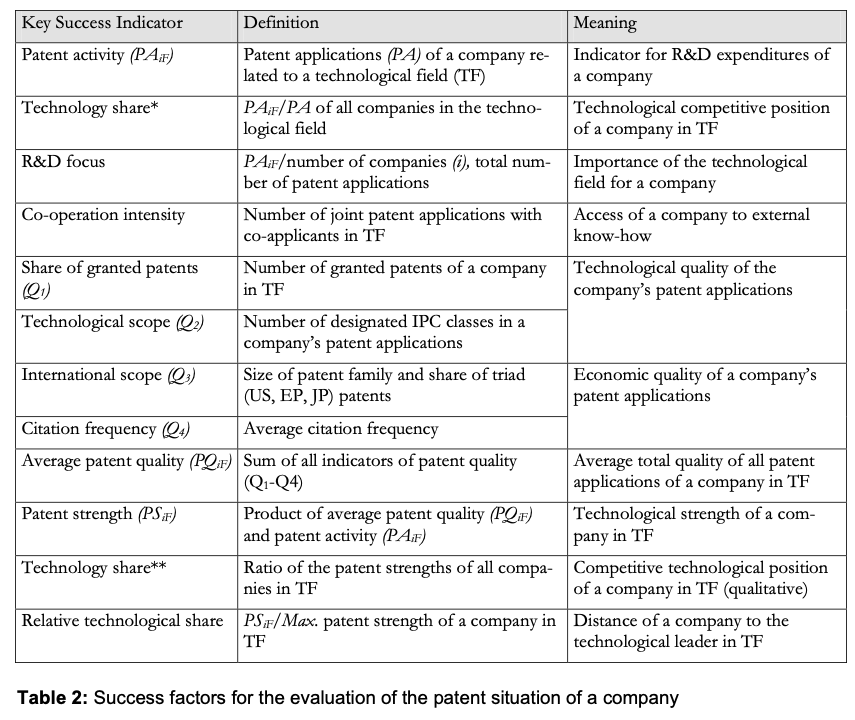
In doing so, the method of portfolio analysis is not new but it goes back to a model of the Boston Consulting Group from the late 1960ies, setting up a matrix of market share and market growth. In a patent portfolio analysis, success factors for the value of an IP portfolio of a company are deter- mined and compared to the ones of its competitors. Table 2 shows a number of success factors or „Key Success Indicators“, their definition from lit- erature and their meaning which have proven to be useful in describing the patent situation of a company in the past [13]. Of particular importance is the parameter „patent strength“ which is defined as the product of „patent quality“ and „patent ac- tivity“.
While patent activity stands for nothing else than the number of patent applications in a defined segment, various factors have influence on the parameter of patent quality [14].
- Ratio of granted and pending IP rights,
- International scope, usually related to the triad Europe, U.S., and Japan,
- Technological scope, usually focused on the number of IPC classes an IP right is assigned to, and
- Temporally weighted citation frequency in examination proceedings.
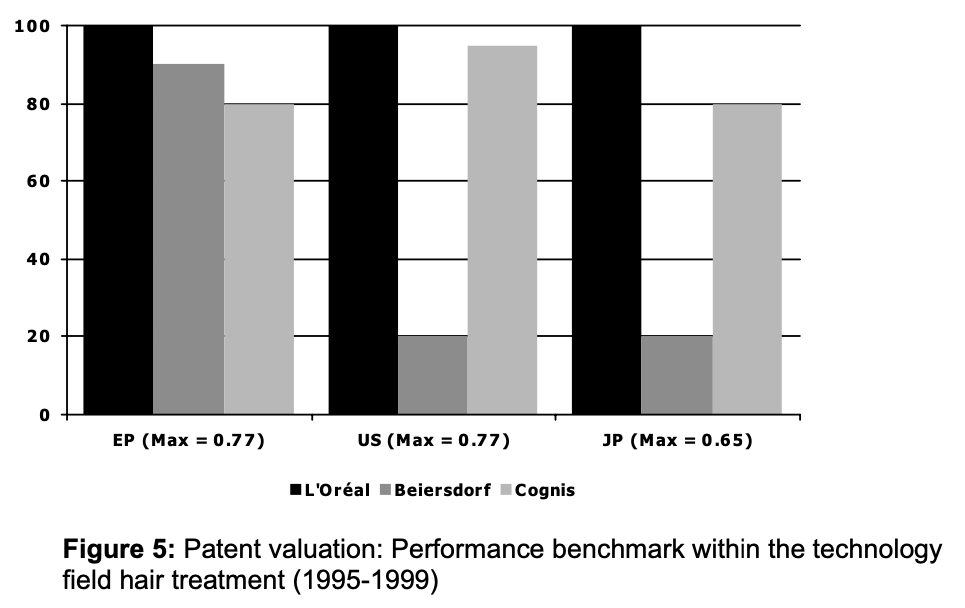
The following Figure 5 shows criteria for three companies (Beiersdorf, Cognis and L’Oréal), taken from a previous analysis of the market situation in the area of cosmetics covering the period 1995 to 1999:
- Number of European patents and patent applications
- Number of US patents and patent appli- cations
- Number of Japanese patents and patent applications
In the evaluation, the highest value reached is set at 100%, and the values of the other companies are related to it. For example, within 1995 to 1999 the French company L’Oréal has filed 77 % of its new patent applications either priority founding or in the course of the foreign-filing with the Euro- pean patent office, while this was true for the sec- ond company Cognis only in 60 % and for the re- maining third company Beiersdorf in 65 % of their cases. Consequently, the filing activity for the pa- rameter “Europe” was set to 100 % for L’Oréal and the other companies achieved percentages relatively to their share. This kind of presentation, which also can be done in a spider graph, allows a quick view on some of the main key success pa- rameters for patent strength and makes a compari- son between companies easy.
Patent portfolio analysis offers the advantage that the technological position of a company can be re- liably determined on the basis of objective infor- mation from public databases. In addition, this method is sufficiently validated by a multitude of empirical studies. Hence it is suitable for adding to the monetary valuation a second dimension, namely the technological position.
However, with respect to data gathering, data conversion into success indicators, as well as valuation and calibration, this method is techni- cally challenging and time-consuming. Further- more, it does not take into account legal factors, particularly concerning the enforceability of the considered IP rights.
The 3-dimensional valuation of IP rights
The monetary valuation of IP rights generically provides only pseudo-objective results. Techno- logical consideration as a second valuation dimen- sion according to the patent portfolio method would prove to be sufficiently valid but is techni- cally challenging. In addition, a legal consideration as a third valuation dimension is still outstanding. It seems that this does not take us any further to- ward a complete consideration and, particularly, a pragmatic approach for the three-dimensional valuation of patent portfolios.
In fact, however, the presented methods do contain all necessary tools to reach a solution.
In the valuation model presented below, mone- tary valuation according to the profit oriented ap- proach is combined with the technique of matrix consideration of portfolio valuation, and we will play through this model using the case of the ficti- tious product „Emulgade X“ mentioned in the be- ginning, the patent portfolio of which was as- signed a monetary value of 4.275 M€ (cf. above).
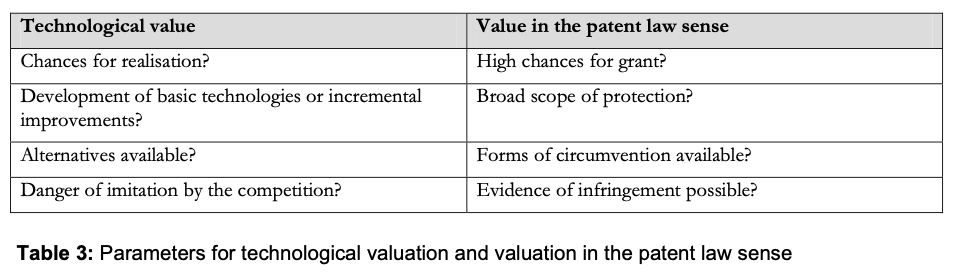
In the most simple case, firstly a co-ordinate grid is to be spanned, the axis are to be labelled „Technological value“ and „Value in the patent law sense“, which is followed by assigning to each of those two valuation dimensions a value on a scale from 0 to 100 in order to reach a positioning of the considered IP right in the diagram. The higher the co-ordinate is positioned in the upper right-hand corner, the higher is the value of the IP right. Much as a pragmatic approach is needed, this one would obviously be too short-sighted. Nevertheless, it is a suitable method in order to bring us a step closer to our goal. To this end, it is firstly necessary to dissect the two valuation meth- ods which span the co-ordinate grid into individual factors, as is exemplarily shown in Table 3 for 4 parameters in each case. The number and selection of the parameters are up to the evaluator, how- ever, one should take care of those parameters which may show an interaction, such as “scope of protection” and “chances for grant”: the broader the claims of a patent application are, the lower usually is the chance to have these claims granted without amendments. On the other hand, once the patent has become granted and valid, broad claims have a superior impact on the quality.
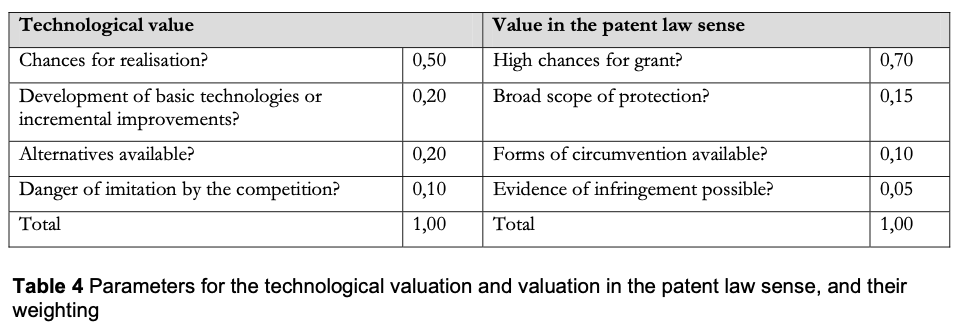
By compilation of target questions, on the one hand, it is possible to make transparent which fac- tors were consulted for the technological and, re- spectively, valuation of an IP right in the patent law sense. Furthermore, it is now easier to assign a value to each parameter. However, before this happens we need to consider that the factors con- tribute to the individual valuation dimension to a varying degree – thus they need to be weighted as shown in Table 4.
Now, we can start evaluating the individual fac- tors. To simplify matters it shall be assumed that the product is protected by a single patent only. We shall further assume that the fictitious product Emulgade X represents an emulsifier, particularly suitable for the cosmetic industry, and is com- posed of components A and B, wherein it is re- quired for admix the two components above a par- ticular temperature, and to cool the mixture down afterwards. Incidentally, the product shall be util- ised in the emulsification of additives, which are applied in very different areas of use, such as in leather technology and as herbicides. There are a number of other emulsifiers in the market, but in comparison with Emulgade X they require larger quantities. Therefore, after launch, this product has established itself quickly in the market and bit- ten off a considerable market share from the com- petition. It is therefore no wonder that competi- tors are now trying with all means to destroy the pertaining European patent in the course of the opposition proceedings.
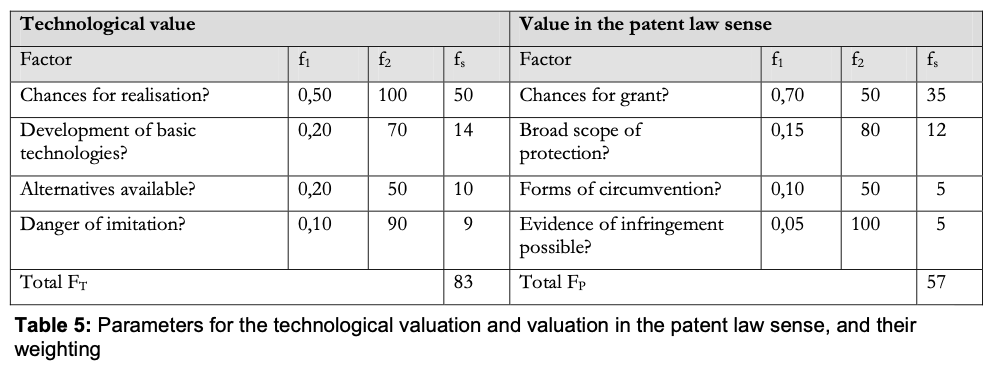
After the product is introduced in the market, the factor „Chances for Realisation“ needs to be set at 100 points in a scale from 0 to 100 points. According to the quick market success much speaks for it that the product is rather the result of a basic development than of an incremental im- provement (70 points). Alternatives do exist, but as they constitute inferior forms of embodiment (50 points), this would result in a relatively high danger of imitation by the competitors (90 points). The patent is under opposition. As man is known to be in God’s hand at court and at high sea, we shall not give more than 50 points to Chances for Grant. If the claims are not limited to the literal mixture of products AA and BB, but refer to the more generic groups A and B, and also cover the method of production and the different uses, we can certainly give 80 points to Scope of Protection. Forms of Circumvention can not safely be ex- cluded (50 points), but by way of analysis of the finished products the issue of possible infringe- ment can be easily clarified (100 points).
In the following Table 5 there are shown the factors, their weighting (f1) and evaluation (f2) as well as the values resulting by multiplication (fs), the result of which are the final values FT and FP for the two valuation dimensions.
Hence the technological value of the IP right is clearly higher than the value in the patent law sense, which can be explained by the fact that the patent-protected product was already introduced into the market (strong impulse for the techno- logical value), the pertaining patent, however, is under opposition (which decreases the value in the patent law sense). Obviously, this matrix can only provide a momentary snap-shot: for example, if the product needs to be taken off the market be- cause it might be infringing regulatory provisions, the technological value instantly approaches zero. If the patent survives the opposition/appeal pro- ceedings without any amendments, the factor in the patent law sense increases to almost 100 %. Obviously also this valuation method is flawed by the fact that it conveys only a pseudo-objectivity, and a „fine-tuning“ of the result is possible by making changes to the absolute value or the weighting.
However, due to the fixed determination of the valuation factors and their weighting, this danger is limited because every condition and every weight- ing can be questioned in case of doubt. With a suf- ficient number of parameters, the errors resulting from too pessimistic or too optimistic expectations usually level each other out.
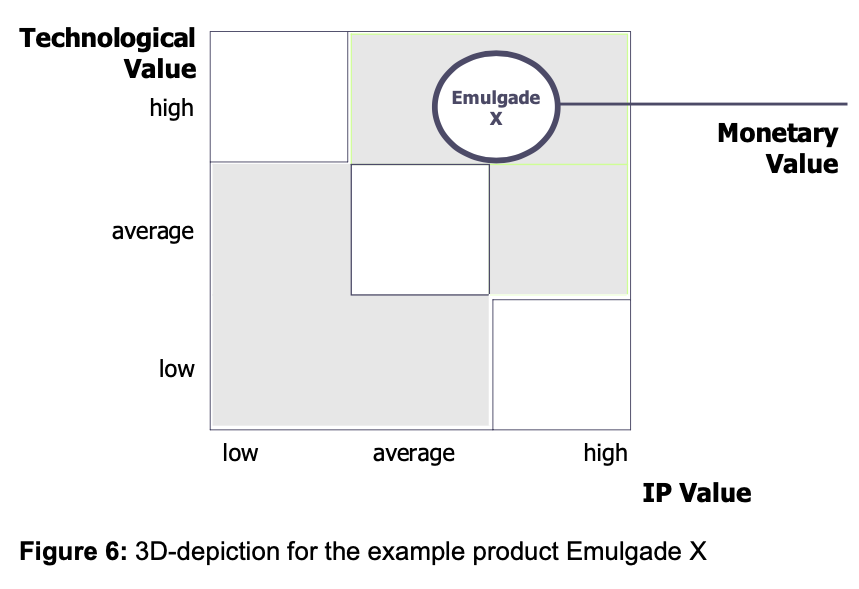
The result is illustrated in Figure 6 below. Techno- logical valuation and valuation in the patent law sense span a coordinate grid in which the consid- ered IP right takes its place. The third dimension – i.e. the previous monetary valuation is symbolised by the size of the circle: the higher the monetary valuation, the larger the diameter. However, this approach starts to become interesting when com- paring different products this way, as is shown in Figure 7.
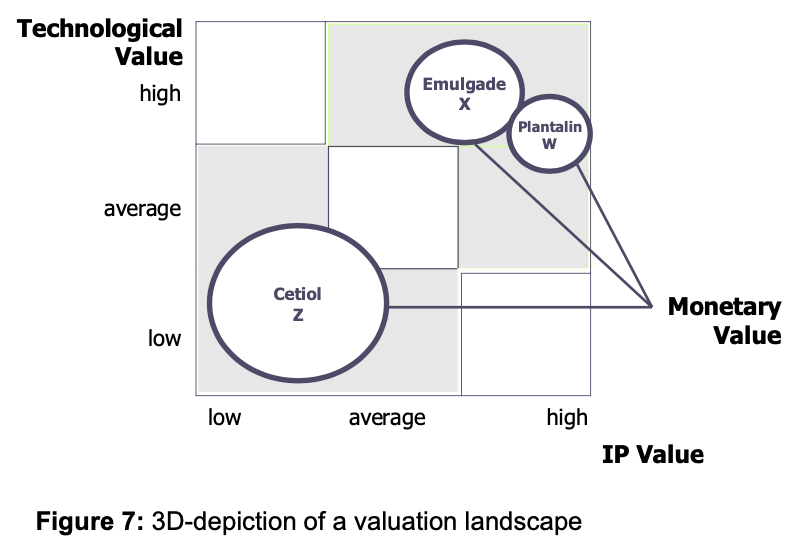
The fictitious product Cetiol Z is positioned in the lowest quadrant and thus possesses both a very low technological value and a low value in the pat- ent law sense. Even so, it has been assigned a monetary value twice as high as the value of the product Emulgade X. This may signify that the product has a very high turnover which is depend- ent on patent protection only to a small degree. On the other hand, it may also be an indication that the assumptions in the monetary valuation were too optimistic. Conversely, the fictitious product Plantalin W possesses both a very high technological valuation and a high valuation in the patent law sense, however, its monetary value is considerably lower than the one for Emulgade X. Provided that the assumptions for the valuation were correct, such picture is typical for products in their first two phases in their life cycle. A coherent result is always available in case those technologi- cally first-class patents with a good valuation in the patent law sense also show a comparably positive monetary valuation. In case of divergence the facts need to be questioned.
Summary
In the monetary valuation in Euro and Cent we will have to take into account that the determina- tion of value is subjective and may differ depend- ing on the assumption. This problem is, in a man- ner of speaking, sui generis, i.e. it is left to the evaluator which parameters he wishes to consult for the determination of value, as long as these are transparent and are understood and accepted by the counterpart at whom this evaluation is di- rected. Among the business-oriented approaches, the patent portfolio valuation on the basis of in- formation retrieved from patent data bases is con- vincing due to its comparatively high objectivity. However, high technical efforts and the lack of a component in the patent law sense are disadvan- tages.
In order to meet the expectation to carry out a three-dimensional valuation of IP rights from a monetary, technological, and legal perspective with a justifiable effort, a two-dimensional matrix con- sideration of technological value and value in the patent law sense might be suitable, in which each of these dimensions is dissected into individual valuation factors, which are weighted and assigned a value. This two-dimensional depiction in a coordinate grid can be supplemented by the mone- tary valuation as a third dimension, in which a cost-oriented approach offers most advantages among the different methods.
This approach has the charm that it can be car- ried out with a manageable effort and has been successfully implemented in 2005 as an important strategy and management tool within the Cognis Holding. Still it must be clear that it does not pro- vide an objective picture either, a pseudo-objective picture at best and a snapshot in addition. Because of the large number of different valuation factors and the special transparency of the calculation ba- sis connected with this method, preconditions are given that a high degree of acceptance can be reached between the evaluator and the person the valuation is directed at – which is still the decisive requirement that an IP right valuation fulfils its meaning.
References
[1] Cardoza, K., Basara, J., Cooper, L. and Con- roy, R. (2006), The power of intangible assets: an analysis of the S&P 500, Les Nouvelles, pp 3- 7.
[2] Khoury, S. (2001), Valuing intangibles? Con- sider the technology factor method, Les Nouvelles, pp 87-90.
[3] Rings, R. (2000), Patentbewertung – Methoden und Faktoren zur Wertermittlung technischer Schutzrechte, GRUR, pp 839-848.
[4] Fabry, B. and Ernst, H. (2005), How to make investors understand the value of IP assets, Les Nouvelles, pp 201-208.
[5] Poredda, A. and Wildschütz, S. (2004), Pat- ent valuation – a controlled market share approach, Les Nouvelles, pp 77-85.
[6] Walborn, B. (1999), Word Licensing Report No.3, p 19.
[7] Ernst, H. and Omland, N. (2005), Patentma- nagement und Unternehmenserfolg – eine empirische Analyse, Mitteilungen, pp 402-406.
[8] Deng, Z., Lev, B. and Narin,F. (1999), Sci- ence and technology as predictors of stock perform- ance, Financial Analysts Journal, pp 20-32.
[9] Hall, B., Jaffe, A. and Taijtenberg, M. (2005), Market value and patent citations, RAND J. Economics, 36(1), p 16-38.
[10] Lerner,J.(1994),Theimportanceofpatentscope: en empirical analysis, RAND J. Economics, 25(2), pp 319-333.
[11] Shane, S. (2005), Technological opportunities and new firm creation, Management Sci., 47(2), pp 205-220.
[12] Ernst, H. (2001), Patent applications and subse- quent changes of performance, Res. Pol., 30, pp 143-157.
[13] Ernst,H.(1999),Evaluationofdynamictechno- logical developments by means of patent data, in: Brockhoff, K., Chakrabarti, A.K. and Hauschild, J. (ed.), The dynamics of innovation strategies and managerial implications, Berlin, Springer Verlag.
[14] Austin, D.H. (1993), An event-study approach to measuring innovative output: the case of biotechnol- ogy, American Economy Review, Vol. 83, pp 253-258.