Bioplastics Tipping Point: drop-in or non-drop-in?
The forecasted bioplastic production capacity has signaled a strong growth in the next years, but with higher participation of drop-ins. Drop-in bioplastics are nonbiodegradable materials, identical to their fossil counterparts although obtained from renewable raw materials. The present paper examines why drop-ins have presented growth rates higher than non-drop-ins, analyzing some critical factors of their adoption by end users and whether the bioplastics tipping point has been reached. This comparison between drop-in and non-drop-in bioplastic innovation dynamics, which involves investment and complementary assets, will contribute to a better understanding of the critical factors that lead to bioplastics tipping point.
1 Introduction
Currently, there is a growing interest on bioplastics development encompassing both innovative products and production processes. Bioplastic production is favored as an alternative solution to the use of oil as raw material, and also because of the demand of products which generate a smaller environmental footprint. Bioplastics are polymers obtained from biomass, renewable raw materials such as: corn, sugar cane, beet, cellulose, waste and others. They are alternative materials to the conventional plastics obtained from fossil raw materials.
Recently it is being discussed whether the bioplastics have reached the so-called tipping point. The tipping point achievement occurs when high adoption rates are observed in a very short time, similar to an epidemics outbreak (Gladwell, 2000). Some experts argue that the accumulation of resources and skills used in the development of these products associated to the high number of companies involved sets a critical condition for the outbreak of the tipping point (ICIS, 2012).
Bioplastics are biobased and can be biodegradable or non-biodegradable (Table 1). When degradation is caused by biological activity, especially by the enzymatic action of microorganisms, it is called biodegradation. The process of biodegradation depends on the environmental conditions (e.g. location or temperature) and on the material itself. Therefore, the biodegradability of a plastic material is not dependent only on the source of raw material. 100 percent renewably sourced materials can be entirely resistant to biodegradation. Similarly, fossil-based plastics can be biodegradable (European Bioplastics Association, 2012).
Bioplastics production capacity in 2011 was around 1.1 million tonnes, representing less than 1% of the global production capacity of conventional plastics. Despite its low market share, it is forecasted that the production will grow to nearly 6 million tonnes by 2016 (European Bioplastics Association, 2012), which represents an annual growth of 31%. This means that current capacity will have a fivefold growth within five years (Figure 1).
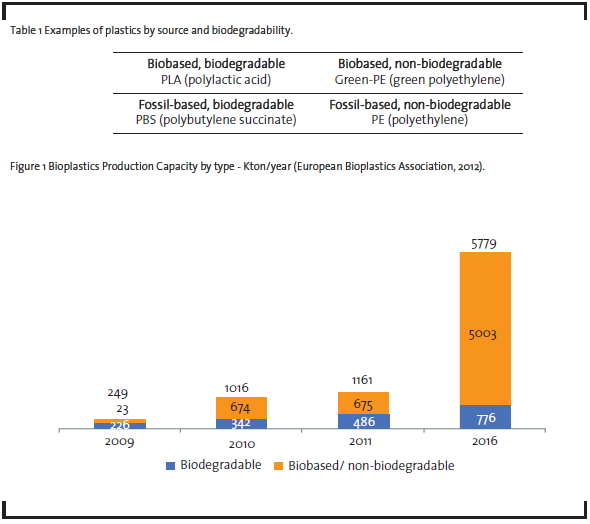
The strongest area of growth is expected to be non-biodegradable products, such as biobased polyethylene terephthalate (PET) and polyethylene (PE), among the drop-in solutions. The term drop-in was initially used for biofuels which specifications allow their market application with existing infrastructure and no relevant investments in specific assets. In this context, drop-in plastics are non-biodegradable materials, obtained from renewable raw materials that present identical technical properties to their fossil counterparts. Drop-in solutions represent the single largest sector of the global bioplastics production. They are (partly) biobased, nonbiodegradable commodity plastics such as PE, PET, or PP, and can be easily recycled along their conventional counterparts. While drop-ins are well known by market, non-drop-in plastics are different and alternative materials, generally applied to niches due to specific properties. The inclusion of drop-in bioplastics in the forecasted global bioplastics production capacity is due to the recent announcement of their development and production with active participation of the end users as investors and/or adopters. The end users are companies that buy manufactured plastics, mostly packaging materials, including also the industries of consumer goods, personal care, cleaning materials, toys, retail, etc.
The main objective of this paper is to discuss the reasons that lead to a higher participation of drop-in materials rather than non-drop-in in the forecasted bioplastics production and the decisive role of the end users. To this end, we will analyze two bioplastic examples: the first, polylactic acid (PLA), non-drop-in, which has been commercially produced by Natureworks (140,000 tonnes/year) and the second, green polyethylene (green PE), drop in, produced by Braskem in a Brazil-based facility with production capacity of 200,000 tonnes/ year. PLA and green PE examples were chosen because they are under commercial production and both have strong representation in the current and future demand of bioplastics. Other important players in the PLA development are Purac (acid lactic producer) with a plant of 75,000 tonnes/year and Futerro, a joint venture between Galactic (lactic acid producer) and Total (oil and petrochemical company), but without commercial production (European Bioplastics Association, 2012).
2 Drop-in Participation in bioplastics tipping point
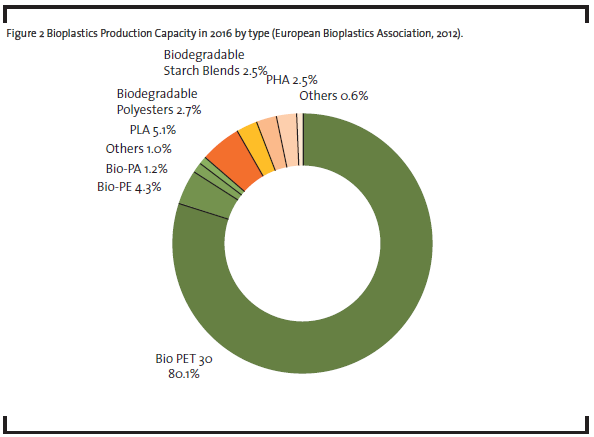
European Bioplastics Association has forecasted that drop-in materials will represent 86% of the global bioplastics production capacity by 2016 (European Bioplastics Association, 2012) with especial participation of green PET and green PE, as shown in Figure 2. Green PET alone will respond for 80% of the forecasted capacity, driven by the significant demand for bottle manufacturing, which shows the important role of the end users in the bioplastics adoption process. Two giants in the beverage soft drink industry have already been using PET which accounts for up to 30% of renewable content. Green PET (named as bio-PET 30 in the graphic) is produced from monoethylene glycol (MEG) obtained from biomass (ICIS, 2012).
It is important to highlight some elements that have contributed for the greater participation of drop- in materials:
- their use represents a small risk for end users, because their technical properties and manufacturing processes are already known by the value chain
- it is not necessary to adjust the plastic manufacturing machinery, reducing investment and generating lower switching costs for processors and end users, because it does not require new specialized complementary assets
- lower recycling impact, because these materials are not depicted as contaminants in the recycling of conventional plastics.
Due to the above mentioned reasons, it is expected that the drop-in materials adoption will take less time than the adoption of non-drop-in ones. However, drop-ins are not biodegradable. It is important to ask then: what is more important for end users as value proposition: biodegradability or the source of the material? Additionally, some end users have signaled that bioplastic adoption does not depend only on those factors. Life cycle assessment (LCA) and cost are also important factors taken into consideration. Biodegradable materials may not be suitable from the environmental point of view if their production and purification processes consume high amount of water and energy.
Some years ago, the polylactic acid (PLA), biodegradable non-drop-in material, was mentioned by companies, researchers and market experts as one of the bioplastics most likely to succeed. In 1997 the project Dow Cargill was announced. It consisted of a joint venture between the Dow Company, one of the largest petrochemical companies, producing conventional plastics and Cargill Company, a leader in agribusiness and food production giving birth to Natureworks, which promised to bring into the market high volumes of the first biodegradable plastic in a very short time (Brito et al., 2011). PLA, produced by polymerization of lactic acid obtained via fermentation of carbohydrates, is an apparently promising plastic, but although its market has grown, it still did not reach an expressive volume with demand remaining below expectations (Chemical Week, 2011).
Drop-in green PE trajectory shows different signals compared to PLA. The commercial production of this product obtained from sugarcane ethanol started in 2010 and several end users (e.g.: Johnson & Johnson, Nestle, Toyota, Danone, P&G) have adopted it (Braskem, 2012a). It is believed that much of its production is already compromised through commercial agreements and contracts (Braskem, 2012b). Braskem strategy was to get closer to end users in order to avoid the risk of the material being sold as conventional polyethylene. Another important point is observability (Rogers, 2003), which measures the degree to which the results of an innovation are observable to other potential users. The easier the perception of the new technology adoption process, the higher will be the diffusion speed among other users.
Concerning biomass utilization at an industrial scale, apart from availability, other determining factors such transport and storage should be considered due to the large amounts of materials required. (Frohling et al., 2011). Regions such as Brazil, United States, China, India, Thailand and others countries, which produce large quantities and different varieties of biomass feedstock under favorable climate conditions, offer good conditions for biofuels and bioprodutcs production. Therefore, these countries could be seen as strong candidates to receive investments in bioplastics production (DOE Biomass Program, 2005; IEA, 2011; Iles and Martin, 2013).
3 Critical Factors for PLA (biodegradable, non-drop in) and Green PE (nonbiodegradable, drop-in) adoption by end users
In this section, some factors frequently pointed out as critical on new product adoption (Rogers, 2003; Porter, 1980) are explored to discuss the role of end users in the bioplastics development, considering if the new material is a drop-in or nondrop- in solution. Three critical factors for the adoption of PLA (non-drop-in) and green PE (drop-in) – technical and process properties, end user switching cost and impact on recycling and life cycle assessment (LCA) – are described below.
3.1 Technical and process properties
The adoption of a new material certainly depends on end user perception of its technical advantages (Rogers, 2003), which, in this case, favors the drop-in solution green PE, because it presents identical properties compared to its conventional counterpart. PLA appears as a “new” product to be explored and presents some inadequate properties for some applications, as for example, low crystallization rate, low resistance to impact, and low thermal resistance. However, these properties can be improved using additives (Brito et al., 2011).
The complementors players (Nalebuff e Brandeburger, 1995), that do not produce the resin, but are inserted in the production chain, mainly as blends and additives suppliers, have become strategic to improve products and fill in important gaps in the new applications development and improvement of current ones.
A good illustration of complementors role in a plastic development was observed in the polypropylene (PP) trajectory. Initially, the product had presented limited technical properties narrowing market applications. Its production process was complex and inefficient involving four steps. However, new additives and catalysts, improving technical and process properties, such as mechanical resistance and UV protection, allowed PP to spread to a wide range of applications. Besides product improvements, the production process advanced to only one step, reducing costs and transforming PP in one of the most produced resins in the world (Bomtempo, 1994; Landau, 1998).
Additive manufacturers are engaged in developing solutions for PLA chronic problems such as high susceptibility to degradation and loss of properties during processing. Some chemical companies and blend suppliers such as Cereplast, Natureplast, Polyone, Arkema, Sukano and others (Plastics Technology, 2011) are among current complementors in addition to traditional players such as Dow, Basf and Du Pont.
Biodegradability is interesting for some industrial sectors such as food market, but it does not constitute an advantage in itself, being necessary to add some other technical improvements. Companies leading with PLA are focusing on new additives and blends developments (Shen et al., 2009) to foster PLA use in semi-durable goods. An example is PLA use in smartphones developed by Dandelion Research Ltd from Hong Kong, formed by 90% Natureworks (Ingeo) PLA blend with 10% of other non-fossil materials (Plastics Technology, 2011).
PLA and its production process have improved over the last fifteen years, since the beginning of the Dow Cargill Project in 1997, as indicated by the emergence of a second generation of PLA. This generation was developed by Purac Company, a global leader in lactic acid, the main raw material for PLA production, which improved some of the product characteristics. The efforts focused on reducing the number of the production steps and improving material´s quality, such as higher thermal resistance, which can enable new possibilities for PLA use (Purac, 2012).
3.2 End User Switching Costs
The main end user switching costs (Porter, 1980), when considering the substitution of a known conventional plastic by a non-drop-in material are: (a) increased dependence on supply, frequently represented by a single producer, which reduces the flexibility of a possible change of supplier, (b) investment in specific assets (Teece, 1986) and (c) learning time (Leonard-Barton, 1995).
Unlike conventional polymers, the new materials require an effort from manufacturers and users to learn about their properties and develop applications. Very likely, it will demand that suppliers develop new machinery, equipment and additives. Thus, it is necessary to promote attraction and mobilization efforts of those agents in order to create an innovation agenda that encourages the nondrop- ins development.
Plastics conversion generally involves specific machines that represent significant costs for converters. When an important end user adopts the new material, major security is perceived by the market. When more companies adopt a new material, the greater is the interest in developing solutions to reduce end user switching costs. A good practice example of end user influence on adoption was the introduction of PET bottle in the soft drink industry. In the eighties, two liter PET plastic bottle was introduced by Coca-Cola, changing the pattern of packaging in the industry. Therefore, PET has become one of the most important resins in beverage industry (Coca-Cola, 2012b; Food and Beverage Packaging, 2009).
Some factors mean high end user switching costs for PLA adoption. Current PLA production process involves obtaining lactide, the monomer produced from lactic acid. Lactic acid is the result of sugar fermentation and represents around 80% of the variable cost of PLA production, thus PLA may be considered a sugar in polymer form (Wolf, 2005). Strong sugar price fluctuations (Indexmundi, 2012) has been an obstacle to the creation of a favorable environment to PLA adoption, since one of its appeals would be to escape from the instability observed in conventional plastics which follow oil prices. However, this risk is reduced in the case of drop-ins because the cost of reversing the use to conventional polymer is smaller since they present identical properties.
PLA adoption by manufacturers implies in changes or adjustments of machinery and consequently in investment and training, increasing the end user switching costs. The learning time also contributes to increase the new users’ risk perception (Rogers, 2003).
Green PE adoption seems to be a process quite different when compared to PLA. Braskem, as a major polymer manufacturer, has accumulated technological expertise in the production of conventional PE, and accesses its own research and development (R&D) structure to develop applications, which facilitates the interaction with converters and end users. The green PE business model presents significant economy of scope, because it is within a conventional PE manufacturing organization that has complementary assets of administration, logistics and application R&D. Thus, when drop-ins are produced by the same conventional polymer manufacturer its development will be facilitated by the presence of the complementary assets.
It is important to note that the insertion of green PE into the market was facilitated, because its technical properties were already widely known by end users and complementors, once for many decades polyethylenes have been the thermoplastics with higher demand (Shen et al., 2009). From Braskem point of view, the greatest changes occurred on raw material supply due to specific logistics infrastructure and assets of ethanol. Regarding to end users, the company has promoted adjustments over its marketing and sales structure, as the formation of dedicated sale and technical assistance teams (Braskem, 2012b).
3.3 Impact on Recycling and life cycle assessment (LCA)
The development of an industrial recycling infrastructure is regarded as an important pre-condition for bioplastic market. The current recycling systems were developed to identify and process conventional plastics, such as PET, PP and PE and therefore, non-drop-in bioplastics, such as PLA, can be seen as contaminants. For example, PLA requires specific composting conditions (temperature and humidity) to degrade within several months and appropriate collection, sorting and composting systems must be employed to decompose. Although current capacity of PLA does not have enough scale yet to stimulate its recycling (Jim Jem et al., 2010), one initiative called LOOPLA, led by Galactic with other companies related to PLA, such as Natureworks, promises lactic acid recovery from post-consumer PLA employing depolymerization process (LOOPLA, 2013).
Other important question to be considered is the life cycle assessment (LCA). A perspective for bioprocess progress is the so-called “process intensification” which focuses on the development of processes with the smallest environmental footprint (Sanders et al., 2012). The environmental performance and production cost of lactic acid can be improved with new processes using membranes (Pal P. et al., 2009), reducing PLA environmental footprint and production costs throughout the reduction of high levels of water and energy consumption in the current purification process.
Currently, the industry is using additives to increase the life time and enable other PLA applications (Plastics Technology, 2011). Thus, the biodegradability concept, which could encourage greater utilization of this material, was partially abandoned. An effort to approach the environmental issue from other ways in order to emphasize the PLA advantages has been observed (Plastics Today, 2009). The use of LCA as a tool to measure the product sustainability and identify process steps that can be improved shows the major players’ interest to enhance PLA competitive advantage in relation to the environment. According to Braskem, green PE presents LCA advantages when compared to the conventional polyethylene. Green PE captures 2.5 tonnes of CO2 per tonne of product, which, together with social aspects of sugarcane production, is a requirement from end users (Braskem, 2012a). The factors analyzed above (summarized in Table 2) can indicate a relative very short time horizon for green PE being “perceived” and adopted by the market (Braskem, 2012b).
4 Conclusions
This article explored the bioplastics development in a context of transition for more participation of renewable resources in economy. This scenario is composed by many drivers, such as oil prices and fossil raw material dependence, environmental and technological issues, biomass availability, regional legislation and infrastructure, non-fossil raw materials costs and availability (Sanders and Langeveld, 2010; IEA, 2007). These drivers should be identified to allow actors to understand the development process and to prioritize actions and strategies. Players from different industries and knowledge basis participate in bioplastics development (Shen et al., 2009). Some examples are: petrochemicals and chemicals companies (e.g.: Dow, Braskem, Du Pont, DSM, Basf), agribusiness and/or ingredients and food companies (e.g.: Cargill, Purac, Galactic) and end users (e.g.: Coca-Cola, Pepsi, Walmart, P&G, Toyota). Among them, we outline the end users role in adoption of drop-ins and nondrop- ins solutions. Their perspective has pointed out critical factors explored in this article.
Three critical aspects of bioplastics adoption by end users were analyzed: technical properties and processing, switching cost and the impact on recycling and LCA. Significant progress in bioprocesses and bioproducts are forecasted, such as better technical properties and processability and smaller environmental footprint, which will certainly increase the non-drop-in materials competitiveness. The end user switching costs, directly proportional to the need of investment for material adoption, reflects the acquisition or adjustments costs of complementary specialized assets. Drop-ins require investment concentrated on the supply side, related to the supply and logistics of new raw materials. Non-drop-ins require investments in specific assets on both supply (feedstock) and demand (processors and end users) sides.
It should be enhanced the decisive role of the end users on the selection of the bioplastics that will be produced and adopted by the market. Coca- Cola has recently announced cooperation with Gevo, Virent and Avantium, companies linked to bioproducts and bioprocesses, in order to develop renewable alternatives for PET, illustrating the strategic position of end users in shaping the bioplastics future. This strategic position is very clear in the case of Coca-Cola. From the three projects the company is supporting, two (Gevo and Virent) which aim at the production of a renewable PET from a renewable para-xylene, so a drop-in plastic, and the third (Avantium) aims at developing a new material -PEF- as a non-drop-in PET substitute (Coca Cola, 2012b).
Finally, the greater drop-ins participation on the current stage of bioplastics trajectory can be explained by the smaller adoption barriers on the demand side, once the required investments are relatively low and converters and end users can use either conventional plastics as bioplastics, since both have the same properties. However, it is not possible to predict if drop-ins will have a greater participation than non-drop-ins in the long term. It should be noted that the greater participation of drop-ins is due to the maturity level of the bioplastics industry, still in its infancy, surrounded by uncertainties. Thus, agents tend to choose projects with smaller risks and faster execution. We believe that the conditions for a greater non-drop-ins participation, such as the increasing number of participants in the innovation agenda as complementors, knowledge accumulation and the vital end user participation on development projects are being created.
It is not clear that bioplastics have already reached its tipping point. But in recent years the introduction of drop-ins seems to have contributed to accelerate the bioplastics diffusion. Remains to understand how non-drop-ins can overcome the difficulties of the adoption process showed up now and contribute to the tipping point achievement and if the emerging bioplastics industry will be dominated by drop-ins in the future.
References
Bomtempo, J. V. (1994): Innovation et organization: le cas de l´industrie des polymères, Doctorate thesis, École des Mines de Paris. Paris, France.
Brandenburger, A. M., Nalebuff, B. J. (1995): The right game: Use of game theory to shape strategy, Harvard Business Review, 73 (4) pp.57-81.
Braskem (2012a) : Plástico Verde, available at http://www.braskem.com.br/plasticoverde/, accessed 10 November 2012.
Braskem (2012b). Interview with Antônio Morschbacker, Innovation and Technology executive, held on 30 November 2012.
Brito, G. F., Agrawal, P., Araújo, E. M., Mélo, T.J.L. (2011): Biopolímeros, Polímeros Biodegradáveis e Polímeros Verdes, Revista Eletrônica de Materiais e Processos, 6 (2), pp. 127-139.
Chemical Week (2011): Renewables, available at http://www.chemweek.com/sections/cover_story/Renewables_34629.html, accessed 12 September 2012.
Coca Cola (2012a): Coca-Cola bottles history, available at http://www.coca-cola.co.uk/125/cocacola-bottles-history.html, accessed 05 December 2012.
Coca Cola (2012b): Coca Cola announces partnerships to develop commercial solutions for plastic bottles, available at http://www.coca-colacompany.com/media-center/press-releases/thecoca-cola-company-announces-partnershipsto-develop-commercial-solutions-for-plastic-bottles-made-entirely-from-plants, accessed 05 December 2012.
DOE Biomass Program (2005): Biomass as Feedstock for a Bioenergy and Bioproducts Industry: The Technical Feasibility of A Billion-Ton Annual Supply, available at http://www.eere.energy.gov/biomass/publications.html, accessed 20 July 2013.
European Bioplastics Association (2012): Labelling, logos, charts, available at http://en.europeanbioplastics.org/press/press-pictures/labellinglogos-charts/, accessed 20 November 2012.
Food and Beverage Packaging (2009): Timeline 50 years of packaging innovations, available at http://www.foodandbeveragepackaging.com/articles/83980-timeline-50-years-of-packaginginnovations, accessed 05 December 2012.
Fröhling, M., Schweinle, J., Meyer, J.-C., Schultmann, F. (2011): Logistics of Renewable Raw Materials, in: Ulber, R., Sell, D., Hirth, T. (ed.), New Feedstocks for the Chemical Industry, Wiley-VCH Verlag GmbH & Co. KGaA, Weinheim, Germany.
Gladwell, M. (2000): The tipping point: How little things can make a big difference, Little, Brown and Co, New York.
ICIS (2012): US biobased chemicals at a tipping point, available at http://www.icis.com/blogs/greenchemicals/2012/09/us-bio-based-chemicals-ata-tr.html, accessed 20 November 2012.
ICIS (2011): Battle of the Bioplastics, available at http://www.icis.com/blogs/green-chemicals/2011/03/battle-of-the-bioplastic-bottl.html, accessed 25 November 2012.
Indexmundi (2012): Sugar Prices, available at http://www.indexmundi.com/commodities/?commodity=sugar, accessed 10 December 2012.
IEA – International Energy Agency (2011): Technology Roadmap: Biofuels for Transport, available at http://www.iea.org/publications/freepublications/publication/biofuels_roadmap.pdf, accessed 20 July 2013.
IEA – International Energy Agency (2007): Bioenergy Project Development and Biomass Supply, available at http://www.iea.org/publications/freepublications/publication/biomass.pdf, accessed 20 July 2013.
Iles, A. , Martin, A. (2013): Expanding bioplastics production: sustainable business innovation in the chemical industry, Journal of Cleaner Production, 45, pp. 38–49.
Jim Jem, K., van der Pol, J.F., de Vos, S. (2010): Microbial Lactic Acid, Its Polymer Poly(lactic acid) and Their Industrial Applications, Plastics from Bacteria Microbiology Monographs ,14, pp. 323-346.
Landau, R. (1998): The Process of Innovation in the Chemical Industry, in: Chemicals and long term growth: insights from chemical industry, John Wiley & Sons, Inc, New York, pp. 162-179.
Leonard-Barton, D. (1995): Wellsprings of Knowledge: Building and Sustaining the Sources of Innovation, Harvard Business School Press, Boston.
LOOPLA (2013): Who we are?, available at http://www.loopla.org/about/about.htm, accessed 10 September 2013.
Pal, P., Sikder, J., Roy, S., Giorno, L. (2009): Process intensification in lactic acid production: a review of membrane based processes, Chemical Engineering and Processing, 48, pp.1549-1559.
Plastics Technology (2011): Materials additives blends take PLA upscale, available at http://www.ptonline.com/articles/materials-additives-blendstake- pla-upscale, accessed 10 November 2011.
Porter, M. E (1980): Competitive Strategy: Techniques for Analyzing Industries and Competitors, The Free Press, New York.
Plastics Today (2009): Can PLA take next big step?, available at http://www.plasticstoday.com/articles/can-pla-take-next-big-step, accessed 22 July 2012.
Purac (2012): Presentations, available at http://www.csmglobal.com/Corporate/Investor_Relations/Publications/Presentations.aspx, accessed 20 November 2012.
Rogers, E. M. (2003): Diffusion of Innovations, 5th ed, The Free Press, New York.
Sanders, J.P.M., Clark, J.H. , Harmsen G.J., Heeres, H.J., Heijnen, J.J., Kersten, S.R.A. , van Swaaij, W.P.M., Moulijn J.A. (2012): Process intensification in the future production of base chemicals from biomass, Chemical Engineering and Processing, 51, pp.117-136.
Sanders, J.P.M., Langeveld J.W.A. (2010): Introduction, in: Langeveld J.W.A., Meeusen M., Sanders J. (ed.), The Biobased Economy: Biofuels, Materials and Chemicals in the post oil Era, Earthscan, Bristol, pp. 3-18.
Shen L, Haufe, J., Patel. M.K. (2009): Product Overview and Market Projection of Emerging Biobased Plastics – PRO BIP 2009, available at http://en.european-bioplastics.org/wp-content/uploads/2011/03/publications/PROBIP2009_Final_June_2009.pdf, accessed 20 June 2011.
Teece, D.J. (1986): Profiting from Technological Innovation: Implications for integration, collaboration, licensing and public policy, Research Policy, 15 (6), pp.285-305.
Wolf, O. (2005): Techno-economic Feasibility of Large-scale Production of Bio-based Polymers in Europe, available at http://ipts.jrc.ec.europa.eu/, accessed 11 December 2011.