Proactive R&D Management and Information Disclosure: Ramifications for Innovative Chemicals Companies
A common view is that investors view steady firm-level R&D investment as evidence of the firm’s commitment to R&D-based innovation. However, recent research shows that R&D expenditure volatility is positively related to firm performance, suggesting that higher levels of R&D expenditure volatility indicate effective governance of the R&D function. This paper shows that the relationship between R&D expenditure volatility and firm performance is stronger within firms that have higher levels of information asymmetry between the firm and its investors. This finding suggests that investors interpret R&D expenditure volatility as a good thing, and that this form of information takes on more significance in the absence of better sources of evidence. Innovative chemicals companies may reconsider conventional wisdom suggesting that consistent R&D expenditure conveys an emphasis on R&D-based innovation. Instead, firms can explain to investors that significant changes in R&D expenditure indicate that management is proactively managing R&D projects and combating R&D overinvestment.
1 Introduction
A recent report by McKinsey and Company shows that, in general, innovation in the chemicals industry continues to generate returns well above the cost of capital, but that a high degree of variation exists in innovation performance. The authors observe that while attractive opportunity exists within the industry, some firms fail to structure their R&D properly (Meremadi et al., 2013). Particularly within the chemicals industry, firms must develop innovation processes that drive the creation of valuable scientific knowledge.
Innovative firms must do two things well. They must exploit their existing competencies in order to create value for firm stakeholders. They must also explore for new forms of advantage so that they can remain competitive as markets shift to new a new paradigm, which makes prior forms of innovation obsolete (March, 1991; 1996; 2006). This exploration/exploitation tradeoff is particularly important in R&D-intensive industries, where the value of older forms of R&D-based innovation are constantly eroded by competitive imitation and newer, superior forms of innovation.
A common view is that firms investing consistently in R&D over time to create the least amount of disruption in their R&D labs. Consequently, they make the steadiest progress towards valuable innovations. In fact, previous research tells us that consistent, steady R&D investment is required in order to create sustainable competitive advantage (Dierckx and Cool, 1989), and that “research workers are not perfectly elastic in supply and cannot be fired and rehired as business conditions might warrant” (Hambrick et al., 1983: 759). This literature suggests that firms change R&D expenditure for reasons that could seriously impact progress towards innovation.
However, an alternative view is possible. Firms that invest about the same amount in R&D over time may be suffering from organizational inertia (Hannan and Freeman, 1984) that prevents them from making adjustments to the firm’s innovation processes. This suggestion implies that stable R&D investments over time arise from bureaucratic inaction, making timely and necessary changes to the firm’s R&D function difficult to implement.
In fact, research has shown that R&D expenditure volatility can arise under many contingencies. Some of these contingencies are beneficial to sustained firm performance; others are not. Firms reduce R&D expenditure in order to improve short-term earnings performance (Baber et al., 1991; Dechow and Sloan, 1991), which could erode the firm’s longterm innovative capabilities. Firms modify R&D expenditure based upon the level of technological and market uncertainty they face (Oriani and Sobrero, 2008; Levitas and Chi, 2010).
While narrow contingencies exist within which changes in R&D expenditure can be harmful to firm performance (e.g. – earnings manipulation), recent research indicates that, in general, fluctuations in firm-level R&D expending is a good thing. R&D expenditure volatility is positively associated with firm growth (Mudambi and Swift, 2011). Recently, Mudambi and Swift (2013) find that higher levels of compact, significant changes in R&D expenditure indicate that the firm is moving between R&D-based exploration and exploitation. Increases in R&D expenditure above the firm’s historic trend are associated with increased exploratory R&D and the creation of highly cited patents; dramatic changes in R&D spending in either direction are associated with higher firm valuations and higher levels of patented firm knowledge.
Business academicians have been criticized for conducting research that has little impact on real-world issues (Bailey and Ford, 1996; Pfeffer and Fong, 2002). Do these findings about the relationship between R&D expenditure volatility and firm performance really matter? It is important to evaluate not only the theoretical, but also the practical significance of this emerging area of study.
The purpose of this paper is to determine whether R&D expenditure volatility is important to investors. If higher levels of R&D expenditure volatility indicate that executive managers are proactively monitoring the firm’s R&D function, then investors may infer that this volatility is evidence that the firm is combating R&D management entrenchment that can lead to the decline of the firm’s competitive advantage. This new research on R&D expenditure volatility can be linked to prior work on firm valuation under conditions of information asymmetry between the firm and its investors in order to glean new insights on the meaning and importance of R&D expenditure volatility to the investment community.
The level of information that the firm provides to external investors is an important driver of firm value. Firms disclose information through a variety of means such as compulsory filings with government agencies, press releases, quarterly results briefings, annual shareholders’ meetings, and private communications with important market analysts. Firms that provide higher levels of information have lower levels of information asymmetry between firm insiders and outside investors; such firms are considered to be transparent. This high information disclosure increases investor confidence that the firm mitigates agency problems and generally results in higher firm valuations (Clarkson et al., 1996; Easley and O’Hara, 2004).
Firms that disclose less information have higher levels of information asymmetry, and can be characterized as opaque. Opaque firms provide less information to outside investors; this lack of information increases the likelihood that inside investors such as founding family members can exploit minority investors, leading to poorer firm performance (Easley and O’Hara, 2004; Anderson et al., 2009). Information asymmetry is influenced by several factors. Prior research shows that younger firms (Berger and Udell, 1995) and firms with higher levels of R&D intensity (Aboody and Lev, 2000) are less transparent to investors. In other words, under these conditions, less information is available to outside investors; therefore it is more difficult for firms to evaluate accurately the performance of the firm.
Under conditions of higher information asymmetry, investors place greater emphasis on secondary sources of information, such as top management team demographics (Sanders and Boivie, 2004: 168). For example, secondary sources of information have been found to be particularly important to firm valuation in firms with higher levels of R&D intensity since it is difficult for firm outsiders to observe progress in R&D (Gu and Li, 2007). Thus, if investors view R&D expenditure volatility as a form of information disclosure, then these expenditure patterns should have a stronger influence on firm value among firms with higher levels of information asymmetry.
In this paper, I show that, in general, investors consider volatile R&D expenditure a good thing. I accomplish this task by showing that the relationship between R&D expenditure volatility and firm value is stronger when investors have relatively less information with which to evaluate the firm. Using financial and economic data from 3,074 publicly traded manufacturing firms comprising almost 17,000 firm-year observations from 1997 to 2006, I find that the relationship between R&D expenditure volatility and firm value is stronger under conditions of higher corporate opacity (i.e.: higher information asymmetry). Sub-sample analysis on observations from firms participating in the chemicals industry reveals similar results. This finding implies that when investors have relatively less information with which to evaluate firm prospects, they place greater emphasis on R&D expenditure volatility as an indication that the firm is proactively managing its R&D function properly.
This news has important practical ramifications. Since prior research suggests that consistent, steady R&D investment over time is the best path to creating firm value (Dierckx and Cool, 1989), firm managers can be impelled to maintain consistent R&D expenditure over time, in the hope that this steady expenditure profile indicates to outside observers that the firm is committed to investing patiently in R&D, without pressing for unrealistic results. However, if investors consider firm level R&D expenditure volatility as a sign of proactive R&D management, firm decision-makers may permit R&D expenditure to fluctuate, and to communicate the reasons for these changes to the investment community.
2 R&D expenditure volatility and information asymmetry: Research hypotheses
It is possible to interpret the meaning of R&D expenditure volatility in multiple ways. Reductions in R&D spending have long been interpreted as earnings manipulation, wherein firms reduce R&D spending in order to generate short-term earnings improvement. Prior research has documented two circumstances under which firms reduce their level of R&D expenditure in a manner consistent with this view. R&D spending is more likely to be reduced when the CEO approaches retirement (Dechow and Sloan, 1991) or when the firm is likely to miss an earnings objective (Baber et al., 1991; Perry and Grinacker, 1994).
Firms that consistently increase R&D spending may be viewed as having volatile R&D spending. However, firms often overinvest in R&D (Barnet and Freeman, 2001; McMath and Forbes, 1998; Demirel and Mazzucato, 2012). A steady, relatively linear increase in R&D spending may indicate R&D overspending, wherein firms are unable to cull underperforming R&D projects. Conversely, firms that persistently decrease R&D spending are likely to be in significant decline (Chen and Miller, 2007).
However, firms that both increase and decrease R&D spending over time have been shown to be superior firms. A broad body of findings suggest that exploratory R&D is more expensive than exploitative (Clark et al., 1987; Clark and Fujimoto, 1991; Dyer, 1996; DiMasi et al., 2003; Gagnon and Lexchin, 2008; Harryson et al., 2008). Compact, relatively large increases in R&D spending are associated with increases in exploratory R&D and the creation of more highly cited patents (Mudambi and Swift, 2013). In turn, decreases are associated with increases in exploitative R&D. Firms with higher levels of overall R&D expenditure volatility exhibit higher levels of firm growth (Mudambi and Swift, 2011) and superior firm valuation (Swift, 2013).
Taken collectively, this new research suggests that the best firms have the ability to proactively manage their R&D portfolios, transitioning from exploitative R&D to exploration once the value of the firm’s R&D portfolio wanes, and back to exploitation once the firm finds new sources of competitive advantage (Mudambi and Swift, 2011; Mudambi and Swift, 2013). This form of R&D management, wherein the firm moves between periods of exploration and exploitation, results in a volatile R&D expenditure pattern over time.
In addition to the well-known challenges related to the tradeoffs between exploration and exploitation (March, 1991; 1996; 2006), innovative firms must deal with the problems related to information asymmetry. Accounting information for R&D-intensive firms is less informative than for low (or non) R&D firms. Aboody and Lev (2000) offer three reasons for this. First, since R&D expenditures are expensed immediately, the knowledge assets created by R&D are not recorded on the firm’s balance sheet. Investors cannot evaluate the effectiveness of the firm’s R&D investments in the short run by observing changes in the balance sheet. Second, since R&D projects are unique to the developing firm, investors cannot compare one firm’s R&D expenditures to R&D expenditure of comparable firms. Third, since no open market exists for R&Dbased knowledge, the market does not inform us on the value of a particular firm’s R&D output by assigning a price to it. Investors do not receive guidance from the market on valuing the R&D outputs of a particular firm. As a result, it is likely that greater information asymmetry exists between the R&Dintensive firm and its investors.
Not only is information asymmetry higher between the R&D-intensive firm and its investors, but also greater efforts are made by R&D-intensive firms to mitigate that information asymmetry. Tasker (1998a) shows that the number of conference calls conducted with investment analysts is higher in R&D intensive firms, and that the majority of questions raised by analysts on these calls are related to the firm’s R&D (1998b). Higher R&D intensity increases firm opacity, and also increases the importance of the firm’s R&D function to investors. De facto, since R&D is a major form of investment for R&D-intensive firms, investors place greater emphasis on the importance of R&D spending in these firms.
There are several drivers of the level of information asymmetry between the firm and its investors. In general, research indicates that higher levels of R&D intensity (Tasker, 1998a; Tasker, 1998b; Aboody and Lev, 2000) and relatively recent initial public offerings (Burger and Udell, 1995) can increase firm opacity. In addition, reduced information disclosure leads to higher information asymmetry, and decreases firm value (Clarkson et al., 1996; Easley and O’Hara, 2004).
Figure one below represents my research question. In this paper, I evaluate whether the level of information asymmetry between the firm and its investors influences the relationship between R&D expenditure volatility and firm value.
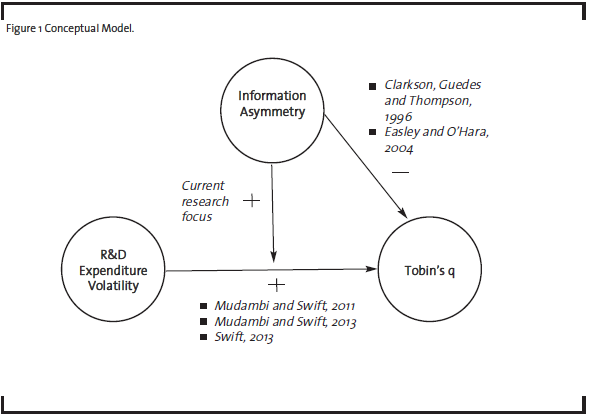
Prior research has established the positive relationship between R&D expenditure volatility and firm performance (Mudambi and Swift 2011; 2013; Swift, 2013) as well as the negative relationship between information asymmetry and firm performance (Easley and O’Hara, 2004). The research focus in this paper is on the moderating role of information asymmetry on the relationship between R&D expenditure volatility and firm performance. I proceed to evaluate my research question using two important determinants of firm opacity: the intangible nature of firm capabilities; and reduced information disclosure.
2.1 R&D Expenditure Volatility and Intangible Capabilities
In the preceding section, I noted that prior research has found that higher levels of information asymmetry decrease firm value. However, firms may possess intangible capabilities that can both increase firm opacity and firm value. For example, R&D-based innovation is difficult for outside investors to observe. This type of intangible capability increases information asymmetry (Aboody and Lev, 2000). As a result, outside investors demand higher investment returns in order to compensate for the risk of this information asymmetry (Riley, 1989). This demand for higher returns decreases firm value by increasing the firm’s cost of capital. Yet R&D-based innovation also creates many forms of valuable innovation, simultaneously increasing firm value (Hall et al., 2005). In general, the net direct impact of many forms of intangible capability on firm value is positive. The first set of hypotheses test the effect that the level of firm intangible capabilities has on the relationship between R&D expenditure volatility and firm value.
2.2 Corporate opacity and R&D intensity
As mentioned above, the level of firm opacity can be exacerbated within highly innovative firms, because opacity is particularly problematic in R&Dintensive firms (Tasker, 1998a; Tasker 1998b; Aboody and Lev, 2000). R&D project payoffs are difficult to anticipate; R&D projects can persist for 10 to 12 years without producing a rent-generating patent (Bernardo et al., 2001). Even if R&D projects do pay off, the benefit to the firm may be difficult to observe. Many firms devote R&D investment to creating process innovations that are not patented (Devinney, 1993) and do not produce results that are readily observable to the investment community.
The combined forces of higher levels of information asymmetry and the heightened importance of R&D spending to the firm should prompt investors to place greater emphasis on the meaning of R&D expenditure volatility. This logic leads to a first hypothesis.
H1: The positive relationship between R&D expenditure volatility and firm value is stronger among firms with higher levels of R&D intensity.
2.3 R&D expenditure volatility and firm age
In general, firm age is negatively related with firm value. Older, larger firms are less likely to search for new knowledge and information (March, 1988; Miller and Chen, 1996). In addition, older firms have more standardized procedures, which can reduce organizational flexibility (Hannan and Freeman, 1984; Nystrom and Starbuck, 1984). Younger firms are also smaller. Thus it is more likely that these smaller firms can post higher percentage rates of growth, which are likely to increase firm value (Hayashi and Inoue, 1991; Lang et al., 1996).
Firm age is an important determinant of firm opacity (Berger and Udell, 1995). Entrepreneurs in smaller firms often have highly specialized skills, and can be overwhelmed with the administrative tasks involved with managing a complex firm (Ciampi and Gordini, 2009). Thus management in smaller, younger firms is less able to engage in investor relations, which can decrease information asymmetry. Investors learn about firms over time. Younger firms have had less time to inform investors on their future prospects, to build a reputation, or to demonstrate stable and predictable performance. Prior research shows that lenders demand higher rates of return from young firms in initial periods, and lower rates in subsequent periods after lenders have learned more about firm prospects (Boot and Thakor, 1994). Firm youth increases the information asymmetry between the firm and the investment community.
Building firm-level legitimacy is a path-dependent process. By meeting performance targets and keeping commitments, firms gain the trust of stakeholders. Firms cannot acquire this credibility quickly; reputation is built over time. Ceteris paribus, investors are less able to observe the firm’s R&D function accurately within younger firms. Thus, investors in younger firms have less information with which to evaluate the firm’s R&D prospects, and should rely more on the meaning of R&D expenditure volatility. These observations lead to a second research hypothesis.
H2: The positive relationship between R&D expenditure volatility and firm value is stronger among younger firms.
2.4 R&D expenditure volatility and reduced information disclosure
Innovative firms have good reason to withhold information from its investors. Perhaps the best reason that firms focusing on innovation may minimize information available to the public is the “Arrow paradox” (Arrow, 1962), which occurs when firms attempt to move intellectual property across firm boundaries. Buyers of innovation demand information about it in order to evaluate their purchasing decision. However, in the process of disclosing this information, the seller effectively transfers this innovation to the buying firm without receiving any compensation. Thus, it pays for innovative firms not to disclose too much information about its proprietary knowledge, which drives up information asymmetry between the firm and its stakeholders.
Within these opaque firms, insiders hold more information than the investment community at large. Outside investors can be exploited by inside investors that have superior information. “This cross-sectional effect results in the uninformed traders always holding too much of stocks with bad news, and too little of stocks with good news” (Easley and O’Hara, 2004: 1554). Two ways to measure the amount and quality of information that is available to investors is the accuracy of investment analyst earnings forecasts, and the bid-ask spread on the firm’s share price. The bid-ask spread is the difference between the highest price that a buyer is willing to pay for a share of firm stock and the lowest price at which a seller will sell the share. This difference is kept by the equity exchange specialist handling this transaction.
2.4.1 Corporate opacity and analyst earnings estimates
Higher amounts of information reduce the difficulty of estimating the true value of the firm’s assets (Clarkson et al., 1996; Easley and O’Hara, 2004). This research provides strong evidence that more information reduces the cost of equity capital through reduced estimation risk.
One way to evaluate the information that is available on a firm is to observe the accuracy of analyst earnings forecasts. Professional investment analysts gather information on firms via public and private sources by doing things such as scrutinizing the firm’s public information disclosures and evaluating insider trades (Healy and Palepu, 2001). The accuracy of stock analyst earnings forecasts are a function of the quality of information that the firm makes available to the investment community (Barron et al., 1998).
Among firms with higher analyst earnings forecast errors, investors have less information with which to evaluate the firm’s prospects. Thus, investors place greater reliance on secondary performance indicators such as R&D expenditure volatility. This observation leads to a third research hypothesis:
H3a: The relationship between R&D expenditure volatility and firm value is stronger among firms with higher analyst forecast earnings error.
2.4.2 Corporate opacity and bid-ask spread
Higher levels of information asymmetry between the firm and its investors also increase the level of risk incurred by market markets on equity exchanges (Diamond and Verrecchia, 1991). When a dearth of information exists on publicly traded firms, investors are less able to accurately assess the true value of the firm. For example, prior work has found that when the market maker perceives that the information advantage held by informed investors has increased, market makers increase the bid-ask spread in order to accommodate the increased trading risk (Copeland and Galai, 1983; Glosten and Milgrom, 1985). Other work shows that information events such as earnings and dividend announcements impact the bid-ask spread (Venkatesh and Chiang, 1986). Under conditions in which market makers are less able to evaluate the true value of the firm, investors place greater emphasis on the meaning of R&D expenditure volatility. This line of reasoning leads to a final, complementary hypothesis:
H3b: The relationship between R&D expenditure volatility and firm value is stronger among firms with higher bid-ask spreads.
3 Research Methods
3.1 The Data
The sample frame is generated from the Compustat Annual North America databases (Standard and Poors, 2011) which provide accounting and market information on all publicly traded firms in the U.S, the Center for Research in Security Prices (CRSP) database (CRSP, 2011), which provides bid and ask prices publicly traded stocks, and from the Institutional Brokers’ Estimate System, or I/B/E/S (Thomson- Reuters, 2011), which provides institutional analysts’ earnings forecasts over time. I constructed two data sets to test my hypotheses. Since fewer firms have an analyst following, the dataset used to test information asymmetry is smaller than the dataset used to test intangible assets. In order to test the hypotheses using information asymmetry as measured by bid-ask spread or analyst earnings forecast accuracy, I include only those firms that report bid-ask spread data in CRSP, and analyst forecasts in I/B/E/S.
A measure of industry concentration is taken from the U.S. Economic Census (U.S. Census Bureau, 2002). Following Hall et al. (2005), all manufacturing firms (NAICS codes 31 through 3399) are selected. Each observation represents one firm-year. After removing observations with missing values, the data set used to evaluate information asymmetry contains 6,373 firm-year observations. The dataset used to evaluate the influence of intangible firm capabilities contains 17,016 firm-year observations. Since not all firms existed for each year of the ten year study window selected, this is an unbalanced panel. The average number of years reported for each firm is 5.5 years.
This data set covers the years 1997 to 2006. Periods of punctuated change within the punctuated equilibrium model have been shown to be fairly compact. Romanelli and Tushman (1994) showed that most firms accomplish profound change within two years. Thus, over the ten year study window used in this paper, good chance of observing periods of punctuated change exists.
3.2 Dependent variable
Tobin’s q Firm value is measured using a proxy for Tobin’s q. Tobin’s q is defined as the ratio of the market value of a firm to the replacement cost of its assets. Firms with a q-ratio greater than unity are creating economic value. Q incorporates a capital market measure of firm rents, minimizes distortions due to tax laws and accounting conventions, and implicitly uses the correct risk-adjusted discount rate (Wernerfelt and Montgomery, 1988).
For the purposes of this analysis, Chung and Pruitt’s (1994) simple approximation of Tobin’s q is used. It retains almost all of the original informativeness of the theoretically correct q ratio. Their approximate q implicitly assumes that the replacement values of a firm’s plant, property and equipment (PP&E) and inventories are equal to their book values. The market-value of debt is substituted by the value of the firm’s short-term liabilities less the short-term assets plus the book value of the firm’s long-term debt. The authors find that at least 96.6% of the variation in Tobin’s q is explained by the approximate q.
3.3 Independent variables
The following variables are included in the regression analysis in order to evaluate the research hypotheses offered above.
3.3.1 R&D Expenditure Volatility
R&D expenditure volatility can be an observable marker for successful proactive management. I measured it over the ten year study period as the standard deviation of the residuals from the firm’s R&D expenditure trend over the study period (Mudambi and Swift, 2011; Swift, 2013). This measures R&D volatility net of R&D expenditure growth. The calculation is performed using a two-step process. First, I regress R&D expenditure on a linear time trend:
![]()
where t ranges from one to ten (corresponding to years 1997 to 2006) and i = firm.
Estimating this equation gives us the trend value of R&D expenditure. Residuals around this trend line are calculated as the actual R&D expenditure minus the trend value of R&D expenditure. The standard deviation of these residuals provides an absolute measure of R&D expenditure volatility for each firm. However, this measure is increasing in the size of R&D expenditures, so larger R&D spenders would tend to have larger standard deviations.
Therefore, in the second step, I divide the standard deviation of the residuals about the R&D timetrend by the mean R&D expenditure over the ten year study period:
![]()
where s = the standard deviation of R&D expenditure residuals about the time-trend, i = firm, and x̄ = the mean R&D expenditure over time.
This calculation provides us with a relative measure of R&D expenditure volatility that incorporates the firm’s level of R&D spending.
3.3.2 Analyst Earnings Forecast Error
Prior research finds that analyst earnings forecast accuracy is an effective measure of corporate opacity (Barron et al., 1998). Following Anderson et al. (2009), analyst earnings forecast accuracy is calculated as the difference between the mean analyst earnings forecast and the actual earnings for that quarter, divided by the average of the mean analyst earnings forecast and the actual earnings for that quarter. For each year, I take the mean value of analyst earnings forecast error across the four quarters.
3.3.3 Bid-Ask Spread
As discussed above, the firm’s bid-ask spread is another measure of corporate opacity. I compute the bid-ask spread as the ask price minus the bid price divided by the average of the bid and the ask prices. To compute a measure of the bid-ask spread, I average all trades for each firm at month-end closing prices, and then calculate a yearly average based on these 12 observations.
3.3.4 R&D Intensity
R&D intensity is measured as annual R&D expenditure divided by firm sales.
3.3.5 Firm Age
The passage of time does not have a linear, or constant, influence on firm performance over time. The passage of one more year for a 25 year old firm is not as significant as the passage of one more year for a three year old firm. An arbitrary cutoff point of ten years of age was selected to distinguish younger firms from older firms. (The results presented in this paper are robust to selecting other ages as cutoff points between younger and older firms.) Firms whose initial public offering occurred in the most recent ten years of the study (from 1997 to 2006) are considered young firms. If the firm’s initial public offering occurred after 1996, a binary variable denoting firm age is set to one. Otherwise, the binary variable is set to zero.
3.4 Control variables
There is a broad literature providing empirical support for many different sources of influence on Tobin’s q. I isolate those influences before testing my research hypothesis. The following set of variables control for firm-specific and industry effects. Highly concentrated industries are viewed as less competitive; firms in such industries enjoy high entry barriers and may appropriate economic rents (McGahan and Porter, 1997). Therefore, I include the U.S. Economic Census’ measure of industry concentration (market share of the twenty largest firms in each four digit NAICS industry). Tobin’s q is generally viewed to be an indication of the firm’s future growth prospects (Hayashi and Inoue, 1991). Firm sales growth over the previous year is included to control for this influence. Earnings per share (net income divided by shares outstanding) is included to capture the effect of firm profitability on Tobin’s q (Erickson and Whited, 2000), and the level of firm sales is included to control for firm size (Montgomery and Wernerfelt, 1988). In addition to being one of the study variables, R&D intensity is also included as a control variable, since several researchers have shown a direct relationship between R&D intensity and firm performance (Jaffe, 1986; Lev and Sougiannis, 1996; Hall et al., 2005). Firm value has been shown to decrease over corporate diversification (Berger and Ofek, 1995; Campa and Kedia, 2002). An entropy index (Theil, 1967) is used to measure firm diversification [36], which is calculated as follows:
![]()
where Pn = percentage of firm revenues derived by division n. Multiple divisions that are reported in the same six digit NAICS code are treated as one division.
Lang, Ofek and Stulz (1996) find that firm leverage effects Tobin’s q. The firm’s debt ratio (longterm debt divided by total assets) is included to control for the influence of leverage.
In practice, many firms set R&D spending targets as a percentage of expected firm sales (Scherer, 2001; Neelankavil and Alaganar, 2003; Tubbs, 2007). In all specifications, I include a measure of sales volatility, which is calculated using the same methodology as R&D expenditure volatility, in order to control for the volatility in firm sales over time (Mudambi and Swift, 2011; Swift, 2013).
Finally, prior literature shows that the relationship between R&D expenditure volatility and firm performance is negative among very small firms (Mudambi and Swift, 2011; Swift, 2013). Thus, I seek to capture the unique effects that are attributable to very small firms. I include a dummy variable that is set to one if annual firm sales are less than $10 million, or to zero if firm sales is greater than or equal to $10 million.
4 Empirical analysis
4.1 Descriptive Statistics
Table 1 presents the summary statistics of the sample data.
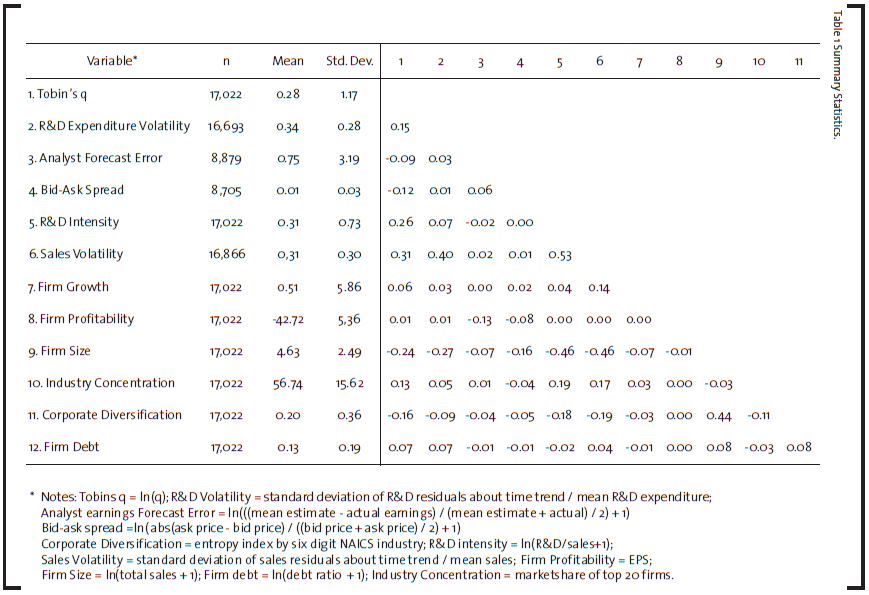
In order to correct for the skewed distribution of the measure of firm value, bid-ask spread, analysts’ earnings forecast error, firm size, firm leverage, and R&D intensity, these variables are logtransformed. Note that analyst earnings forecast accuracy and bid-ask spread are negatively correlated with firm value, which is consistent with a broad body of literature asserting that information asymmetry is positively related to the firm’s cost of capital (Easley and O’Hara, 2004). However, note that while prior literature suggests that firm level R&D intensity is a determinant of corporate opacity (Aboody and Lev, 2000) the correlation between R&D intensity and analyst earnings forecast accuracy or bid ask spread is quite weak, and the correlation between R&D intensity and firm value is positive. This finding is consistent with a much broader literature arguing that high performing firms maintain a higher level of R&D intensity and continue to re-invest in their innovative capabilities (Jaffe, 1986; Lev and Sougiannis, 1996; Hall et al., 2005).
Note that R&D expenditure volatility is only weakly correlated with R&D intensity, suggesting that R&D volatility captures a different dimension of firm behavior than R&D intensity. While a common view posits that R&D expenditure is set as a fixed percentage of firm Fosales (Scherer, 2001; Tubbs, 2007), it is interesting to note that R&D expenditure volatility is positively correlated to sales volatility, but only at r = 0.40.
4.2 Primary Tests
Multiple regression analysis is used to test the research hypothesis. In all equations, the t-values are corrected for heteroskedasticity using estimated generalized least squares (EGLS). Dummy variables are used to estimate the fixed effect of each year. In the specifications tested below, I regress Tobin’s q for each firm-year on the average level of R&D expenditure volatility observed over the study period for each firm (Mudambi and Swift, 2011; Swift, 2013). I take this approach because prior research shows that Tobin’s q is quite sticky. That is, q moves sluggishly over time, and is heavily influenced by the firm’s prior performance (Lang et al., 1989). In this analysis, I evaluate whether R&D expenditure volatility is related to sustained firm performance over the study period.
Table 2 shows the results of the regression analyses used to evaluate Hypotheses 1 and 2.
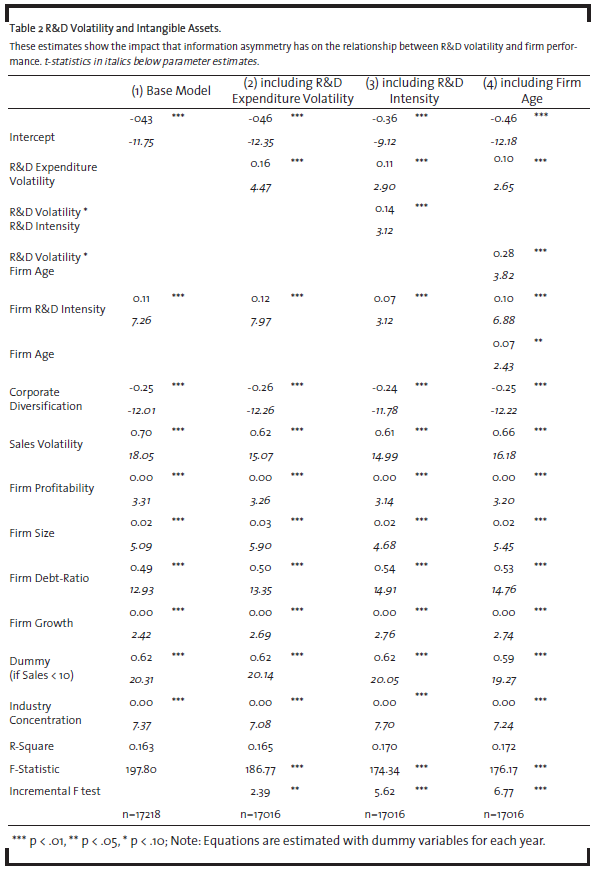
Hypothesis 1 states that the relationship between R&D expenditure volatility and firm value is stronger among firms with higher levels of R&D intensity. Column one shows the regression equation estimates using control variables only. Column two shows the regression estimates including the measure of R&D expenditure volatility. Note that the explanatory power of the specification using only control variables shown in column one is statistically significant, based on its F-ratio. An incremental F-test shows that the explanatory power of the specification shown in column two is statistically significantly greater than the controls-only model shown in column one. The parameter estimate on R&D expenditure volatility is positive and statistically significant. This observation is consistent with prior research showing that R&D expenditure volatility is positively related to firm performance (Mudambi and Swift, 2011; Mudambi and Swift, 2013; Swift, 2013).
Column three includes the interaction of R&D expenditure volatility and R&D intensity. Note that the parameter estimates on R&D expenditure volatility, R&D intensity and the interaction of R&D volatility and R&D intensity are all positive and statistically significant. In addition, the incremental F-test indicates that the explanatory power of this specification is statistically significantly greater than the R&D volatility only specification shown in column two. While R&D intensity can increase corporate opacity, the positive parameter estimate is consistent with research indicating that R&D intensity increases firm value (Jaffe, 1986; Hall et al., 2005). Using R&D intensity as a measure of the intangible value of the firm, Hypothesis 1 is supported.
Hypothesis 2 states that the relationship between R&D expenditure volatility and firm value is stronger among younger firms. The results of this test are shown in Table 2. Column four includes the measures of R&D expenditure volatility, a young firm indicator, and the interaction of the young firm indicator and R&D expenditure volatility. An incremental F-test indicates that the explanatory power of this specification is statistically significantly greater than the R&D volatility only specification shown in column two. The parameter estimate on R&D expenditure is once again positive and statistically significant. The parameter estimate on the young firm variable is positive and statistically significant. Although younger firms are generally more opaque, ceteris paribus they are also more valuable than older firms (Anderson et al., 2009). Thus the positive coefficient estimate on firm age is consistent with previous literature.
The interaction of R&D volatility and the young firm indicator is positive and statistically significant. Among younger firms, the relationship between R&D expenditure volatility and firm value is more positive. Using firm age as a measure of the intangible nature of the firm, Hypothesis 2 is supported.
Table 3 shows the results of the regression analyses used to evaluate Hypotheses 3A and 3B. I use a smaller dataset to evaluate these hypotheses, since not all firms are followed by investment analysts. In tests results presented Table 3 include only those firms that have an analyst following, and report bid-ask spreads in CRSP.
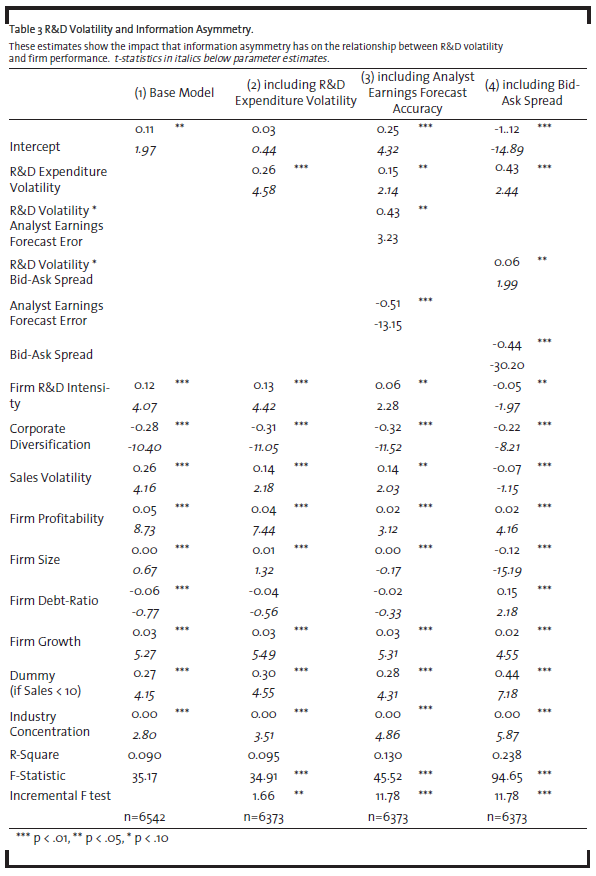
Hypothesis 3A states that the relationship between R&D expenditure volatility and firm value increases as analysts’ earnings forecast errors increase. Column one presents the controls only specification using this smaller dataset. Column two presents the specification including the measure of R&D expenditure volatility. Once again, note that there is a statistically significant, positive relationship between R&D expenditure volatility and firm value, which is consistent with prior research (Mudambi and Swift, 2011; Mudambi and Swift, 2013; Swift, 2013). Column three includes the measures of R&D expenditure volatility, analysts’ earnings forecast error and the interaction of analysts’ earnings forecast error and R&D expenditure volatility. An incremental F-test indicates that the explanatory power of this specification is statistically significantly greater than the R&D volatility only specification shown in column two. The parameter estimate on R&D expenditure is once again positive and statistically significant. The parameter estimate on analysts’ earnings forecast error is negative and statistically significant, which is consistent with prior literature establishing a negative relationship between analyst forecast accuracy and firm value (Clarkson et al., 1996; Easley and O’Hara, 2004). The interaction of R&D volatility and analysts’ earnings forecast error is positive and statistically significant. As analysts’ earnings forecast error increases, the relationship between R&D expenditure volatility and firm value increases. Hypothesis 3A is supported.
Hypothesis 3B states that the relationship between R&D expenditure volatility and firm value increases as bid-ask spreads increase. Column four of Table 3 includes the measures of R&D expenditure volatility, bid-ask spread and the interaction of bid-ask spread and R&D expenditure volatility. An incremental F-test indicates that the explanatory power of this specification is statistically significantly greater than the R&D volatility only specification shown in column two. The parameter estimate on R&D expenditure is positive and statistically significant. The parameter estimate on bid-ask spread is negative and statistically significant, which is consistent with prior literature establishing a negative relationship between bid-ask spread and firm value (Copeland and Galai, 1983; Glosten and Milgrom, 1095; Venkatesh and Chiang, 1986; Diamond and Verrecchia, 1991). The interaction of R&D volatility and bid-ask spread is positive and statistically significant. As the bid-ask spread increases, the relationship between R&D expenditure volatility and firm value increases. Hypothesis 3B is supported.
Using four very different measures of information asymmetry (or corporate opacity), I find sufficient evidence supporting my main research hypothesis.
4.3 Sub-Sample Analysis: Using Chemicals Firms Only
Of particular interest to our readers is the chemicals industry, which is a subset of the sample of all manufacturing firms used to test the hypotheses above. Table 4 below presents the results of our regression analysis using only the observations from chemicals firms (NAICS 325).
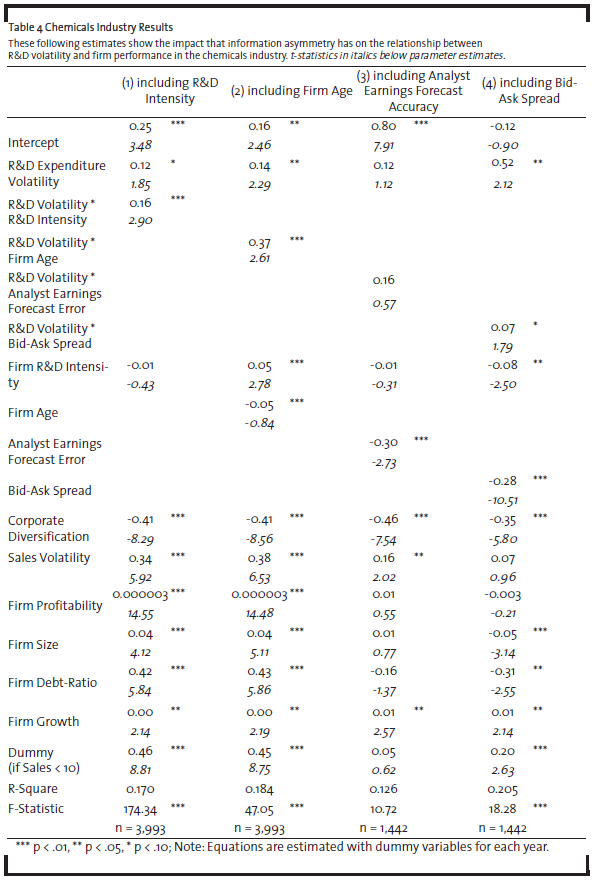
Column one of Table 4 shows the results using R&D intensity as the measure of firm-level intangible capabilities, and column two of Table 4 shows the results using firm age as the measure. Column three of Table 4 shows the results of the specification using analyst earnings forecast accuracy as the measure of information asymmetry. Column four shows the results using bid-ask spread as the measure of information asymmetry. Note that the cross terms of R&D expenditure volatility and the measures of intangible capabilities or information asymmetry are positive and statistically significant in three of the four specifications. Using a sub-sample of firms from the chemicals industry, the specification using analyst earnings forecast accuracy is no longer statistically significant. However, the main results are supported in the chemicals industry by using bid-ask spread, R&D intensity and firm age as measures of information asymmetry and firm-level intangible capabilities.
These results strongly suggest that the main findings observed across all manufacturing industries also hold in the chemicals industry in particular. The importance of R&D expenditure volatility to investors increases as information asymmetry between the firm and its investors increases.
5 Discussion
If a highly volatile R&D expenditure profile is a reasonable indicator of proactive R&D management, the findings in this paper have important ramifications. Outside investors may interpret volatile R&D expenditures as evidence of effective governance of the R&D function. Since prior research shows that investors place greater emphasis on secondary sources information when relatively little investor information is available (Sanders and Boivie, 2004: 168), such cues may be particularly valuable to investors that are evaluating opaque firms.
Changes to R&D expenditure are commonly viewed as evidence of myopic decision-making by management. R&D spending is more likely to be reduced when the CEO approaches retirement (Dechow and Sloan, 1991) or when the firm is likely to miss an earnings objective (Baber et al., 1991). Firm managers may consider steady R&D expenditure overtime as a demonstration of their commitment to the innovation process. Evidence presented in this paper suggests that would be a mistake.
I began this paper by pointing to new research that has identified a positive link between R&D expenditure volatility and firm performance, noting that this finding is in contrast to prior research suggesting that stable R&D investments may be more beneficial to firm innovation (Mudambi and Swift, 2011; Mudambi and Swift, 2013; Swift, 2013). I discussed the detrimental effects of corporate opacity, and the research suggesting that under conditions of information asymmetry, investors place greater reliance on secondary sources of information such as corporate governance processes in order to evaluate the firm’s prospects. I suggest that R&D expenditure volatility is a form of information disclosure, and that investors place greater emphasis on this type of secondary information under conditions of higher information asymmetry. I identify four determinants of corporate opacity that are particularly relevant to firm investors: the firm’s level of R&D intensity; the age of the firm; the accuracy of investment analyst earnings forecasts; and the bid-ask spread.
The first finding of this paper is the relationship between R&D expenditure volatility and firm value is higher among firms with higher levels of R&D intensity. Two likely reasons for this relationship exist. First, since R&D projects are so difficult to evaluate by outsiders (Bernardo et al., 2001; Stein, 2003), and the accounting and market information on R&D is so incomplete (Aboody and Lev, 2000), investors place greater evidence on secondary indicators of R&D prospects, such as R&D expenditure volatility. Second, since the importance of R&D to the firm’s value increases with its R&D intensity (Tasker, 1998a; 1998b), it follows that investors would place greater evidence on any disclosure that is useful in evaluating the firm’s R&D prospects. R&D expenditure volatility takes on greater importance to investors as a form of information disclosure among more R&D intensive firms.
The second finding of this paper is that the relationship between R&D expenditure volatility and firm value is stronger in firms that are less than ten years from their initial public offering (IPO). Since relatively younger firms have been observed for relatively less time than older firms, investors have more difficulty in evaluating the true prospects of their R&D efforts. Under these conditions, investors place greater emphasis on secondary sources of information. Note that R&D expenditure volatility has a stronger, positive influence on firm value among younger firms.
The third finding of this paper is that information asymmetry between the firm and its investors increases, the relationship between R&D expenditure volatility and firm value increases. Using the most comprehensive measure of corporate opacity, analyst earnings forecast error, I find that the relationship between R&D expenditure volatility and firm value is stronger among more opaque firms. This finding provides further evidence that R&D expenditure volatility is a real form of information disclosure to outside investors, and that investors regard this observation as a positive indication that the firm is proactively managing its R&D function.
The final finding supports the third. Using an alternative measure of information asymmetry, the bid-ask spread on share prices on publicly traded exchanges, I find results that are consistent with results using analyst earnings forecast error. Hypothesis 3 is robust to multiple measures of information asymmetry.
These results are economically as well as statistically significant. For example, at the mean value for all variables in the sample, a 10% increase in R&D expenditure volatility results in a 1.6% increase in firm value as measured by Tobin’s q. This relationship between R&D expenditure volatility and firm performance is sensitive to the level of information asymmetry between the firm and its investors. For example, if analyst earnings forecast error increases by 10% above the mean value, then a 10% increase in R&D expenditure volatility results in a 1.8% increase in firm value. Clearly, understanding the value assigned by investors to proactive R&D management under conditions of information asymmetry is significant.
Many of the findings in this paper are consistent with previous research. The evidence presented here showing that R&D intensity (Jaffe, 1986; Lev and Sougiannis, 1996; Hall et al., 2005), firm youth (Anderson et al., 2009) and R&D expenditure volatility (Mudambi and Swift, 2011; Mudambi and Swift, 2013; Swift, 2013) are positively related to firm value reinforces earlier findings. The negative parameter estimate on analyst earnings forecast accuracy supports earlier findings that corporate opacity results in higher cost of capital (Clarkson et al., 1996; Easley and O’Hara, 2004). In the same way, the negative parameter estimate on bidask spread is also in line with prior research (Copeland and Galai, 1983; Glosten and Milgrom, 1985; Venkatesh and Chiang, 1986; Diamond and Verrecchia, 1991).
What are noteworthy in my empirical results are the interaction terms; the parameter estimates on the product of R&D expenditure volatility and corporate opacity are always positive. Using four different measures of corporate opacity, I present extensive evidence that R&D expenditure volatility is a form of information disclosure, and that this disclosure is more valuable when investors are struggling to understand the true prospects of future firm value.
These findings can change the way we manage R&D intensive firms, or evaluate them as investors. This study introduces a new concept to investors, researchers, R&D managers and investor relations experts. The current emphasis on the level of R&D spending is incomplete.
While much research in R&D suggest that smooth R&D spending over time indicates a firm’s commitment to innovation (Grabowski, 1968; Hambrick et al., 1983; Dierckx and Cool, 1989), others provide evidence that firms can overinvest in R&D. Barnett and Freeman (2001) find that firms issue too many new products, which significantly increases the likelihood of organizational failure. McMath and Forbes (1998) show that most new products fail. Demirel and Mazzucato (2012) show that R&D can dampen firm growth among large pharmaceutical firms. I suggest that R&D expenditure volatility is a valuable clue to investors that the firm is proactively managing its R&D function, preventing R&D overinvestment during periods of R&D based exploitation, and aggressively ramping up exploratory R&D spending once the value of the firm’s extant competitive advantage has eroded.
R&D managers must monitor the firm’s future R&D prospects aggressively. As the value of firm’s current core competencies begin to wane, management has the opportunity to dramatically shift R&D resources from exploitation (innovation related to the firm’s current knowledge base) to exploration (searching for new knowledge relatively distant from the firm’s existing knowledge base). Such movements from exploration and exploitation based R&D activities may result in a volatile R&D expenditure over time (Mudambi and Swift, 2011; Mudambi and Swift, 2013). In this paper, I assert that rather than seeking smooth, consistent R&D spending over time, firms may wish to promote R&D spending changes, and to ensure that the firm’s stakeholders understand the reasons for these fluctuations. By increasing efforts to explain why the firm has significantly changes its level of R&D expenditure, managers may mitigate the market’s propensity to underestimate the true value of the firm in the presence of information asymmetry (Izquierdo and Izquierdo, 2007 ).
Investors in R&D intensive firms can use R&D expenditure volatility as an important cue that prompts focused investigation. In certain situations, fluctuations in R&D spending indicate that the firm is manipulating earnings (Dechow and Sloan, 1991; Baber et al., 1991). Yet in general, this observed volatility can be evidence that the firm transitions to exploratory R&D activities during periods of extreme industry change that calls for new forms of innovation (Mudambi and Swift, 2011; Mudambi and Swift, 2013). Investors that observe high levels of R&D expenditure volatility may wish to undertake focused investigation into the firm’s activities that may shed light on the sources, and ramifications, of this observed R&D volatility.
Despite the compelling evidence presented here, much work can be done to address gaps in this research. This nascent line of inquiry presents new and important questions. Future research in finance and accounting can determine how to differentiate between firms using R&D spending as a simply a buffer with which to manage short-term earnings and firms that are moving between modes of R&D-based exploration and exploitation. More work can be done exploring the role that boundary spanners play in brokering the difficult discussions that must occur between the professional guilds of management and science as R&D budgets are adjusted (Mudambi and Swift, 2009). Management scholars can employ case study methods that identify the tactics that high performing companies use to determine when and how R&D expenditure spending should be changed as market conditions warrant. Prior research has found that R&D expenditure volatility can be detrimental in small firms, firms competing in slow clockspeed industries, or highly diversified firms (Mudambi and Swift, 2011), yet very valuable among firms with higher levels of organizational slack (Swift, 2013). Research in multiple disciplines can identify other variables that enhance or mitigate the relationship between R&D volatility and firm value.
References
Aboody, D., Lev, B. (2000): Information asymmetry, R&D, and insider gains, Journal of Finance, LV (6), pp. 2747-2766.
Anderson, R., Duru, A., Reeb D. (2009:) Founders, heirs, and corporate opacity in the United States, Journal of Financial Economics, 92, pp. 205-222.
Arrow, K. (1962): Economic welfare and the allocation of resources for invention, in: The Rate and Direction of Inventive Activity: Economic and Social Factors, Princeton, NBER and Princeton University Press, pp. 609-625.
Baber, W.R., Fairfield, P.M., Haggard, J.A. (1991): The effect of concern on discretionary spending decisions: the case of research and development, The Accounting Review, 66 (5), pp. 818-829.
Bailey, J., Ford, C. (1996): Management as science versus management as practice in postgraduate business education, Business Strategy Review, 7 (4), pp. 7-12.
Barnett, W.P., Freeman, J. (2001): Too much of a good thing? Product proliferation and organizational failure, Organization Science, 12 (5), pp. 539- 558.
Barron, O.E., Kim, O., Lim, S.C., Stevens, D.E. (1998): Using analysts’ earnings forecast to measure properties of analysts’ information environment, The Accounting Review, 73 (4), pp. 421- 433.
Berger, P.G., Ofek, E. (1995): Diversification’s effect on firm value, Journal of Financial Economics, 37, pp. 39-65.
Berger, P.G., Udell, G.F. (1995): Relationship lending and lines of credit in small firm finance, Journal of Business, 68 (3), pp. 351-381.
Bernardo, A.E., Cai, H., Luo, J. (2001): Capital budgeting and compensation with asymmetric information and moral hazard, Journal of Financial Economics, 61, pp. 311-344.
Boot, A.W.A., Thakor, A.V. (1994): Moral hazard and secured lending in an infinitely repeated credit market game, International Economic Review, 35, pp. 899-920.
Campa, J.M., Kedia, S. (2002): Explaining the diversification discount, Journal of Finance, LVII(4), pp. 1731-1762.
Chen, W.R., Miller, K.D. (2007): Situational and institutional determinants of firm’s R&D search intensity, Strategic Management Journal, 28, pp. 369-281.
Chung, K.H., Pruitt, S.W. (1994): A simple approximation of Tobin’s q, Financial Management, 23 (3), pp. 70-74.
Ciampi, F., Gordini, N. (2009): Default prediction modeling for small enterprises: Evidence from small manufacturing firms in northern and central Italy, Oxford Journal, 8 (1), pp. 13-29.
Clark K.B., Fujimoto T. (1991): Product development performance: strategy, organization and management in the world auto industry, Harvard Business Press.
Clark K.B., Chew W.B., Fujimoto T. (1987): Product development in the world auto industry, Brookings Papers on Economic Activity, 3, pp. 729-771.
Clarkson, P., Guedes, J., Thompson, R. (1996): On the diversification, observability, and measurement of estimation risk, Journal of Financial and Quantitative Analysis, 31, pp. 69-84.
Copeland, T.E., Galai, D. (1983): Information effects on the bid-ask spread, Journal of Finance, 38, pp. 1457-69.
CRSP Stocks. (March, 2011): 1997 to 2006, Available: Center For Research in Security Prices. Graduate School of Business. University of Chicago Retrieved from Wharton Research Data Service.
Dechow, P.M., Sloan, R.G. (1991): Executive incentives and the horizon problem: An empirical investigation, Journal of Accounting and Economics, 14, pp. 51-89.
Demirel, P., Mazzucato, M. (2012) Innovation and firm growth: Is R&D worth it? Industry and Innovation, 19 (1), pp. 45-62.
Devinney, T. (1993): How well do patents measure new product activity? Economic Letters, 41 (4), pp. 447-450.
Diamond, D.W., Verrecchia, R.E. (1991): Disclosure, liquidity and the cost of capital, Journal of Finance, XLVI(4), pp. 1325-1359.
Dierickx, I., Cool, K. (1989): Asset stock accumulation and sustainability of competitive advantage, Management Science, 35 (12), pp. 1504-1511.
DiMasi J.A., Hansen W., Grabowski H.G. (2003): The price of innovation: new estimates of drug development costs, Journal of Health Economics, 22 (2), pp. 151-185.
Dyer, J.H. (1996): Specialized supplier networks as a source of competitive advantage: Evidence from the auto industry, Strategic Management Journal, 17 (4), pp. 271-292.
Easley D., O’Hara. M. (2004): Information and the cost of capital, Journal of Finance, 59, pp. 1553- 1583.
Erickson, T., Whited, T.M. (2000): Measurement error and the relationship between investment and q, Journal of Political Economy, 108 (5), pp. 1027- 1057.
Gagnon M., Lexchin, J. (2008): The cost of pushing pills: A new estimate of pharmaceutical promotion expenditures in the United States, PLoSMedicine, 5 (1), pp. 29-33
Glosten, L.R., Milgrom, P.R. (1985): Bid-Ask and transaction prices in a specialist market with heterogeneously informed traders, Journal of Financial Economics, 14, pp. 71-100.
Grabowski, H.G. (1968): The determinants of industrial research and development: a study of the chemical drug and petroleum industries, Journal of Political Economy, 76, pp. 292-306.
Gu F., Li, J.Q. (2007): The credibility of voluntary disclosure and insider stock transactions, Journal of Accounting Research, 45 (4), pp. 771-810.
Hall, B.H., Jaffe, A., Trajtenberg, M. (2005): Market value and patent citations, RAND Journal of Economics, 36 (1), pp. 16-38.
Hambrick, D.C., MacMillan, I.C., Barbosa, R.R. (1983): Business unit strategy and changes in the product R&D budget, Management Science, 29 (7), pp. 757-769.
Hannan, M.T., Freeman, J. (1984): Structural inertia and organizational change, American Sociological Review, 49, pp. 149-164.
Harryson S.J., Dudkowski R., Stern A. (2008): Transformation networks in innovation alliances – the development of Volvo C70, Journal of Management Studies, 45 (4), pp. 745-773.
Hayashi F., Inoue, T. (1991): The relations between firm growth and q with multiple capital goods: theory and evidence from panel data on Japanese firms, Econometrica, 59 (3), pp. 731-754.
Healy, P., Palepu, K. (2001): Information asymmetry, corporate disclosure and the capital markets: a review of the empirical disclosure literature, Journal and Accounting and Economics, 31, pp. 405-440.
Izquierdo, S., Izquierdo, L. (2007): The impact of quality uncertainty without asymmetric information on market efficiency, Journal of Business Research, 60 (8), pp. 858-867.
Jaffe, A. (1986): Technology opportunity and spillovers of R&D: evidence from firms’ patents, profits and market value, American Economic Review, 76, pp. 984-1001.
Lang, L., Ofek E., Stulz R. (1996): Leverage, investment and firm growth, Journal of Financial Economics, 40, pp. 3-29.
Lang L., Stulz R., Walkling, R. (1989): Tobin’s q and the gains from successful tender offers, Journal of Financial Economics, 24, pp. 137-154.
Lev, B., Sougiannis, T. (1996): The capitalization, amortization and value-relevance of R&D, Journal of Accounting and Economics, 21, pp. 107-138.
Levitas, E., Chi, T. (2010): A look at the value creation effects of patenting and capital investment through a real options lens: the moderating role of uncertainty, Strategic Entrepreneurship Journal, 4 (3), pp. 212-233.
March, J.G. (1998): Decisions and Organizations, Basil Blackwell, Oxford.
March, J.G. (1991): Exploration and exploitation in organizational learning, Organization Science, 2, pp. 71-87.
March, J.G. (1996): Continuity and change in theories of organizational action, Administrative Science Quarterly, 41, pp. 278–287.
March, J.G. (2006): Rationality, foolishness, and adaptive intelligence, Strategic Management Journal, 27, pp. 201–214.
McGahan, A.M., Porter, M.E. (1997): How much does industry matter, really? Strategic Management Journal, Summer Special Issue, 18, pp. 15-30.
McMath, M.R., & Forbes, T. (1998): What were they thinking? New York: Times Business-Random House.
Meremadi, M., Musso, C. Oxgaard, J. (2013): Chemical innovation: An investment for the ages. McKinsey & Company; available at https://www.mckinsey.com/industries/chemicals/our-insights/chemical-innovation-an-investment-for-the-ages, accessed August 16, 2013.
Miller, D., Chen, M.J. (1996): The simplicity of competitive repertoires: An empirical analysis, Strategic Management Journal, 17, pp. 429-439
Montgomery, C., Wernerfelt, B. (1988): Diversification, Ricardian rents, and Tobin’s q, RAND Journal of Economics, 19, pp. 623-32.
Mudambi, R., Swift, T. (2009): Professional guilds, tension and knowledge management, Research Policy, 38 (5), pp. 636-645.
Mudambi, R., Swift, T. (2011): Proactive R&D management and firm growth: a punctuated equilibrium model, Research Policy, 40, pp. 429-440.
Mudambi, R., Swift. T. (2013) Knowing when to leap: Transitioning between exploitative and explorative R&D, Strategic Management Journal, (DOI: 10.1002/smj.2097).
Nystrom, P.C., Starbuck, W.H. (1984): To avoid organizational crises, unlearn, Organizational Dynamics, pp. 53-65.
Oriani, R., Sobrero M. (2008): Uncertainty and the market valuation of R&D within a real options logic, Strategic Management Journal, 29(4), pp. 343-361.
Perry, S., Grinaker, R. (1994:) Earnings expectations and discretionary research and development spending, Accounting Horizons, 8 (4), pp. 43-51.
Pfeffer, J., Fong, C. (2002): The end of business schools? Less success than meets the eye. Academy of Management Learning & Education, 1 (1), pp. 78-95.
Riley, J.G. (1989): Signaling. in: Eatwell J, Milgate M, Newman P, (ed.), Allocation. Information, and Markets, Norton: New York, pp. 287-294.
Romanelli, E., Tushman, M.L. (1994): Organizational transformation as punctuated equilibrium: an empirical test, Academy of Management Journal, 37 (5), pp. 1141-1166.
Sanders, W.G. Boivie, S. (2004): Sorting things out: valuation of new firms in uncertain markets, Strategic Management Journal, 25, pp. 167-186.
Scherer, F.M. (2001): The link between gross profitability and pharmaceutical R&D spending, Health Affairs, 20 (5), pp. 216-220.
Standard and Poors (2011): Compustat North America: McGraw-Hill.
Stein, J.C. (2003): Agency, information and corporate investment, in Constantinides G.M., Harris M., Stulz R.M. (ed.) Handbook of the Economics of Finance, Elsevier Science B.V.
Swift, T. (2013): R&D expenditure volatility and firm performance: Organizational and environmental contexts, International Journal of Innovation and Technology Management, 10 (3).
Tasker, S. (1998a): Bridging the information gap: Quarterly conference calls as a medium for voluntary disclosure, Review of Accounting Studies, 3, pp. 137-167.
Tasker, S. (1998b): Technology company conference calls: A small sample study, Journal of Financial Statement Analysis, 4, pp. 6-14.
Theil, H. (1967): Economics and information theory, Amsterdam: North-Holland.
Thomson-Reuters (2011): Institutional Brokers’ Estimate System: Thomson Financial.
Tubbs, M. (2007): The relationship between R&D and company performance, Research Technology Management, 50 (6), pp. 23-30.
U.S. Census Bureau. (2002): 1997 economic census, In U. S. C. Bureau (Ed.).
Venkatesh, P.C., Chiang, R. (1986): Information asymmetry and the dealer’s bid-ask spread: A case study of earnings and dividend announcements, Journal of Finance, XLI (5), pp. 1089-1102.
Wernerfelt, B., Montgomery, C. (1988): Tobin’s q and the importance of focus in firm performance, American Economic Review, 78 (1), pp. 246-250.