DATA – a sustainable performance accounting framework for SMEs. From macro planetary boundaries to micro economic Sustainable Earnings Before Interest and Tax – SEBIT.
Abstract
The present article introduces a framework for Small and Medium Enterprises (SMEs) to measure, monetise, integrate, and manage their sustainability within the limits of the planetary boundaries. This innovative approach aims to enable SMEs to transparently depict, monitor, and manage their transformation towards a fully sustainable business model based on key performance indicators. Using an exploratory process, an accounting framework (hereafter referred to as DATA) was developed involving projecting science based targets onto a company and subsequently associating them with a company-specific monetary value. In the examples of the University of Applied Sciences Fresenius in Idstein (hereafter referred to as HSF) and an additive-producing company from the south of Germany, findings show that it is feasible for SMEs to establish a Sustainable Accounting System with a manageable effort providing a comprehensive economic result in the form of Sustainable Earnings Before Interest and Tax (SEBIT). Currently, the EFRAG (European Financial Reporting Advisory Group) as well as the ASCG (Accounting Standards Committee of Germany) amongst others are discussing and developing reporting standards that will lead to integrated financial sustainability reportings. DATA represents a method for chemistry SMEs, amongst others, to prepare for the upcoming monetary reporting standards and to take sustainability management to the next level. This paper contributes to the field of management control systems, sustainability control systems, sustainable performance accounting, sustainable development performance indicators, and science based targets.
1 Introduction
As part of the economics lecture for chemists during the winter term 2021 at the private Fresenius University of Applied Sciences, the models and theories of Farley and Daly from their ground-breaking book Ecological Economics (2010) were presented. In this book, they make it very clear, that assuming we want to preserve our world and secure the well-being of our societies, we need to redefine the goals and evaluation of our economic activities. Organizations will have to account for all resources and impacts necessary to provide their product or service, including those imposed on the planet and its ecosystem services. In a sustainable economy, a company can no longer claim to be successful if it shows short-term profits at the expense of future generations (Elkington, 1999; Raworth, 2018; Steffen, et al.; 2015).
As a result of the very lively discussions with the students, and the fact that currently the EFRAG (European Financial Reporting Advisory Group) as well as the ASCG (Accounting Standards Committee of Germany) amongst others are discussing and developing reporting standards aiming for an integrated financial sustainability reporting, we asked ourselves whether there was a way to include sustainability activities and investments into a financial report. Thus, in early spring of 2022 members of the Department of Business Chemistry came together to discuss, how our university could be a more sustainable organization and how we could prepare ourselves for upcoming sustainability accounting standards. At this moment, it became clear that we had to understand the current level of sustainability as well as the needed level of sustainability according to the planetary boundaries. In order to do so, we needed to integrate the accountants and controlling experts from the start. We therefore invited a colleague from the HSF controlling team to join our research group and agreed that we wanted to transform the current, rather idealistic, mainly qualitative discussions within our organization, into a transparent, quantitative, and standard management issue. The goal was to enable our management to make educated and contextualized decisions based on the following three questions:
1. How sustainable are we as an organization, now?
2. How sustainable should we be, according to the planetary boundaries?
3. How do sustainability measures influence our financial result?
In the weeks to follow, we were searching for a framework that would answer these questions. We were expecting a framework that would transform planetary goals into KPIs that could easily be used by our controlling for our financial statement. Soon, we came across frameworks like Welfare Economics, QuartaVista, and VBA (Value Based Accounting Alliance). However, the first worked with qualitative scores, the second had very much specialized on agricultural organisations making it difficult to generalize and the latter had chosen an approach depending on a definition of impact values of e.g. greenhouse gas emissions (GHG) which in our opinion leaves too much room for endless discussions about said values (Felber, 2018; Lay-Kumar, et al., 2021; Lay-Kumar, et al., 2023).
We, therefore, decided to develop an alternative framework and defined the following five basic criteria:
1. The framework has to be in line with the planetary boundaries.
2. The framework has to be generally applicable to all sustainability standards.
3. The framework has to be easy to understand and easy to apply.
4. The framework has to be adaptable to current and potentially future accounting standards.
5. The framework has to cumulate into a financial KPI, “SEBIT”, Sustainable Earnings before Interest and Tax, that could be compared between organizations and years, respectively.
As a result, we developed an accounting framework called “DATA”. This framework incorporates science-based planetary boundaries into sustainable development performance indicators, and monetises them on a cost-based approach into an accountable value that can be booked into the financial statement. We tested the framework using CO2 as the sustainability indicator on the HSF itself covering the years 2017 to 2021 and on a SME from the south of Germany producing additives, covering the year 2021. The methodology and results presented were developed at the University for Applied Sciences Fresenius, hereafter referred to as HSF, in Idstein, Germany, between September 2022 and February 2023.
2 Method
The development of the DATA framework was based on the prior work of Lay-Kumar et al. (2021) and their Four-Phase Framework as presented in Figure 1.
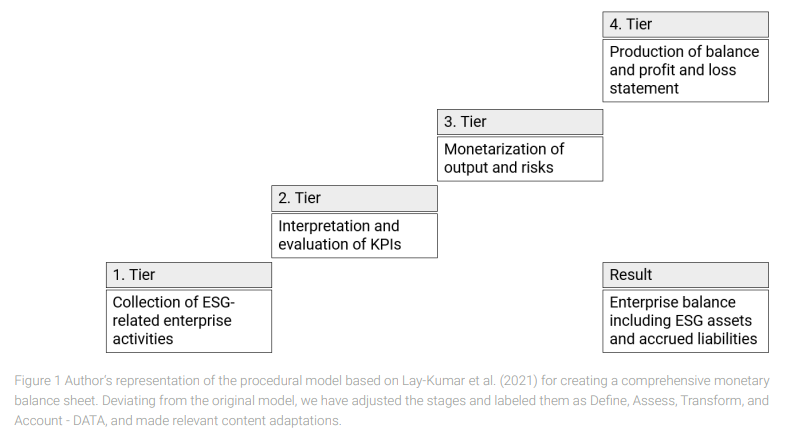
Define
In the Define phase, all sustainability-related activities of the company are defined, along with the basics for the subsequent Assess phase. For this purpose, a framework is chosen that defines the domains of sustainability, such as the ESG framework (Haberstock, 2019). The definition of subdomains is derived from the Tier Two-Indicators of the User Manual for the Sustainable Development Performance Indicators, Authentic Sustainability Assessment (ASA) (Yi et al., 2022). Finally, the data for each indicator in the company is collected and analysed for a one-year period, as depicted in Figure 2.
Governments have introduced milestone targets towards absolute sustainability that we will call relatively sustainable. A company is considered relatively sustainable when it stays within the allowed milestone target for the current reporting year, for example, in terms of meeting GHG emission targets set by the Paris Agreement or the German Climate Protection Act (KSG).
First, we have to define a so-called baseline target (BT) according to a or b:
a. Science-BT: The planetary or regional baseline targets, also known as science based targets (SBT), are provided by laws, standards, and regulations such as the Federal Climate Protection Act, GRI, SDG, Science Based Target initiative, or the Paris Climate Agreement, which seek to transfer scientific findings on sustainability into necessary actions required.
b. Best in Class-BT: In those cases where official entities do not provide planetary or regional baseline targets, an alternative definition of the Baseline Target can be established based on the “Best-In-Class“(Mittelstaedt, 1992) approach, using nationally or globally collected statistics, referred to as the Best in Class Based Target (BCBT).
Second, we have to break down BT to the specific target of our organization. Therefore, we need to define what kind of organization we want to analyse. We generally discriminate between service companies and production companies.
Define an Organizational Target depending on the type of company.
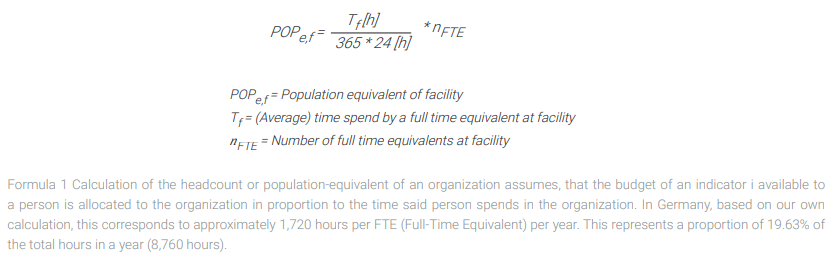
c. Service companies: The calculation of the SBTO (Science Based Target of Organization) for a service company is done using the “headcount“ method, which calculates the SBTO of the company from the BT considering the population of the country where the operation is located, the full-time equivalents of the company, and their average tenure in the company (see Formula 1) (Wang, Hopeward, Yi, McElroy, & Sutton, 2022, S. 1191).
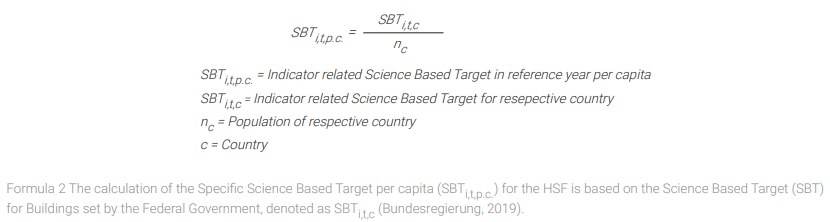
The SBT of an indicator i in the base year t per capita (SBTi,t,p.c.) is calculated by dividing the SBTi,t of the corresponding country (c) by the population of that country, as shown in Formula 2.
The SBTO for the indicator i for the respective year t and facility f can be calculated by multiplying the specific population equivalent with the per capita SBT of the corresponding indicator for the reporting year, as shown in Formula 3.

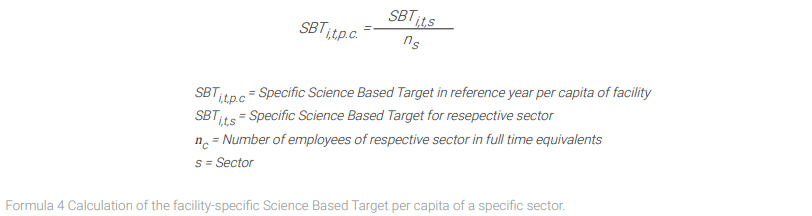
d. The calculation of the Organizational Target (SBTO) for a production company can be based on a variation of the headcount method, taking into consideration the SBT or BCBT of the sector and the number of employees in the corresponding sector, as shown in Formula 4.
The SBTO of indicator i for the corresponding year t is calculated by multiplying the full-time equivalents of the company nf,t for facility f with the per capita SBT of the sector (SBTi,t,p.c.), as shown in Formula 5.

Since the emissions and employment data for the sectors in Germany are well documented, the corresponding SBTO or BCBTO can be easily researched and calculated with minimal effort.
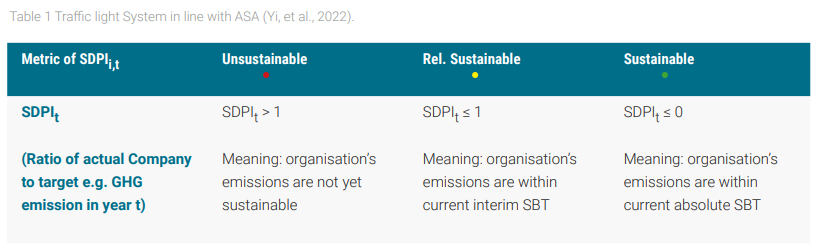
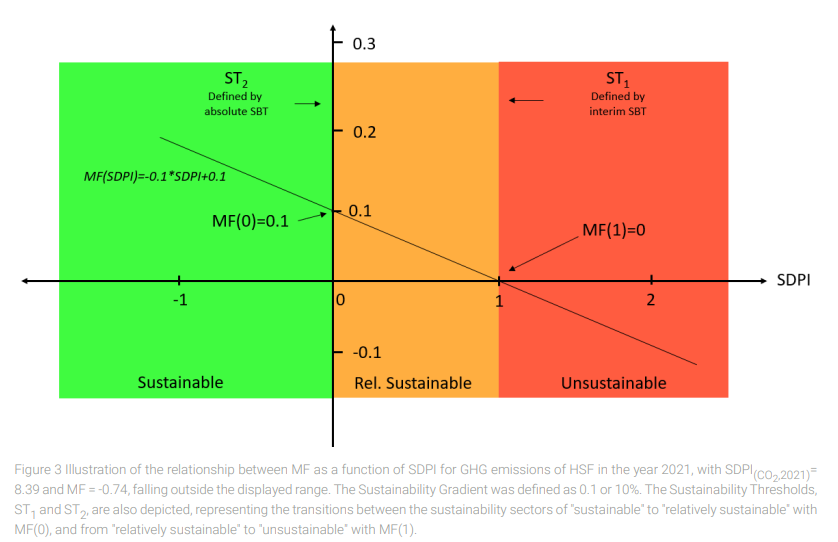
For the investigated case of HSF, the company was defined as a service provider, and the SBTO of HSF was calculated based on the SBT for the “Buildings“ sector. The underlying assumption is, that while employees are spending time at their workplace, they are not emitting CO2 at their private homes at the same time. Emissions from commuting employees towards and from their working places were excluded. Scope 1 and Scope 2 Emissions were cumulated in one position by choice and can be accounted for separately. The definition of two boundaries between the three sustainability sectors, referred to as Sustainability Sector thresholds (ST1 and ST2) between “not sustainable“ and “relatively sustainable“ (ST1), and between “relatively sustainable“ and “sustainable“ (ST2), was based on the ASA Handbook (Yi, et al., 2022).
Assess
The linkage between Indicator i, the respective BT, and the SBTO or BCBTO is established using Sustainable Development Performance Indicators, also referred to as SDPIs. The SDPI for Indicator i at facility f in year t is calculated as the actual GHG emissions at the site in the given year, A [t], divided by the SBTO for GHG at the site during period t.
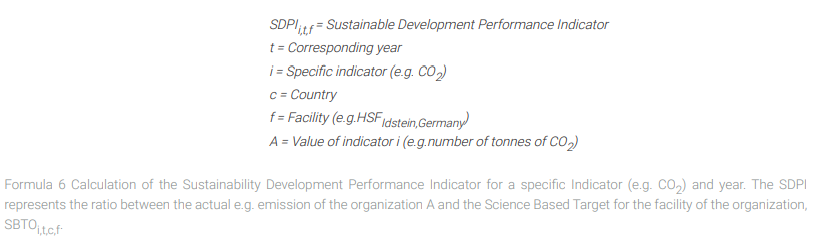
The Sectoral Threshold ST1 is defined as an SDPI value of 1. For example, if the GHG SDPI value is 1, it means that the company has emitted as much GHG as allowed according to the SBTO or BCBTO defined for that year. On the other hand, ST2 is defined with an SDPI value of 0. This indicates that the company either did not emit any GHG or achieved net-zero emissions through appropriate compensation measures in that year, as shown in Formula 6 and Table 1.
This definition of sustainability allows for a rough classification of the company into respective sustainability sectors. However, an accurate financial assessment of the company‘s success is not yet possible using only non-monetary indicators. To achieve this, the SDPIs need to be monetised in the next step.
Transform
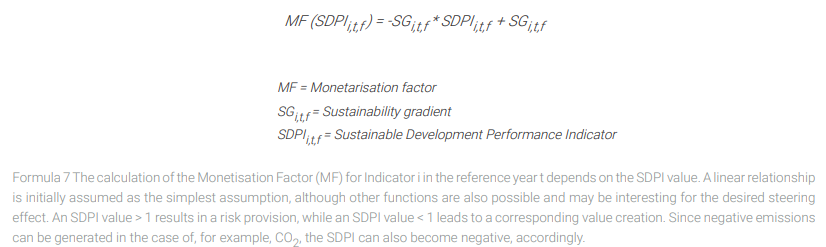
To monetise indicator i in the reference year t, we have introduced a Monetisation Factor (MF) based on the Quarta-Vista approach (Lay-Kumar et al., 2021). The MF is multiplied by the specific monetary cost (SMC) associated with a particular indicator i, resulting in an accountable value (AV) that may need to be booked as either value creation or risk provision, depending on the algebraic sign. The MF is equal to 0 when the SDPI value is 1 or ST1(1) = 0, indicating that the interim SBT has been met. There is no value creation or risk provision at this point. At the transition from relative to absolute sustainability, the Sustainability Gradient (SG) is defined. Up to now, there is no rule on how big or small the sustainability gradient should be. Therefor the definition of the SG is totally up to the organization. However, it is to be expected, that governments will instruct on the SG an organization will be allowed to apply. The SG can take on a value ≥ 0. Therefore, ST2(0) = SG ≥ 0. The SG represents the slope of the linear Monetisation Function, from which each MF(SDPI) can be calculated, as shown in Formula 7.
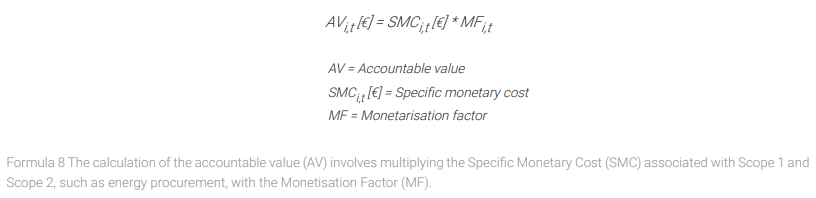
The MF in % represents the proportion of the SMC of an indicator that the company can credit as activated own performance and value creation, or book as expense and risk provision. The corresponding absolute Accountable Value of indicator i in the reference year t is then calculated as shown in Formula 8.
Account
The accounting of the accountable values is conducted in accordance with the legal regulations of the respective country. As the present study was conducted in Germany, double-entry bookkeeping was based on the Commercial Code (HGB) for companies subject to mandatory bookkeeping, as well as the standard chart of accounts (SKR04) provided by DATEV, which complies with the requirements of the Bilanzrichtlinie-Umsetzungsgesetz (Directive Implementation Act). Environmental benefits, such as reducing specific GHG emissions below the SBTO, are recorded as revenue under “Other capitalized own work“ in the income statement (GuV) and recognized as a sustainable intangible asset in the “Self-created intangible assets“ section of the company‘s balance sheet. The asset is amortised in the income statement through “Amortisation of intangible assets and property, plant and equipment“ over the appropriate period, which must be determined specifically for SDPI. If the SBTO is exceeded, it is recorded as an expense in an account within “Other operating expenses“ in the income statement and recognized as “Other provisions“ in the balance sheet. These risk provisions remain until the generated risk, i.e., climate change, is stopped or until corresponding positive measures by the company allow for dissolution in a corresponding amount (Lay-Kumar, et al., 2021; DATEV, 2023). However, since SEBIT is not currently anchored in national accounting regulations, it can only be used for trend analysis and internal control purposes of the SDPI.
The SEBIT would be finally calculated as shown in Formula 9:


3 Results
Case 1: Production company
An international chemistry SME specialized on the production of additives, has a production site in the south of Germany employing 95 people in 2021. The Scope 1 and Scope 2 Emission of CO2 was 3,071 t (A). Using formula 2 we calculated the SBT for chemical/pharmaceutical (c/p) industry (isolated emission data for chemical industry were not available) by multiplying the sectoral industry target from the KSG 2021 (182 Mio. t CO2) by the share of the emissions of the c/p-industry in 2021 (26.3%): SBT = 47.8 Mio. t CO2 (2021). To calculate the SBTO (formula 4 and 5) of the south German facility we divided the SBT by the number of employees in the c/p-industry in 2021 (0.4945 Mio.) and multiplied the result by the number of employees at the south German facility (95): SBTOrelative = 9,182 t CO2. Using formula 6 we then calculated the SDPI by dividing A (3,071 t) by the SBTO: SDPIrel. = 0.33. A SDPI < 1 proves relative sustainability (table 1).
We then tested for absolute sustainability by using a global SBT of 3 t CO2 emission per capita (Friedlingstein, et al., 2022). With a German population of 83.2 Mio. the SBT of Germany was 249.6 Mio. t CO2 in 2021. To find the absolute sustainable SBT of the c/p-industry we calculated the share of the c/p-industry emissions on total emissions in Germany (6%) and multiplied them with the SBT of Germany: SBTc/p-industry = 15 Mio. t CO2 in 2021. The SBTO would therefore be 15 Mio. t CO2 divided by 0.4945 Mio. people employed in the c/p-industry multiplied by the employees (95) of the south German facility: SBTOabsolute = 2,882 t CO2. The SDPIabs. was then calculated by dividing A (3,071 t CO2) by SBTOabs.: SDPIabs. = 1.06 showing the South German facility to be close to absolute sustainability regarding its CO2 emissions.
Since relative sustainability is the current goal of the German government, we decided to continue with the SDPIrel. to monetise the findings. To receive the accountable value for the CO2 emissions we had to define a Sustainability Gradient (SG) as in formula 7. However, since there aren’t any regulations in place, we decided to incentivise zero emission with 10% and the achievement of the relative emission goal of 9,182 t CO2 with 0% of total CO2-related cost, respectively. This definition leads to a MF-function as in formula 7:
MF(SDPI) = -0.1 * SDPI + 0.1
And in the case of the SDPI = 0.33 to a monetarization factor of 0.066. With a value of total CO2 related cost of the south German facility of 1,197,882 € the accountable value would be 79,060 €. As a result, the SEBIT would be SEBIT = EBIT + 79,060 €. Since this value can be interpreted as an investment into a non-tangible asset, we suggest depreciating the value on a straight-line basis over 5 years.
Case 2: Service provider
For the HSF data from the years 2017 – 2021 were available leading to the following results shown in Table 2:
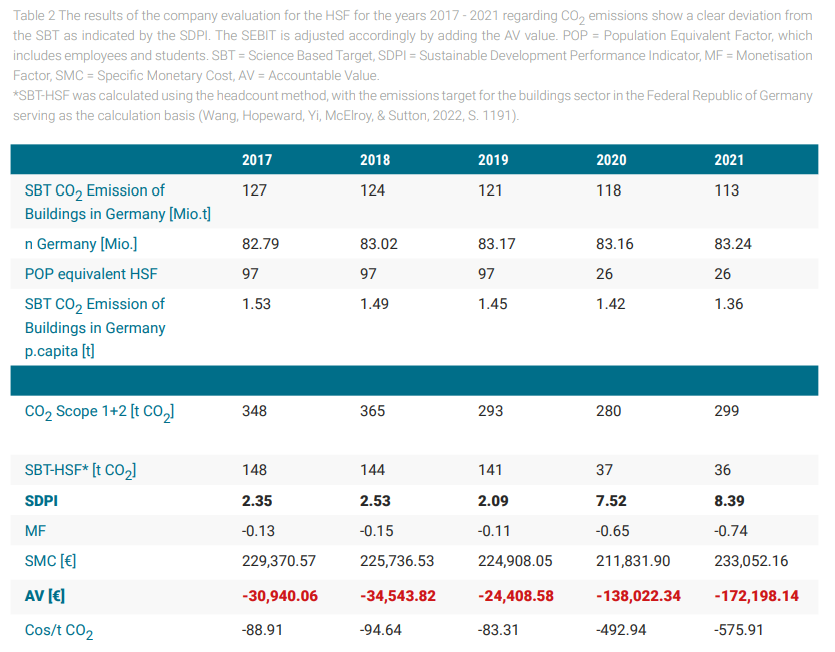
The significant increase of the SDPI for the years 20/21 compared to 2019, being the last year before the pandemic, is attributed to the low utilization of HSF buildings, coupled with an almost unchanged energy consumption. This analysis does not consider the fact that the energy consumption of both employees and students in their own buildings and residences has increased during the same period, due to longer daily stays and intensive internet usage during work or lecture hours. The SEBIT for HSF would exemplarily be SEBIT = EBIT – 172,198.14 € in 2021.
4 Discussion and conclusions
Using the examples of the GHG emissions of HSF at the Idstein campus from 2017 to 2021 and the CO2 emissions of a SME from the chemical industry, we have demonstrated that DATA produces a plausible and transparent SEBIT. This allows management to contextualise its economic results within planetary boundaries and capture the actual success, considering all “costs“ and impacts. Since there is currently no legal obligation to monetise a company’s sustainability-related activities, the creation of SEBIT serves as an internal tool for managing its sustainability goals, only. The results of the chemical industry SME show, that paying an enhanced price for renewable energy sources can be recompensated by incentivising CO2 emissions that are below the current science based targets. They also show that there can be a rather large gap between relative and absolute sustainability factors. For future works, further data needs to be included and more Sustainability indicators to be defined.
For HSF Table 2 shows that there were significant increases in CO2 emissions in 2020 and 2021. The SDPI2020, CO2 worsened from 2.09 in 2019, the last year before the pandemic, to 7.52 in 2020 and 8.39 in 2021. This indicates that despite the reduced use of the buildings by the HSF employees and students during the pandemic, HSF was not able to effectively reduce its CO2 emissions. For future works, more refined data needs to be monitored and more sustainability factors to be defined.
The Sustainability Gradient influences the monetisation factor, by determining the degree to which the SDPI will be accounted for as value-enhancing or -reducing. The subjective definition of the Sustainability Gradient currently makes it impossible to compare different companies with each other using the SEBIT. In contrast, SDPI indicates whether a company is operating within the sustainable, relatively sustainable, or non-sustainable range, and therefore is already suitable for comparing sustainability performance among companies within a sector. By using SDPI, we avoid the monetary valuation of individual ecosystem services or socio-economic activities, which continue to pose challenges. Once legally established, monetisation can steer entire sectors of the economy in a certain direction without the need to introduce new taxes. Market mechanisms are only relevant within planetary boundaries. Beyond said boundaries, there can be no market without destroying the basis of life on the planet.
References
DATEV (2023): Die DATEV Standard-Kontenrahmen, available at https://www.datev.de/web/de/m/ueber-datev/datev-im-web/datev-von-a-z/skr-standard-kontenrahmen/, accessed 16 January 2023.
Daly, H. E., Farley, J. (2010): Ecological Economics: Principles and Applications, 2nd ed., Island Press, Washington.
Elkington, J. (1999): Cannibals with Forks, Capstone Publishing Ltd, Oxford.
Felber, C. (2018): Gemeinwohl-Ökonomie, Piper Verlag, Munich.
Friedlingstein, P., O‘Sullivan, M., Jones, M. W., Andrew, R. M., Gregor, L., Hauck, J., Le Quéré, C., Luijkx, I. T., Olsen, A., Peters, G. P., Peters, W., Pongratz, J., Schwingshackl, C., Sitch, S., Canadell, J. G., Ciais, P., Jackson, R. B., Alin, S. R., Alkama, R., Arneth, A., Arora, V. K., Bates, N. R., Becker, M., Bellouin, N., Bittig, H. C., Bopp, L., Chevallier, F., Chini, L. P., Cronin, M., Evans, W., Falk, S., Feely, R. A., Gasser, T., Gehlen, M., Gkritzalis, T., Gloege, L., Grassi, G., Gruber, N., Gürses, Ö., Harris, I., Hefner, M., Houghton, R. A., Hurtt, G. C., Iida, Y., Ilyina, T., Jain, A. K., Jersild, A., Kadono, K., Kato, E., Kennedy, D., Klein Goldewijk, K., Knauer, J., Korsbakken, J. I., Landschützer, P., Lefèvre, N., Lindsay, K., Liu, J., Liu, Z., Marland, G., Mayot, N., McGrath, M. J., Metzl, N., Monacci, N. M., Munro, D. R., Nakaoka, S.-I., Niwa, Y., O‘Brien, K., Ono, T., Palmer, P. I., Pan, N., Pierrot, D., Pocock, K., Poulter, B., Resplandy, L., Robertson, E., Rödenbeck, C., Rodriguez, C., Rosan, T. M., Schwinger, J., Séférian, R., Shutler, J. D., Skjelvan, I., Steinhoff, T., Sun, Q., Sutton, A. J., Sweeney, C., Takao, S., Tanhua, T., Tans, P. P., Tian, X., Tian, H., Tilbrook, B., Tsujino, H., Tubiello, F., van der Werf, G. R., Walker, A. P., Wanninkhof, R., Whitehead, C., Willstrand Wranne, A., Wright, R., Yuan, W., Yue, C., Yue, X., Zaehle, S., Zeng, J., and Zheng, B. (2022): Global Carbon Budget 2022, Earth System Science Data, 14 (11), pp. 4811–4900.
Haberstock, P. (2019): ESG-Kriterien, available at https://wirtschaftslexikon.gabler.de/definition/esg-kriterien-120056/version-369280, accessed 17 April 2023.
Lay-Kumar, J., Hiß, C., Heck, A., Fus, E., Saxler, J., Rohloff, J., Metz, A., Mark, C. (2021): Regionalwert AG Freiburg Abschlussbericht QuartaVista Teil 1: Konzept, Regionalwert AG, Freiburg.
Lay-Kumar, J., Walkiewicz, J., Hiss, C., Heck, A., Zwick, Y., Jeromin K. (2023): Sustainable Performance Accounting als Schlüssel für die Nachhaltigkeitstransformation – Einsichten aus dem Projekt QuartaVista, in: Zwick, Y., Jeromin, K. (ed.), Mit Sustainable Finance die Transformation dynamisieren: Wie Finanzwirtschaft nachhaltiges Wirtschaften ermöglicht, Springer Gabler, Wiesbaden, pp. 187-199.
Mittelstaedt, R. E. (1992): Benchmarking: How To Learn from Best-In-Class Practices, National Productivity Review, 11 (3), pp. 301-315.
Raworth, K. (2018): Die Donut-Ökonomie – Endlich ein Wirtschaftsmodell, das den Planeten nicht zerstört, Carl Hanser Verlag, Munich.
Steffen, W., Richardson, K., Rockström, J., Cornell, S. E., Fetzer, I., Bennett, E. M., Sörlin, S. (2015): Planetary boundaries: Guiding human development on a changing planet, Science, 347 (6223), pp. 736-747.
Wang, X., Hopeward, J., Yi, I., McElroy, M. W., & Sutton, P. C. (2022): Supporting the Sustainable Development Goals: A context sensitive indicator for sustainable use of water at the facility level, Sustainable Development, 30 (5), pp. 787- 1450.
Yi, I., Bruelisauer, S., Utting, P., McElroy, M., Mendell, M., Novkovic, S., & Lee, Z. (2022): Authentic Sustainability Assessment: A User Manual for the Sustainable Development Performance Indicators, United Nations Research Institute for Social Development, Geneva.